Today, market sentiment was ignited by two heavy-weight pieces of news. First, the U.S. Senate Banking Committee passed the CLARITY Act, providing a clear regulatory framework for the cryptocurrency industry, seen as a key catalyst for institutional funds to enter. Second, Hana Bank acquired a 6.55% stake in Upbit's parent company for $670 million, marking the direct involvement of a large South Korean bank in cryptocurrency asset trading platforms, indicating the acceptance of cryptocurrency assets by traditional finance is moving from the fringe to the core. These two pieces of news combined directly propelled BTC to break past the $82,000 mark, with a 24-hour increase of 3.51%. In the Qinglan Crypto Classroom, we have consistently emphasized that clear regulations and institutional involvement are the underlying logic of a bull market, and the current signals are reinforcing this trend.
Current Price and Time
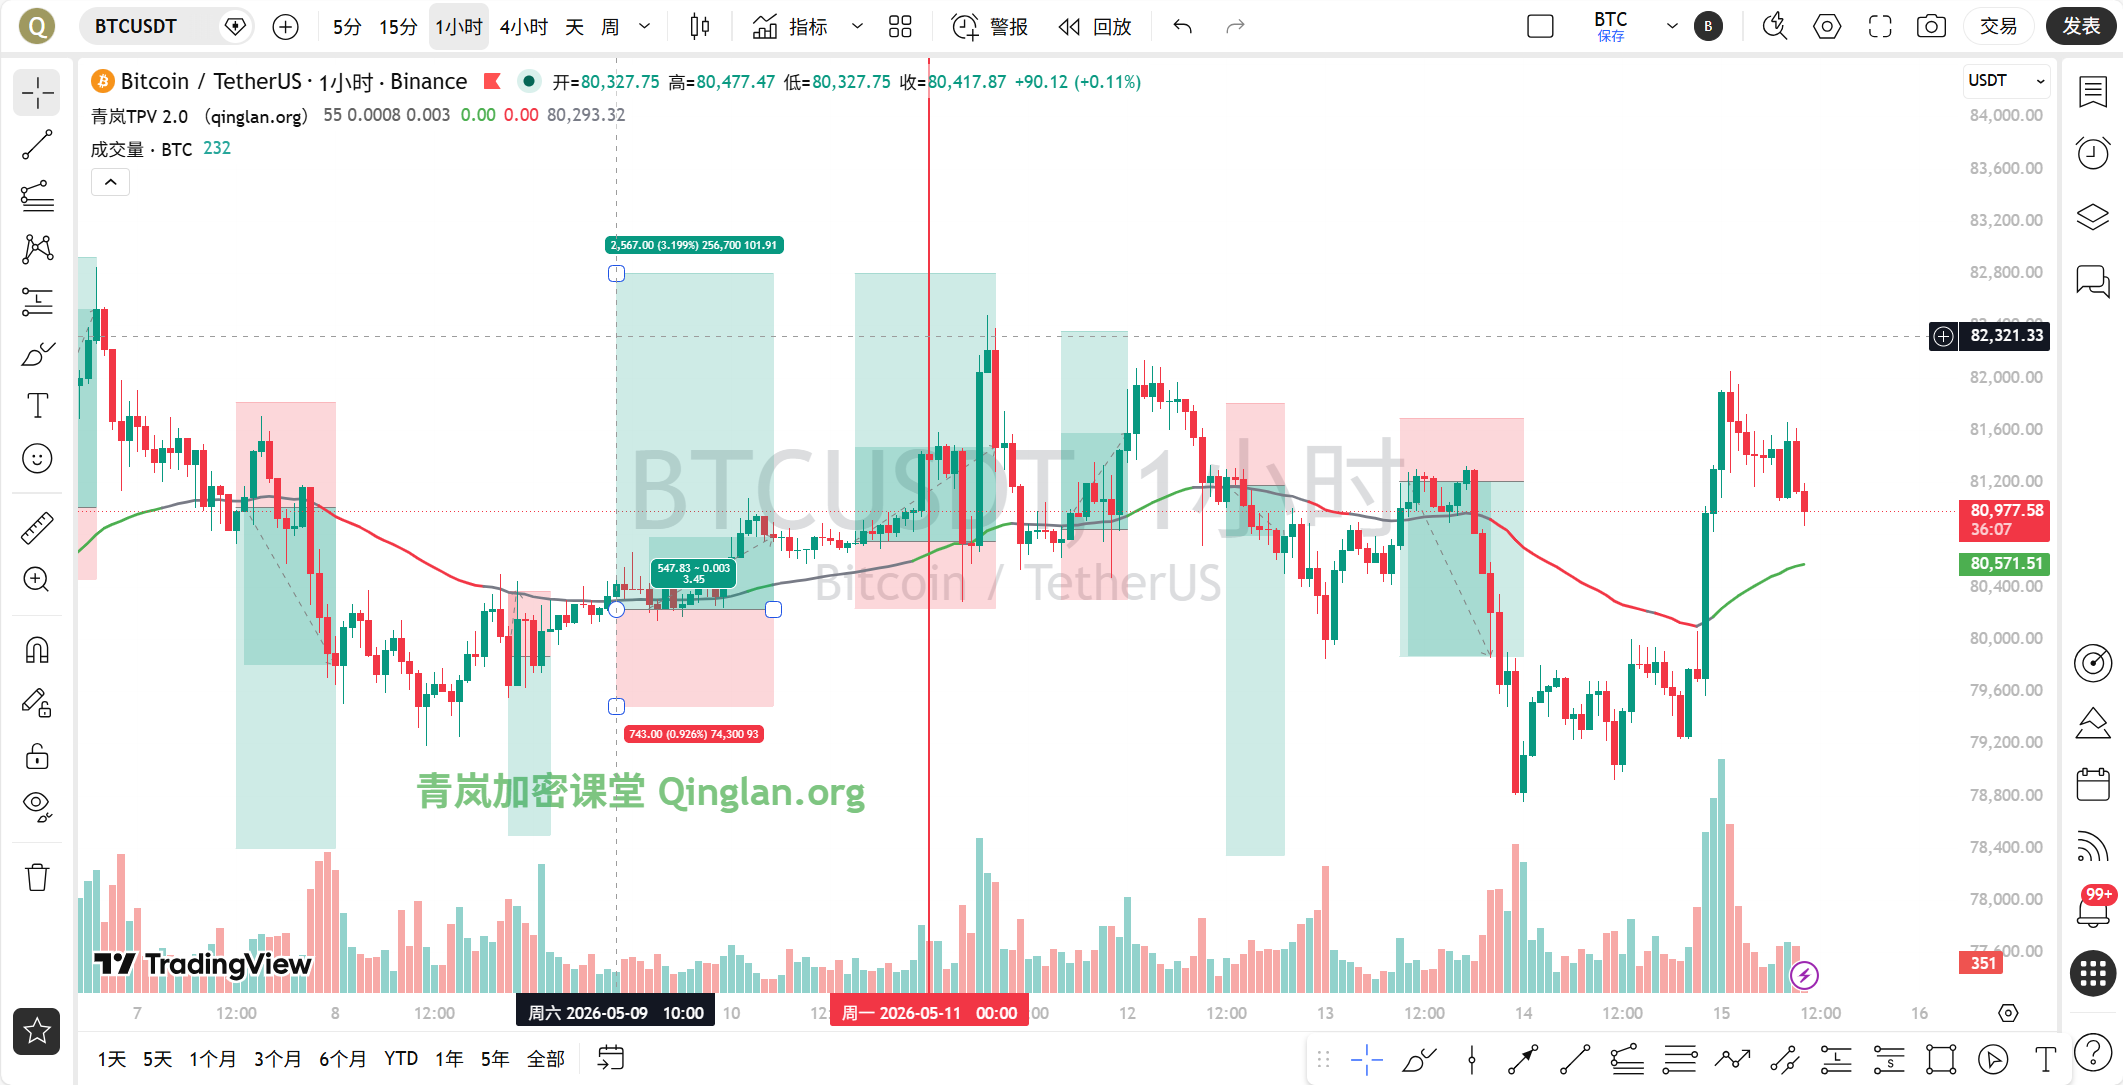
The current time is May 15th, 10:22 AM, with BTC priced at 80,963 USDT. After breaking above $82,000, there has been a slight pullback in price, but overall it remains in a high volatile range. From a technical perspective, the market is digesting short-term profit-taking, but the bullish structure remains intact.
Multi-period Status Overview
First, looking at the daily level. The daily MA5 and MA10 are 80,723 and 80,815 respectively, with the price firmly above the moving averages. Although the MACD histogram is negative, the DIF line is still above the DEA line, and the RSI is at 61.48, in a neutral to strong zone. Overall, the daily level presents a bullish arrangement, but MACD momentum is somewhat weakening, suggesting a potential slowdown in the upward pace.
On the 4-hour level, MA5 and MA10 are 80,806 and 80,060 respectively, with the price running above the moving averages. The MACD histogram is positive and increasing, and the DIF line is about to cross above the DEA line to form a golden cross, with the RSI at 50.74, in an equilibrium position. The 4-hour period shows obvious rebound momentum but has not yet entered the overbought zone, leaving room for upward movement.
The 1-hour level is crucial at this moment. MA5 and MA10 are 81,231 and 81,363 respectively, with the price slightly below the short-term moving averages. The MACD has just formed a death cross, and the histogram has turned negative, with an RSI of 64.39, pulling back from a high position. The 1-hour period shows a short-term pullback signal, but EMA55 is at 80,622, and the price remains above it, indicating that the bullish trend has not been damaged.
On the 15-minute level, MA5, MA10, and MA30 exhibit a bearish arrangement, with the MACD death cross continuing, and the RSI at 37.05, approaching the oversold area. The 15-minute period shows significant short-term selling pressure, but nearing oversold conditions could trigger a technical rebound.
TPV Signal Verification
Now, using the Qinglan TPV system to verify the current signal. First, looking at trend positioning, the current price is 80,963, with the 1-hour EMA55 at 80,622, and the price is above EMA55, thus in a bullish trend area. Oscillation auxiliary data shows that in the past 8 one-hour candles, the closing price was greater than EMA55 8 times, with 0 crossovers; the price is 0.42% away from EMA55, which does not meet the oscillation threshold, confirming the current unilateral bullish trend.
For long conditions, first, the price is stable above the 1-hour EMA55, and the last two one-hour closing prices are above EMA55, meeting this condition. Second, support has stabilized; the current price has pulled back from $82,000 to 80,963, finding support near EMA55 at 80,622, and the 15-minute RSI is close to oversold, with signs of bottom formation. Third, the downward momentum is weakening, with the 1-hour MACD histogram being negative but with limited shortening; confirmation is needed. Overall, some long conditions are met, but the signal for momentum exhaustion has not yet been fully confirmed, waiting for the MACD histogram to shorten for two consecutive cycles or for the RSI to rebound from a low position.
As for short conditions, the price being pressured below the 1-hour EMA55 is invalid, hence no short considerations.
On-chain/Funding Aspects
On-chain data shows that the Fear and Greed Index is at 34, in the fear zone, indicating that market sentiment is not overheated, which is actually a healthy signal for the bullish market. BTC's market share is at 58.37%, maintaining a high level, indicating funds are still concentrating on BTC. New addresses have accumulated 676 Bitcoins, worth over $55 million, which is a clear token hoarding behavior, reducing market circulating supply. CME plans to launch cryptocurrency index futures to increase institutional investment channels. All these data point towards a bullish funding landscape.
Key Attack and Defense Levels
Upward resistance levels: the first is at $82,000, which is today's high and a psychological barrier. The second resistance is at $83,000, which is a previously dense trading area. Downward support levels: the first is at the 1-hour EMA55 of $80,622, which is a lifeline for bulls. The second support is at the $80,000 round number; if broken, it may test near the 4-hour MA5 of $80,806.
Trading Thoughts
Based on the TPV system, the current state is in a bullish trend area, but the short-term pullback has not yet ended, thus a low long strategy is adopted, avoiding chasing highs.
Direction: Long
Entry Conditions: Wait for the price to pull back near the 1-hour EMA55, in the $80,600-$80,800 range, while observing a bottom formation or long lower shadow on the 15-minute level, and when the 1-hour MACD histogram begins to shorten. If the price directly breaks above $82,000 and stabilizes, consider adding long positions, but with a light position.
Stop Loss Level: Set below $80,000, at $79,950; if broken, the bullish structure is damaged.
Target Levels: First target $82,000, second target $83,000, third target $84,000. If it breaks above $83,000, look for $85,000.
Risk Warning
Pay attention to the follow-up progress of the CLARITY Act and changes in Federal Reserve policies; if negative news arises, it may trigger a rapid pullback, so strictly execute stop losses.
Follow the Qinglan Crypto Classroom to seize more trading opportunities! Welcome to visit the official website www.qinglan.org
📊 Qinglan TPV Trading Strategy Backtest Reference
🕒 Last Backtest Time 05-15 07:00:02
Total Analysis: 1533 Backtests: 1528 Accuracy: 66.4% (1015/1528)
免责声明:本文章仅代表作者个人观点,不代表本平台的立场和观点。本文章仅供信息分享,不构成对任何人的任何投资建议。用户与作者之间的任何争议,与本平台无关。如网页中刊载的文章或图片涉及侵权,请提供相关的权利证明和身份证明发送邮件到support@aicoin.com,本平台相关工作人员将会进行核查。