Waves in the Cryptocurrency Sea: 5.16 Bitcoin (BTC) Market Analysis Reference:
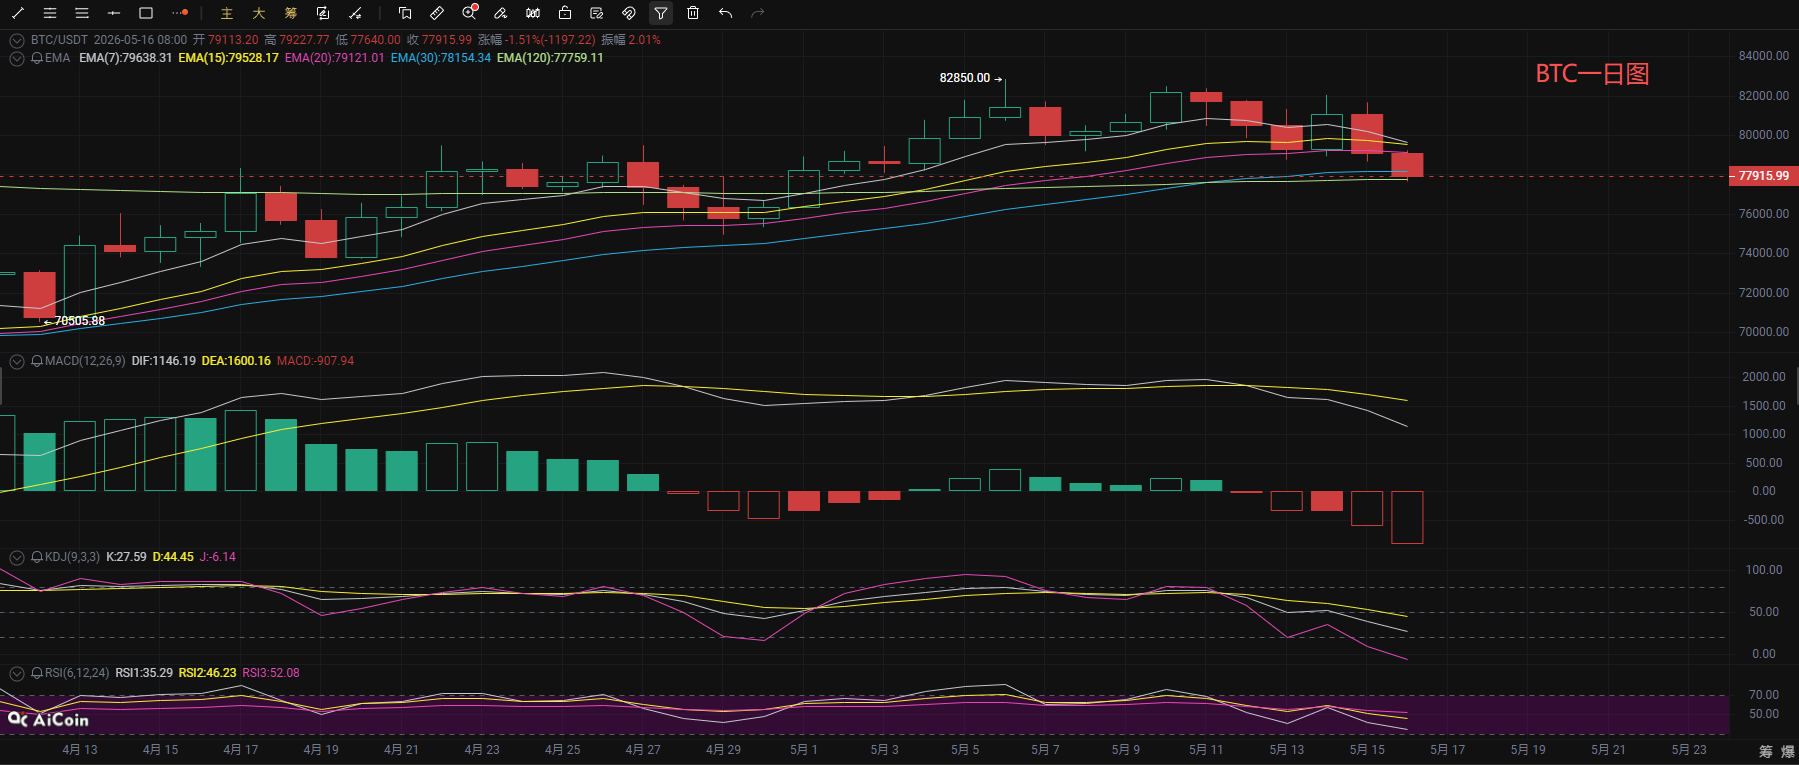
Recently, Bitcoin's market has continued its downward trend of fluctuation. From the daily chart perspective, the current price has fallen below the middle band of the Bollinger Bands and is approaching the lower band, with downward momentum continuously being released. On the technical indicators, MACD has formed a death cross, and the histogram is continuously amplifying, indicating a clear bearish trend; the KDJ indicator's three lines are synchronously heading downward, with the J value entering the oversold range but showing no turning signal; the RSI indicator is also retreating synchronously, and the short-term bullish strength is clearly diminishing. Simultaneously, the price has fallen below the short-term EMA moving averages, with only the EMA120 temporarily providing weak support. Overall, the daily level has entered an adjustment cycle, and there is a high probability that it will continue to fluctuate weakly and may further test the support of the lower band of the Bollinger Bands.
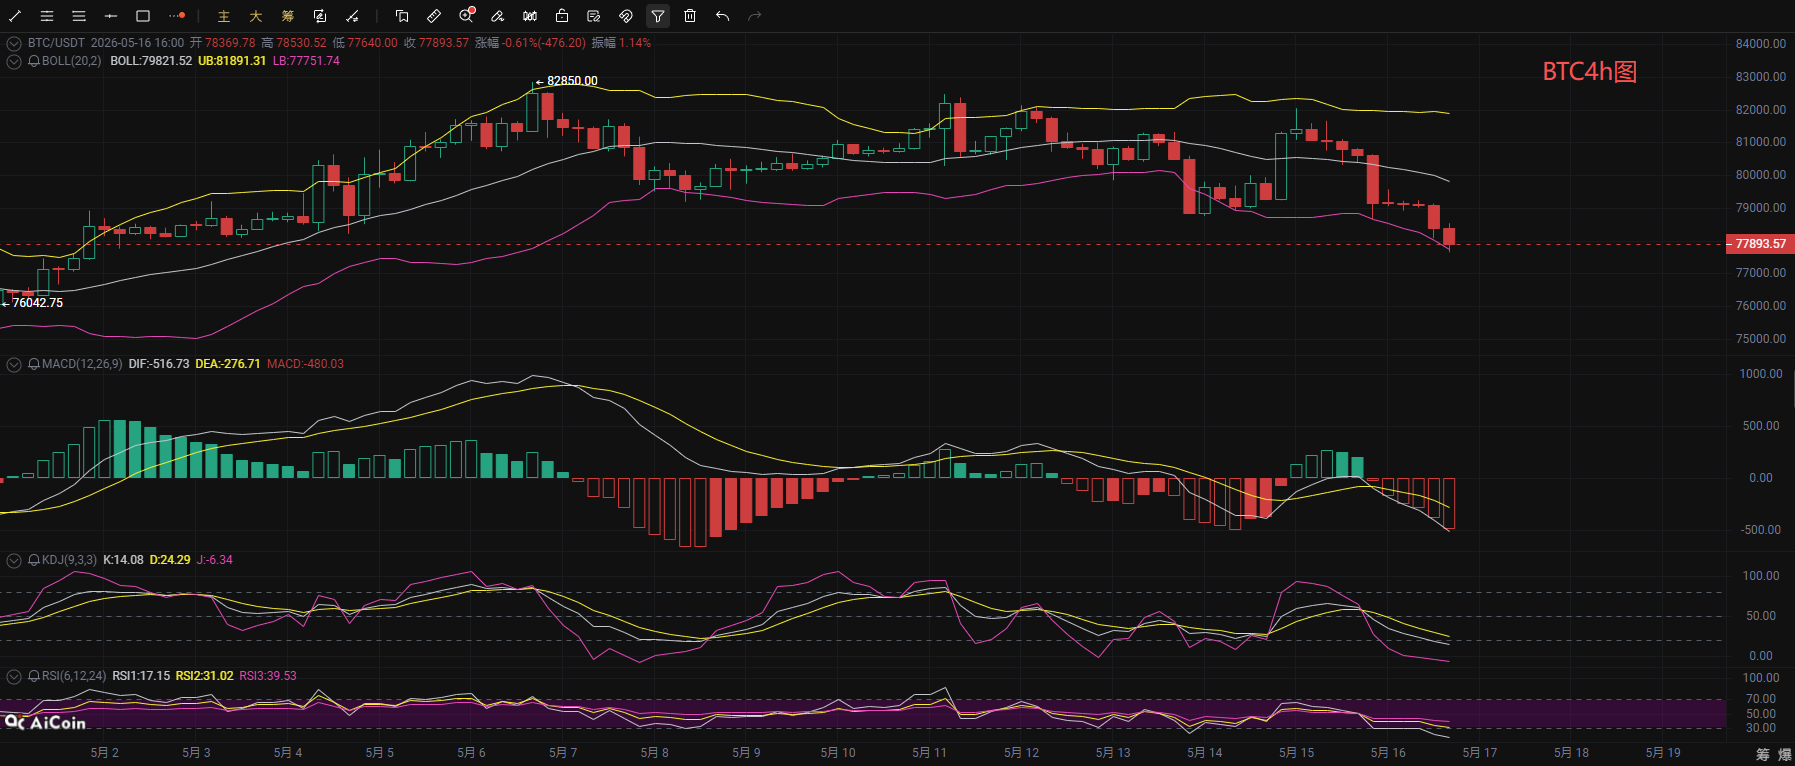
On the shorter 4-hour level, the downtrend of BTC is clearer, with the price continuing to decline along the lower band of the Bollinger Bands, reaching a low of around 77800. The MACD indicator's DIF line has crossed below the DEA line, with the histogram continuously expanding, indicating that bearish momentum is dominant; the KDJ indicator is all in the oversold range, and the J value has not yet turned, indicating insufficient short-term rebound momentum; the RSI1 has entered a severely oversold range. Although there is a technical rebound demand, it is clearly suppressed by the EMA moving averages; the price has fallen below all short-term EMA moving averages, with only the 120-day EMA creating reverse pressure. Overall, the bearish trend on the 4-hour level has been fully established, and even if a technical rebound occurs in the short term, it is likely to be a weak pullback, with strong resistance forming in the 79000-80000 range, where the rebound height is limited, and the downward trend has not shown a clear reversal signal. The suggested trading approach is to focus on shorting during rebounds.
Waves in the Cryptocurrency Sea: 5.16 Bitcoin Short-term Reference:
Long Position: Buy in the range of 76400-77400, with a stop-loss of 500 points, and target 78000-79000.
Short Position: Sell in the range of 80000-79000, with a stop-loss of 500 points, and target 78500-77500.
[The above analysis and strategy are for reference only. Please bear the risks yourself. The article's review and publication may have delays, and strategies may lack timeliness; do not operate blindly.]

This content is originally shared by 【Waves in the Cryptocurrency Sea】 and represents personal views only. The article may have delays in transmission; it is for reference only, and do not operate blindly! If you want to get more daily real-time orders, then follow my public account! Here, you can learn online technical analysis and also understand related knowledge about exiting positions. I have years of research experience in the market, focusing on the major trends in the cryptocurrency circle. Mainly responsible for analyzing and guiding investment operations in BTC, ETH, SOL, BCH, and other currencies. Welcome to study and learn together.
免责声明:本文章仅代表作者个人观点,不代表本平台的立场和观点。本文章仅供信息分享,不构成对任何人的任何投资建议。用户与作者之间的任何争议,与本平台无关。如网页中刊载的文章或图片涉及侵权,请提供相关的权利证明和身份证明发送邮件到support@aicoin.com,本平台相关工作人员将会进行核查。