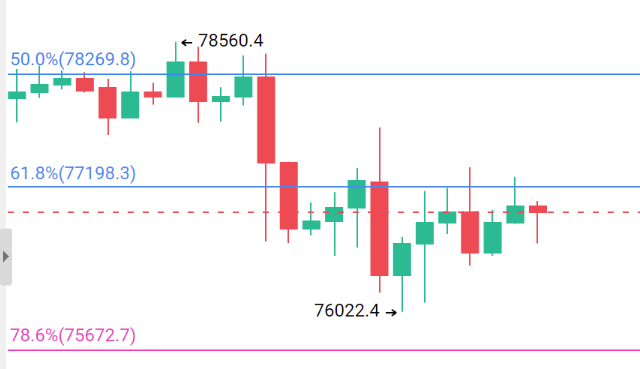
The market quickly dropped from the high point of 78560.4, with consecutive large bearish candles directly breaking through the key Fibonacci 50% and 61.8% retracement levels, with bearish momentum being concentrated and the bulls showing no resistance, making the downtrend completely dominant at one point.
After dipping to the stage low of 76022.4, the price entered a rebound phase, with multiple red and green K lines repeatedly fighting near the 61.8% retracement level (77198.3), with trading volume also showing a shrinking state.
This indicates that the bearish momentum is temporarily exhausted, and selling pressure has eased, but the bulls also lack the strength to break through key resistance, leaving the market in a typical continuation of the downtrend oscillation, with direction yet to be clarified.
Weak continuation projection: If the price remains under pressure at the key resistance level of 77198.3 without forming an effective breakthrough, it is highly probable that it will test the stage low of 76022.4 again;
Once this support is broken, the downtrend will continue, with the next target looking towards the 78.6% retracement level of 75672.7.

免责声明:本文章仅代表作者个人观点,不代表本平台的立场和观点。本文章仅供信息分享,不构成对任何人的任何投资建议。用户与作者之间的任何争议,与本平台无关。如网页中刊载的文章或图片涉及侵权,请提供相关的权利证明和身份证明发送邮件到support@aicoin.com,本平台相关工作人员将会进行核查。