Currency Ocean Waves: 6.11 Bitcoin (BTC) Market Analysis Reference:
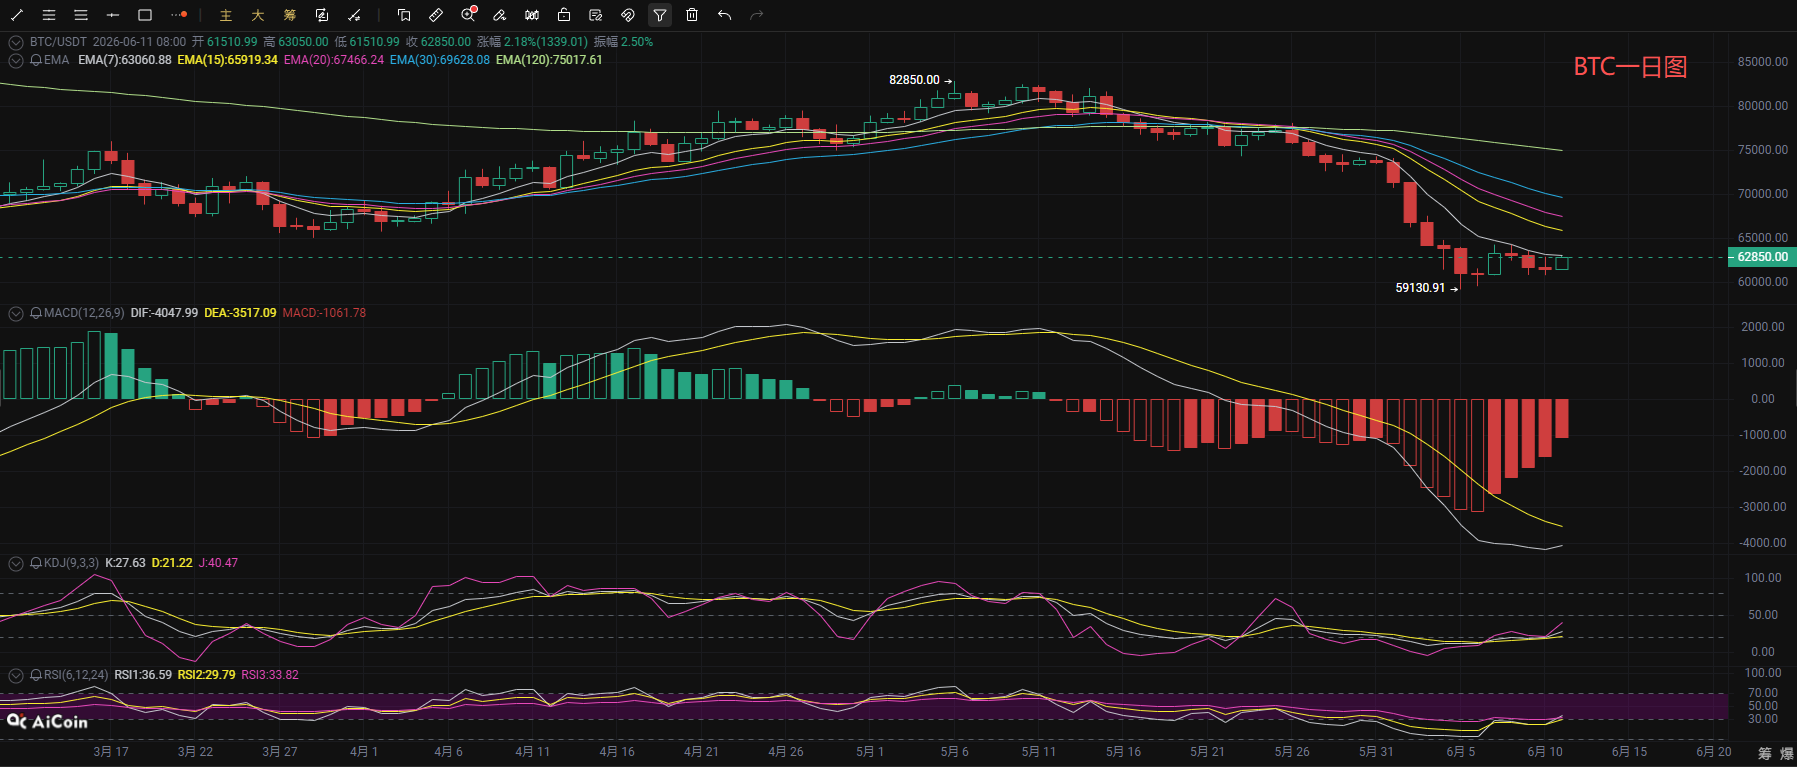
Bitcoin has been fluctuating upward during the day, with the current price at 62800. The daily chart remains dominated by bears, and all EMA moving averages display a bearish arrangement, creating strong resistance against price, with limited rebound height. The MACD indicator shows that the DIF has turned upward below the DEA, and the histogram is gradually shrinking; although the bearish momentum is marginally weakening, there is no clear reversal signal; the KDJ and RSI indicators have rebounded from low levels but remain in a weak zone below 50, indicating that bullish strength has yet to form an effective counterattack. Overall, the downtrend on the daily chart has not changed; currently, it is merely a weak rebound during the downward process, with short-term resistance concentrating at the key resistance EMA15 moving average (63055). If the rebound fails to break through this range, it is likely to continue the downward trend.
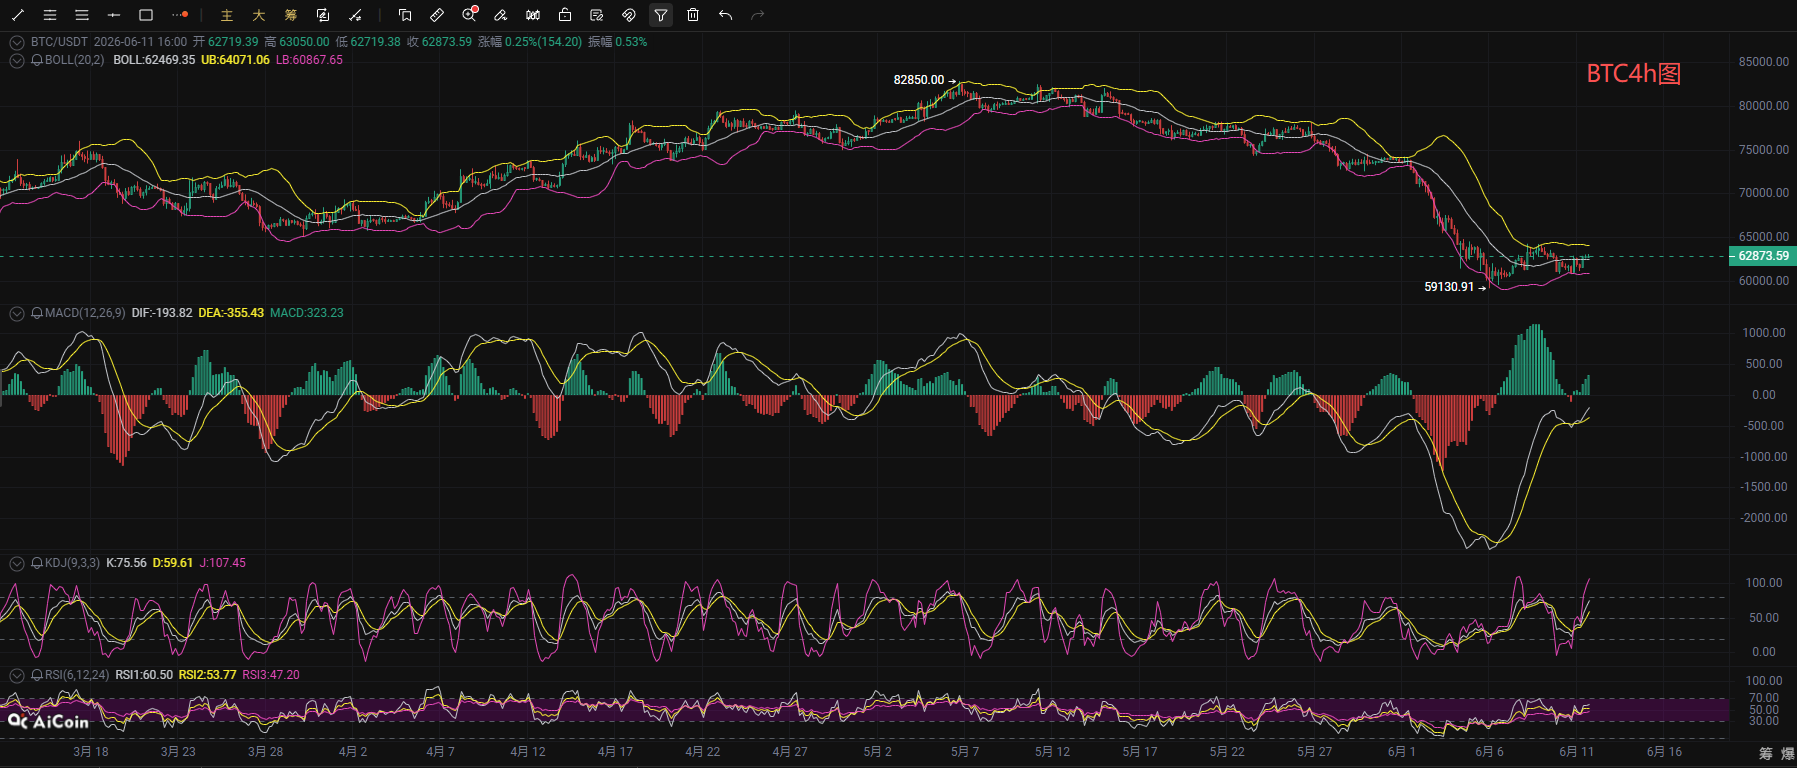
In the short-term 4-hour chart, the price is currently operating above the BOLL middle track, and the short-term EMA moving averages have shifted from a bearish arrangement to a flat consolidation, forming a short-term fluctuation range. The MACD indicator has completed a golden cross, and the histogram has turned positive and is continuing to expand, indicating that short-term bullish momentum is being released; even though the KDJ indicator is nearing the overbought area, it has not yet turned down, and the RSI three lines have rebounded to around 50, showing that short-term bullish strength is dominant. However, it is important to note that the current price is still under pressure from the long-term EMA120 moving average, with key resistance above being the BOLL upper track and the pressure point of the previous downward platform. If it fails to effectively break through this range, the fluctuating rebound is likely to be declared over, returning to the downward trend of the daily chart. It is recommended to focus on short positions.
Currency Ocean Waves: 6.11 Bitcoin Short-term Reference:
Long positions: Buy in the range of 60800-61800, stop loss 500 points, target at 62000-63000,
Short positions: Sell in the range of 64500-63500, stop loss 500 points, target at 63000-62000,
Currency Ocean Waves: 6.11 Ethereum Short-term Reference:
Short positions: Sell in the range of 1720-1680, stop loss 30 points, target at 1650-1620,
Long positions: Buy in the range of 1580-1620, stop loss 30 points, target at 1630-1680,
[The above analysis and strategies are for reference only. Risks are to be borne by yourself. Article review and publication or delays may cause strategies to lack timeliness. Do not operate blindly.]

This content is originally shared by 【Currency Ocean Waves】 and reflects personal opinions. There may be delays in publishing the article; it is for reference only, and please do not operate blindly! Want to get more daily real-time trades? Then follow my public account! Here, you can engage in online technical learning and understand knowledge related to exiting positions. I have many years of research experience in the market, focusing on the overall trend in cryptocurrency. I am mainly responsible for analyzing and guiding investment operations for BTC, ETH, SOL, BCH, and other currencies. Welcome to study and research together.
免责声明:本文章仅代表作者个人观点,不代表本平台的立场和观点。本文章仅供信息分享,不构成对任何人的任何投资建议。用户与作者之间的任何争议,与本平台无关。如网页中刊载的文章或图片涉及侵权,请提供相关的权利证明和身份证明发送邮件到support@aicoin.com,本平台相关工作人员将会进行核查。