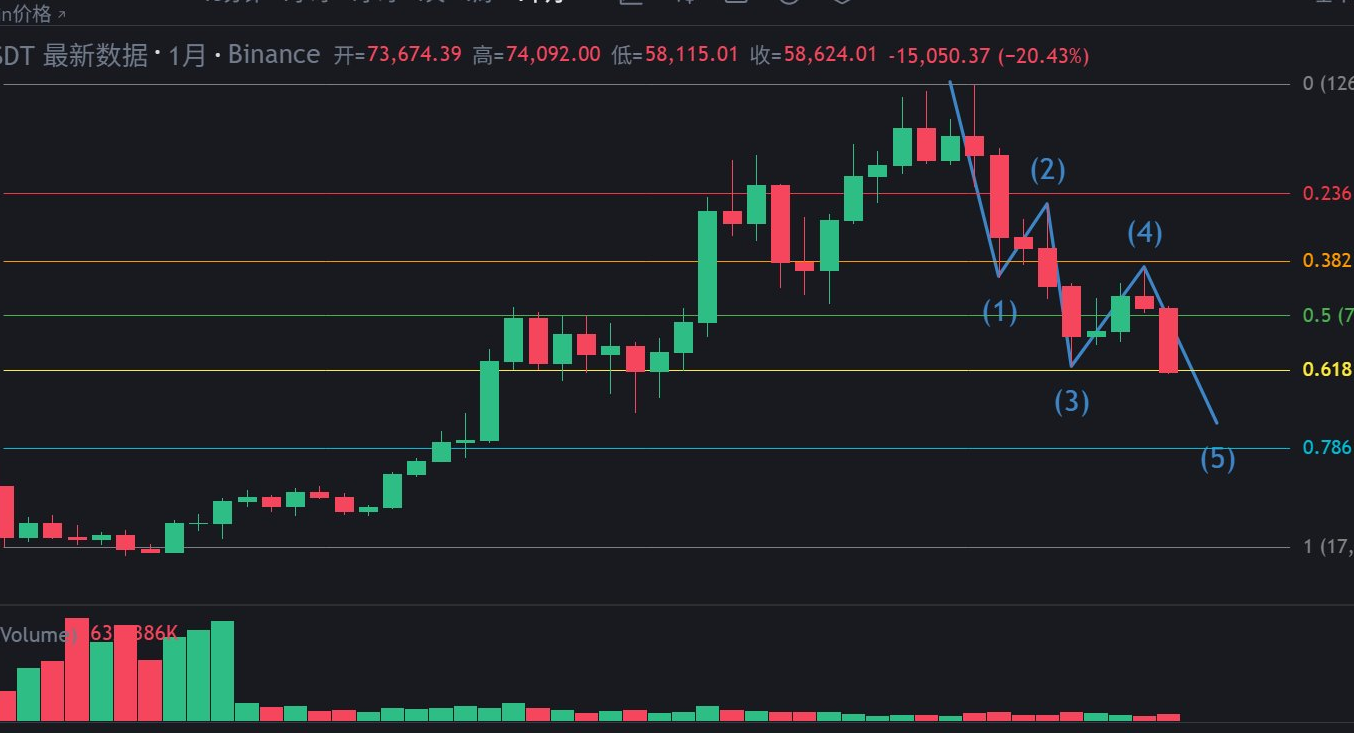
Dear friends, I am Sister Qinglan. Today, July 1st, the market can be described as being bombarded with negative news. In the spotlight news, Bitcoin plummeted to lose the $58,000 mark, with a daily decline of over 1%, while $343 million was liquidated across the network in 24 hours, affecting over 90,000 people. These two events directly reflect the spread of panic emotion in the market, escalating short-term selling pressure. At the same time, Federal Reserve official Hamak hinted that high inflation may require interest rate hikes, further suppressing risk assets. In such an environment, we need to analyze the technical aspects calmly rather than be led by emotions.
Current Price and Time
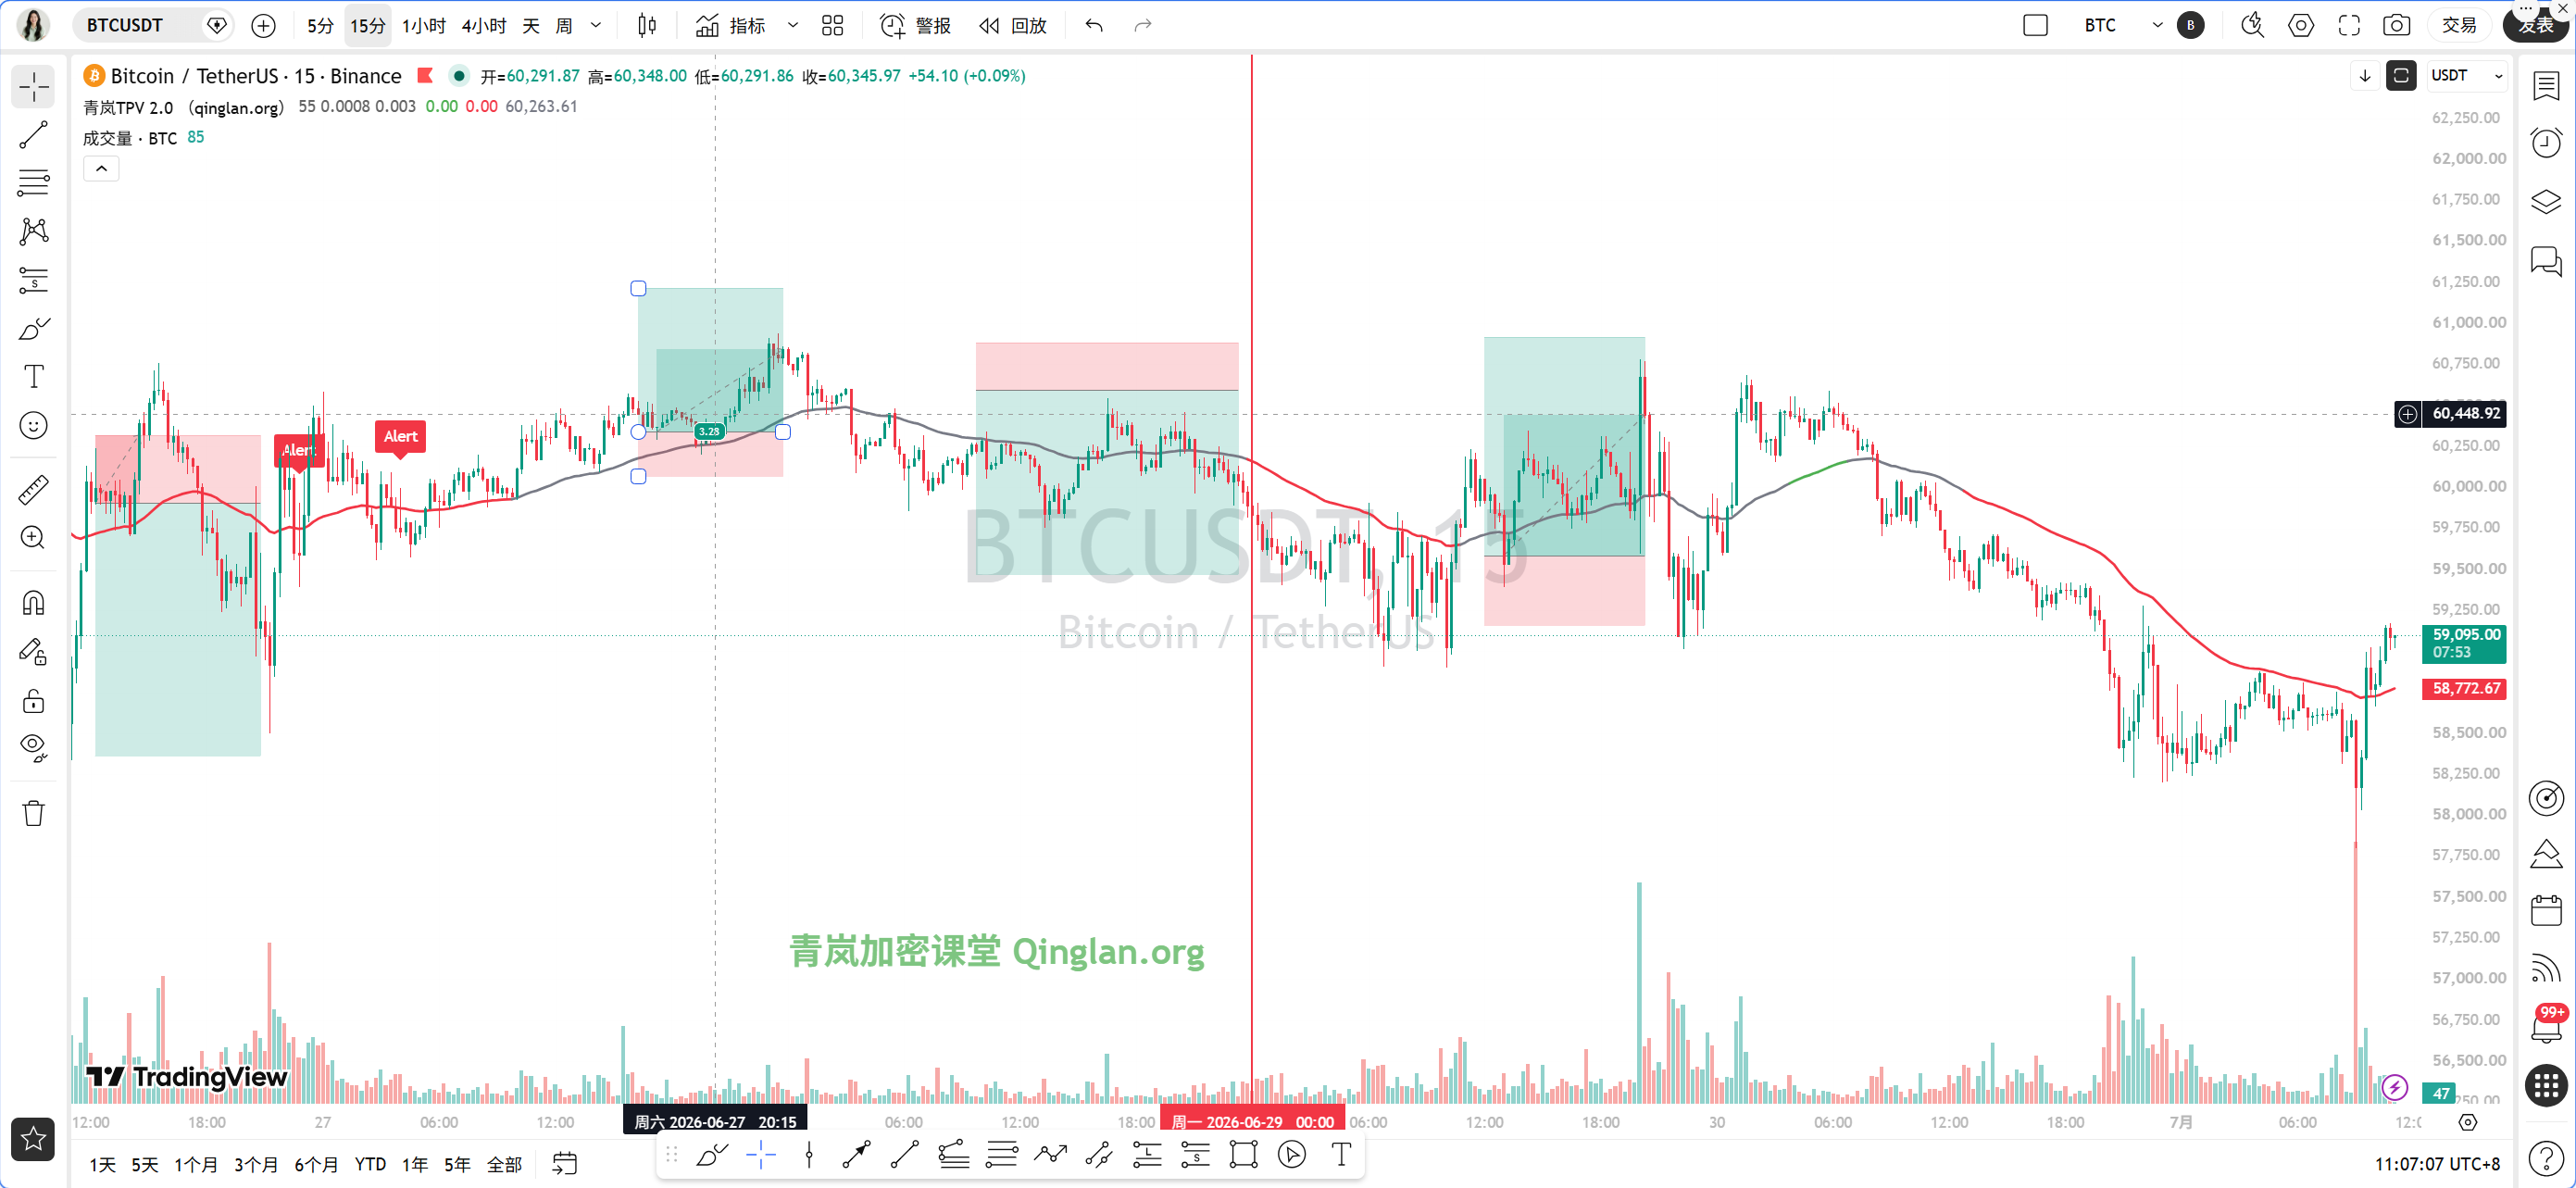
The current time is July 1st, 11:19. The latest quote for BTC is 58,924 USDT. The price is struggling near the $58,000 mark but has not stabilized effectively, and the market is in a critical game stage.
Multi-Period Status Overview
On the daily level, BTC is in a clear bearish trend. MA5 is at 59,482, MA10 is at 60,513, MA30 is at 62,652, and the price is far below all moving averages. The MACD's DIF is -2,369.68, DEA is -2,339.45, and the histogram is -30.24, indicating continuous release of bearish momentum. The RSI is at 27.21, which has entered the oversold zone, but oversold does not mean an immediate reversal; it only indicates that the downward momentum may weaken.
On the 4-hour level, MA5 is at 58,788, MA10 is at 59,361, MA30 is at 59,857, and the price is operating below MA5. The MACD's DIF is -501.73, DEA is -435.48, and the histogram is -66.25, with bearish momentum still amplifying. The RSI is at 43.64, in a weak range, with no obvious rebound signal.
On the hourly level, MA5 is at 58,796, MA10 is at 58,745, and MA30 is at 59,127, with the price below MA30. The MACD's DIF is -194.96, DEA is -271.07, and the histogram is 76.10. Although the histogram turns positive, both DIF and DEA are still negative, indicating a rebound repair within the bearish trend, not a reversal. The RSI is at 54.93, in a neutral to weak zone. The key indicator EMA55 is at 59,340.76, with the current price of 58,924 below this line, indicating bearish dominance.
On the 15-minute level, MA5 is at 59,019, MA10 is at 58,808, and MA30 is at 58,688, with the price above MA5 and MA10, showing short-term rebound signs. The MACD's DIF is 98.78, DEA is 48.08, and the histogram is 50.70, with bullish momentum dominating in the short term. The RSI is at 56.48, indicating a neutral to strong position. However, due to the large fluctuations on the 15-minute level, it cannot be used as a basis for trend judgment.
TPV Signal Verification
According to the Qinglan TPV system, we use the 1-hour EMA55 as the demarcation line for long and short positions. The current price is 58,924, below EMA55's 59,340.76, indicating a bearish trend area.
Short Selling Condition Verification: First, the price is under pressure below the 1-hour EMA55. In the past 8 hourly candlesticks, the closing price has been greater than EMA55 0/8 times, crossing 0 times, indicating that the price has been continuously running below EMA55, fulfilling the condition. Second, pressure meets resistance. The current price has rebounded near the $58,000 mark, but the rebound height is limited, with no effective breakthrough formed on the 4-hour and 1-hour levels. Third, the rebound is weak. Although the 1-hour MACD histogram has turned positive, both DIF and DEA remain negative, and RSI has fallen from 54.93, indicating insufficient rebound momentum. Overall, the short selling conditions are partially met, but clearer resistance signals are needed.
Assisted data for oscillation judgment shows that in the past 8 hourly candlesticks, the closing price has been greater than EMA55 0/8 times, crossing 0 times, and the current price's absolute distance from EMA55 is 0.70%, which does not meet the oscillation threshold, leading the system to determine a unilateral bearish trend. Therefore, we adopt a bearish approach and do not actively make long trades.
On-chain Funding Situation
On-chain data shows that the Fear and Greed Index is only 11, indicating extreme fear, which is a signal of the market's emotional low point. BTC's 24-hour fluctuation is -1.45%, with a market share of 55.42%, indicating that Bitcoin is relatively resistant to decline, but overall capital outflow is significant. In the spotlight news, DeFi TVL dropped to $6.93 billion, the lowest since February 2024, reflecting capital outflow and insufficient confidence in the market. A16z sold $10.19 million HYPE tokens, and Riot Platforms deposited 500 BTC suspected to be for sale, actions from these institutions have intensified supply pressure. The expectation of the Federal Reserve raising interest rates is heating up, further suppressing risk assets. Overall, the funding situation is bearish, lacking support.
Key Attack and Defense Levels
Key resistance levels above: The first resistance level is near the 1-hour EMA55 at 59,340, marking the demarcation line for the bearish trend. The second resistance level is near the 4-hour MA10 at 59,361, close to EMA55, forming a resonance pressure. The third resistance level is at the psychological round number of 60,000, representing double pressure from psychology and moving averages.
Key support levels below: The first support level is at the $58,000 mark, which is a recent low and also the position mentioned in the news as falling below. The second support level is near 57,000, which is the lower edge of the previous oscillation range. If $58,000 is lost, it may accelerate the decline to $57,000 or even lower.
Trading Ideas
The current market is in a bearish trend, but there is short-term demand for rebound repair. The Qinglan TPV system suggests adopting a bearish approach, waiting for resistance signals during a rebound to enter.
Direction: Focus on short selling, not recommended to go long.
Entry Conditions: Wait for the price to rebound to the $59,300-$59,400 range, near the 1-hour EMA55, observing for resistance signals to appear. Specific conditions: The closing price of the hourly candlestick must be below EMA55, and a long upper shadow or peak formation must appear, while the MACD histogram begins to shorten, and the RSI retreats from a high position. If these conditions are satisfied, short selling can be initiated.
Stop Loss Level: Set above 59,600, indicating that if it breaks above EMA55 and stabilizes, it shows that the bearish trend may be broken, and stop loss should be triggered.
Target Levels: First target 58,000, second target 57,000. If 58,000 is broken, the stop loss can be moved to break even, continuing to hold to see 57,000.
If the price directly breaks below 58,000, do not chase the short; wait for a rebound confirmation before entering. If the price rebounds and breaks above EMA55 and stabilizes, the bearish approach will be paused, switching to a wait-and-see stance.
Risk Warning
The current market is in extreme fear, and volatility may intensify, so it is essential to control position sizes, set strict stop losses, and not hold losing positions.
Follow Qinglan Cryptocurrency Classroom to grasp more trading opportunities! Visit our official website www.qinglan.org
📊 Qinglan TPV Trading Strategy Backtest Reference
🕒 Last Backtest Time 07-01 07:00:02
Total Analysis: 2630 Backtest: 2057 Accuracy Rate: 73.5% (1512/2057)
免责声明:本文章仅代表作者个人观点,不代表本平台的立场和观点。本文章仅供信息分享,不构成对任何人的任何投资建议。用户与作者之间的任何争议,与本平台无关。如网页中刊载的文章或图片涉及侵权,请提供相关的权利证明和身份证明发送邮件到support@aicoin.com,本平台相关工作人员将会进行核查。