Crypto Circle Academician: 7.3 Ethereum (ETH) daily golden cross hides dangers, is the Fibonacci pressure level the line of life and death? Latest market analysis for reference
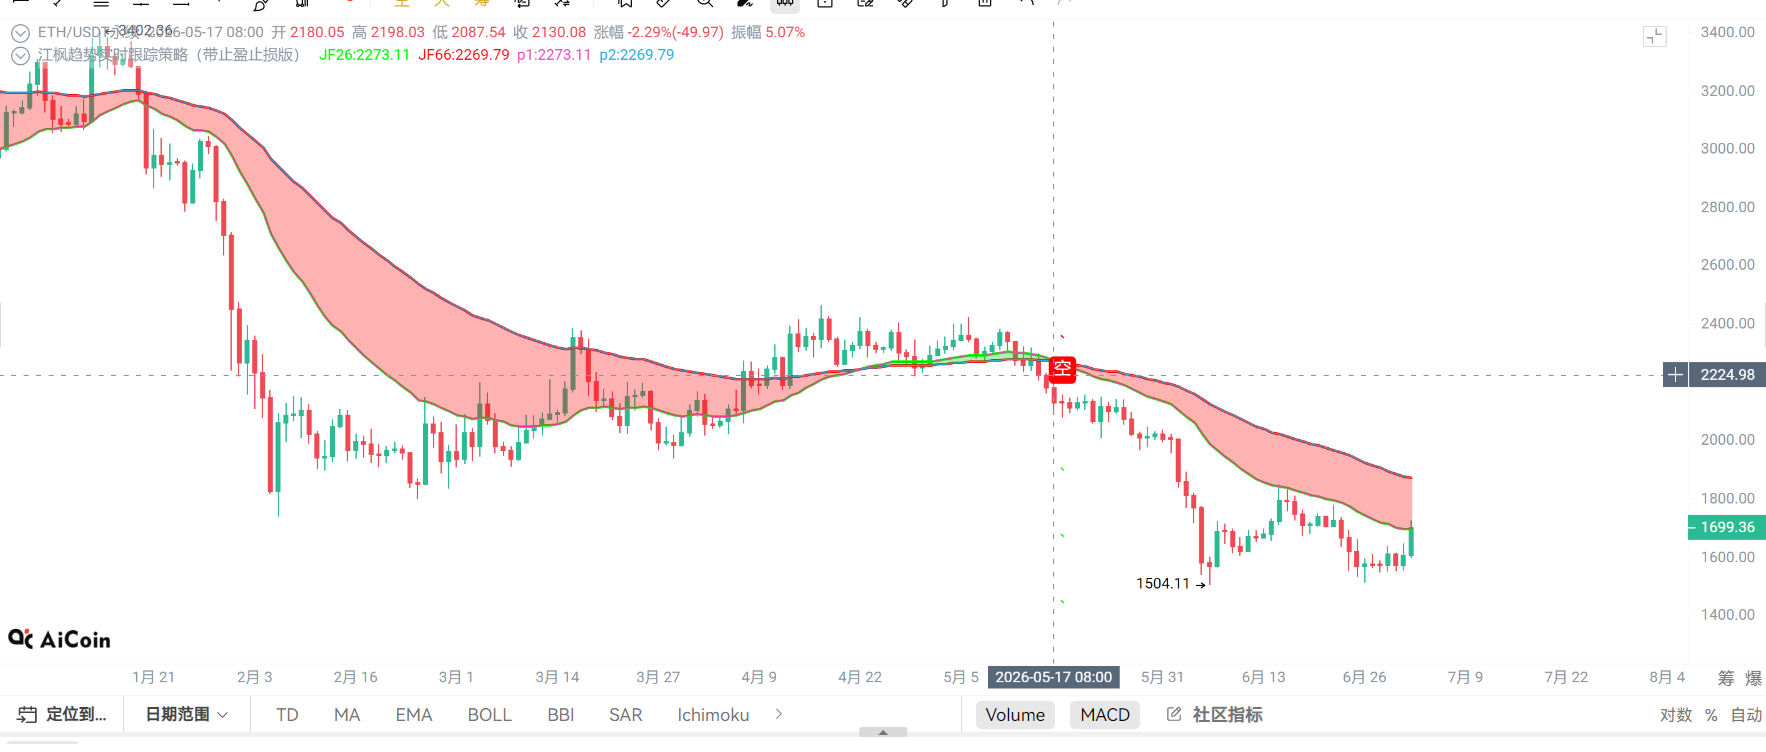
Ethereum current price 1700, have you caught up with this rebound? From the low of 1503 all the way up to above 1700, this wave of oversold rebound strength directly exceeded expectations! Many people are still hesitating whether to buy the dip, but the market has already completed its move. These two hundred points are enough for a wave, and those who have not entered the market can only choose to go south. If you want to go north, you can only enter at a lower level after a pullback.
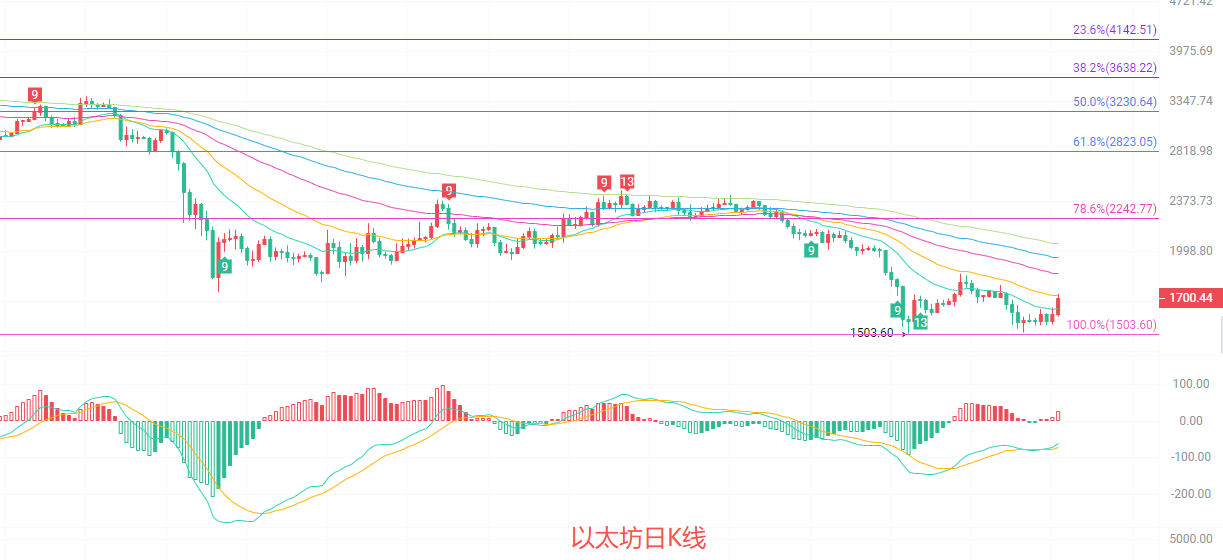
The daily candlestick directly stands above the EMA15 at 1643 and the Bollinger middle track. The current price is still below the EMA30, 60, and 90, and the mid-term southward trend has not yet reversed. The MACD indicator's red bars continue to expand, with DIF crossing DEA to form a golden cross. The short-term upward momentum is strong, but the upper 2242's 78.6% Fibonacci retracement line is a strong resistance level. If it cannot break through, it is likely to enter a range-bound pullback.
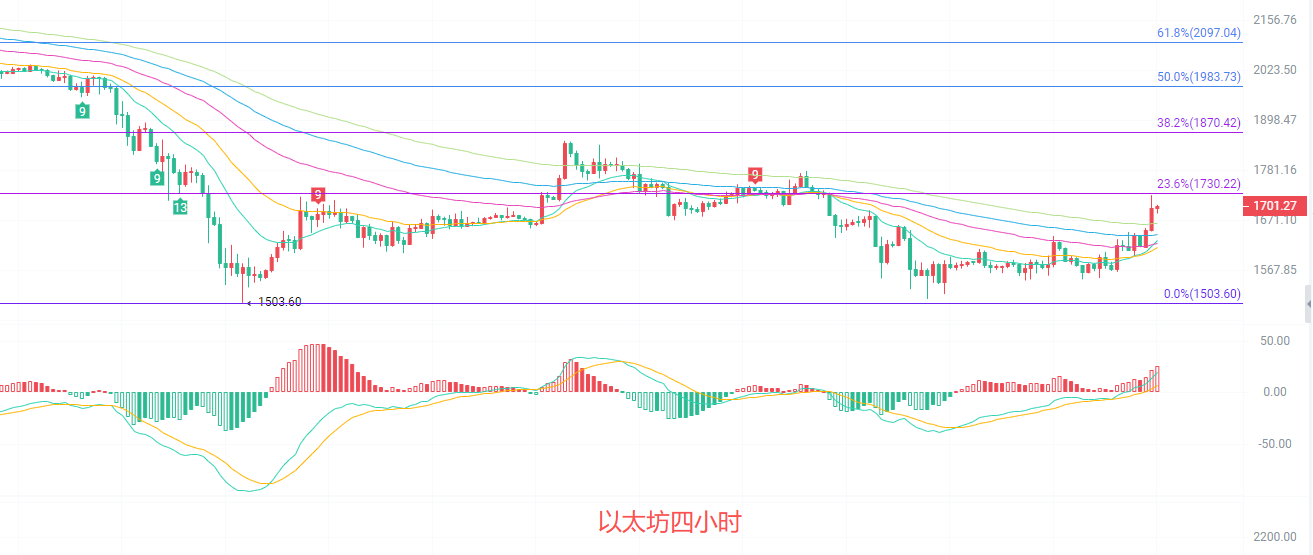
The four-hour candlestick has formed a standard V-shaped reversal, rebounding from the low of 1510 to near 1700. Currently, the price stands above the Bollinger upper track at 1681, and the short-term upward trend is evident. EMA15, 30, and 60 are all turning upward, forming an upward arrangement. The MACD red bars continue to expand, with momentum not fading. However, the upper 1730's 23.6% Fibonacci retracement line is a strong short-term resistance. The Bollinger bands are widening, indicating increased market volatility, so be alert to the risk of a pullback after a peak.
Short-term reference:
If 1670 to 1630 does not break, go north, stop loss 1600, target see 1710 to 1750.
If 1730 to 1760 does not break, go south, stop loss 1790, target see 1680 to 1640.
Specific operations should be based on real-time data from the market. For more information, you can consult the author. There is a delay in article publication, and it is suggested for reference only; risk is borne by yourself.

Kind reminder: The above content is exclusively created by the author of the public account. Advertisements at the end of the article and in the comment section are unrelated to the author. Please be cautious in distinguishing, thank you for reading.
免责声明:本文章仅代表作者个人观点,不代表本平台的立场和观点。本文章仅供信息分享,不构成对任何人的任何投资建议。用户与作者之间的任何争议,与本平台无关。如网页中刊载的文章或图片涉及侵权,请提供相关的权利证明和身份证明发送邮件到support@aicoin.com,本平台相关工作人员将会进行核查。