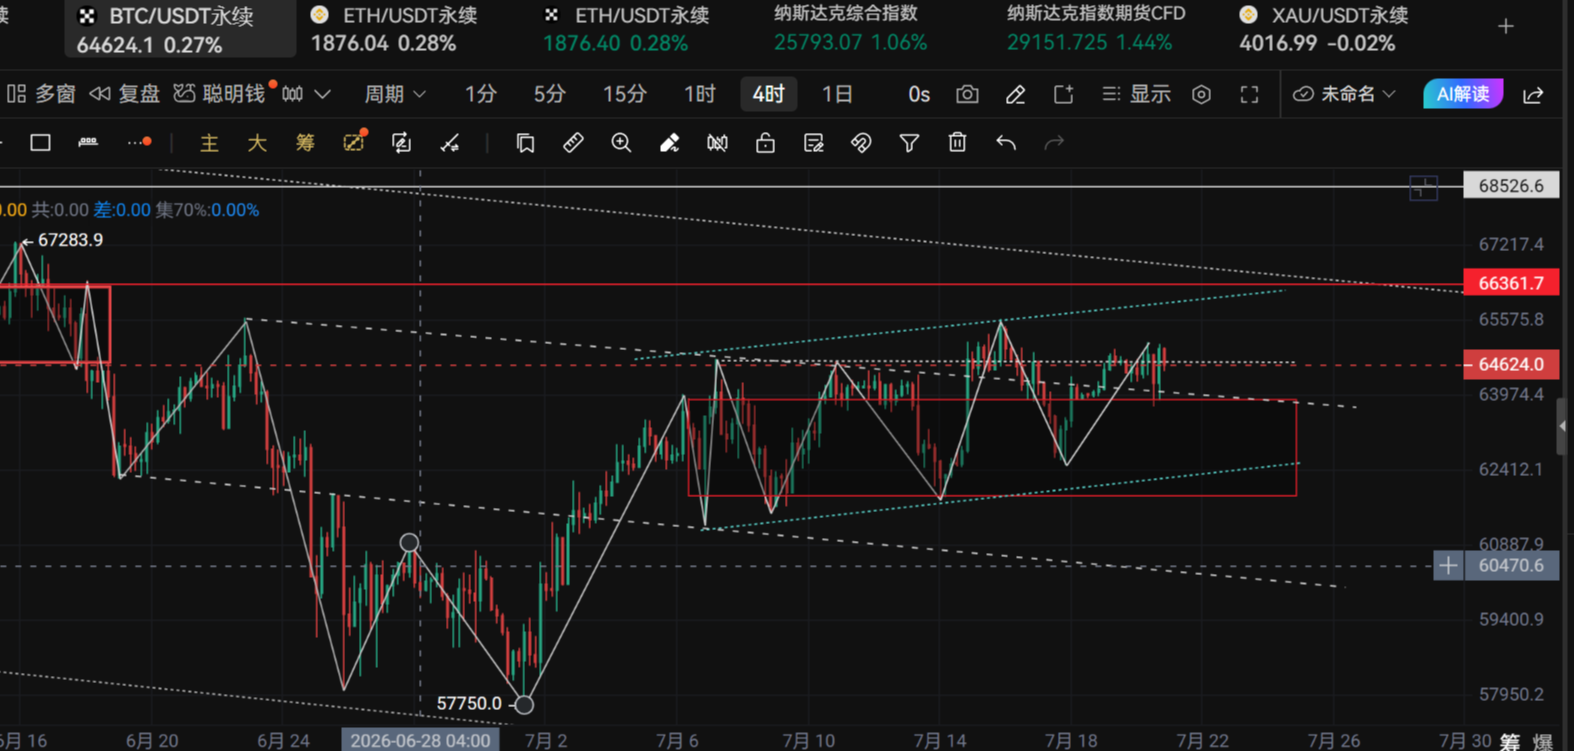
Cryptocurrency Circle Academician: On July 20th, Ethereum (ETH) moving averages are densely tangled, releasing significant signals. Is a new round of Ethereum market about to land? Latest market analysis reference
The current price of Ethereum is 1858. Recently, the Ethereum market resembles summer weather; one moment it shines brightly to 1946, and the next moment it splashes cold water with a pullback, stuck at 1858 with no upward or downward movement. Many people ask me whether to increase their positions or cut losses, and the answer is quite simple: if you can hold and have set stop-losses, then hold on; if you cannot hold and have not set risk control, it is better to take profits. The EMA is merging, and the MACD momentum is shrinking; simply put, the market is waiting for the wind to come, and we are also waiting for the wind to come.
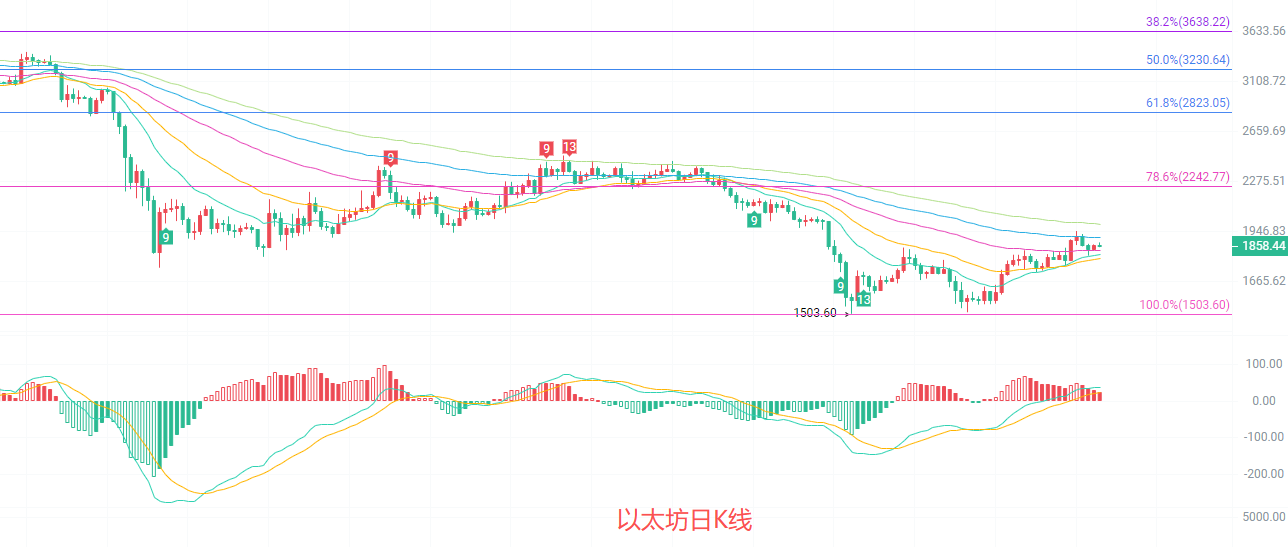
The daily K-line is above the EMA15 and EMA30 short-term moving averages, but is still suppressed by the EMA60. The moving averages are arranged upwards but the slope is slowing down. The MACD red bars continue to shrink, and while the DIF and DEA are still golden crosses, the momentum is clearly fading. The middle track of the Bollinger Bands around 1782 provides effective support, while the upper track at 1949 is strong short-term resistance. Overall, it is in a phase of oscillation and consolidation after the rebound, with signs of weakening upward momentum.
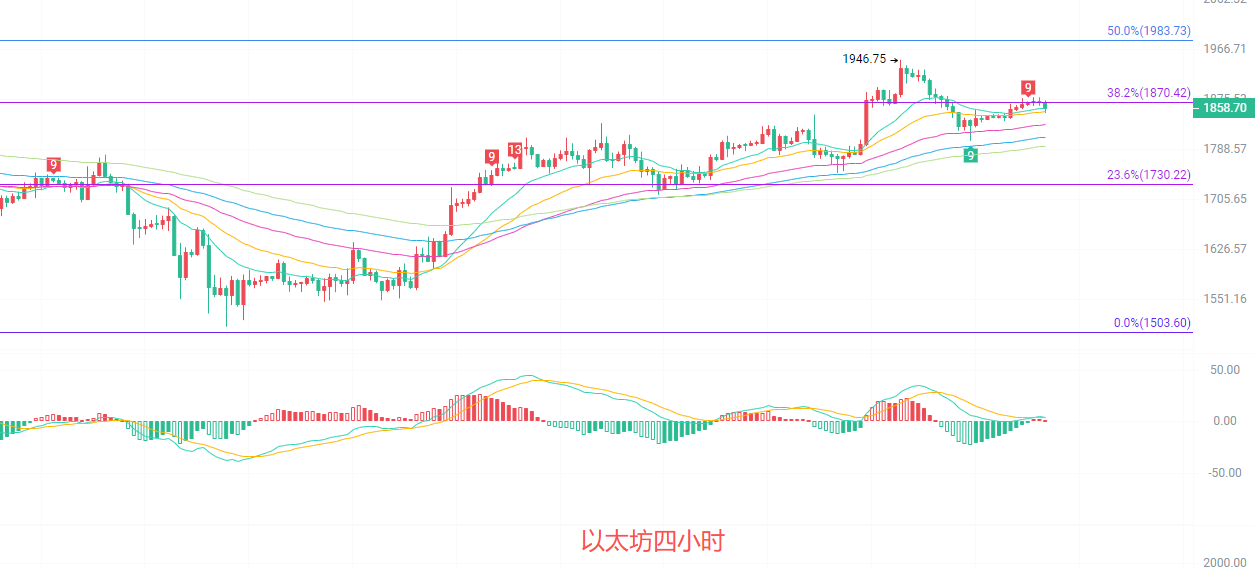
The four-hour K-line is near the EMA15, merging with the EMA30. The short-term moving averages are repeatedly crossing, showing obvious oscillation characteristics. The price is under pressure below the Fibonacci 38.2% level. The middle track of the Bollinger Bands at 1854 provides weak support, while the upper track at 1884 and lower track at 1824 form a narrow channel. The MACD's DIF and DEA are almost merging, with red bars continuously shrinking, and momentum approaching zero, indicating intense North-South competition in the short term, with the direction yet to be clarified, on the eve of choosing a direction.
Short-term reference:
For the downside, as long as it does not break below 1820 to 1790, it can go upwards; stop-loss at 1760, target looking at 1880 to 1920.
For the upside, as long as it does not break above 1920 to 1960, it can go downwards; stop-loss at 1990, target looking at 1880 to 1830.
Specific operations should mainly rely on real-time market data. For more information details, you can consult the author. There may be delays in article publication; the advice is for reference only, and the risk is to be borne by oneself.

Warm reminder: The above content is only created by the author's public account. The advertisements at the end of the article and in the comment area are unrelated to the author. Please discern carefully, and thank you for reading.
免责声明:本文章仅代表作者个人观点,不代表本平台的立场和观点。本文章仅供信息分享,不构成对任何人的任何投资建议。用户与作者之间的任何争议,与本平台无关。如网页中刊载的文章或图片涉及侵权,请提供相关的权利证明和身份证明发送邮件到support@aicoin.com,本平台相关工作人员将会进行核查。