Author: Wall Street Watch
Michael Hartnett, Chief Investment Strategist at Bank of America, raises the warning flag again. After successfully predicting the market bottom in March this year, he points out that the current extremely crowded positions and bubble-like sentiment have pushed the market into a new high-risk zone, with the summer being the best time to withdraw from risk assets.
The latest fund manager survey from Bank of America shows that the bank's proprietary "Bull-Bear Indicator" has risen to an extreme level of 9.6, setting a new historical high. Hartnett warns that the optimal summer strategy is "to retreat from risk assets and shift to duration, defensive assets, high dividend stocks, and the dollar," rather than adding positions on dips. Meanwhile, he lists the Mag7 ETF (ticker MAGS) as a key indicator to watch: if MAGS falls below $65, it will drag down all cyclical sectors; if it breaks above $70, it will signal a re-entry.
In Hartnett's view, the biggest tail risk in this round is: once mega-cap tech companies announce cuts to AI capital expenditures, and this does not push Mag7 to a new high, "the resulting significant negative impact on growth and asset prices will trigger massive short-selling in banks, brokers, and industrial stocks"—leading to a widespread market collapse.
Extreme positioning triggers warning signal
Hartnett pointed out in the latest "Flow Show" report that the Bank of America's Bull-Bear Indicator has reached a historical extreme of 9.6, indicating that the market is in an "extreme position" state. According to his framework, this signal historically corresponds to an optimal strategy of avoiding risk rather than adding positions.
This week's latest EPFR fund flow data confirms this judgment: equity assets experienced a net inflow of $55.8 billion, bonds saw an inflow of $20 billion, while money market funds recorded a massive net outflow of $119.6 billion, the largest single-week outflow since April 2026. Among them, the tech sector saw a cumulative inflow of $48.8 billion over three weeks, setting a record; emerging market equities had a single-week inflow of $25 billion, the highest since April 2025.
Hartnett admits that the fund manager survey itself has almost no direct signal significance for predicting market direction, but its value lies in revealing the degree of concentration of current consensus, thus providing a reference for reverse trades.
Four "No" assumptions support optimistic sentiment, but risks are accumulating
The July survey shows that current investor optimism is based on four core assumptions: the economy does not experience a hard landing, the Federal Reserve does not raise interest rates, AI capital expenditures are not cut, and the Democrats do not sweep the midterm elections.
Hartnett refers to this combination as "no landing, no hike, no cut, no sweep," and points out that this is precisely why there are almost no bears in the market. Expectations for macroeconomic prosperity have now risen to the highest levels since February 2022, with the bank stocks in the United States, Japan, the UK, and Europe reaching multi-year or multi-decade highs, becoming the most intuitive manifestation of "prosperity trading."
However, Hartnett believes that because everyone is betting on prosperity, the logic of reverse trading has already been established: going long duration government bonds, defensive assets, and high dividend stocks while shorting industrial stocks and bank stocks.
Three major reverse trading signals disassembled one by one
Signal one: 54% expect "no landing," reverse buying long bonds and defensive stocks.
When the mainstream market bets on a soft landing or even no landing for the economy, Hartnett believes that allocating long-duration government bonds and defensive sectors has a better cost-effectiveness. 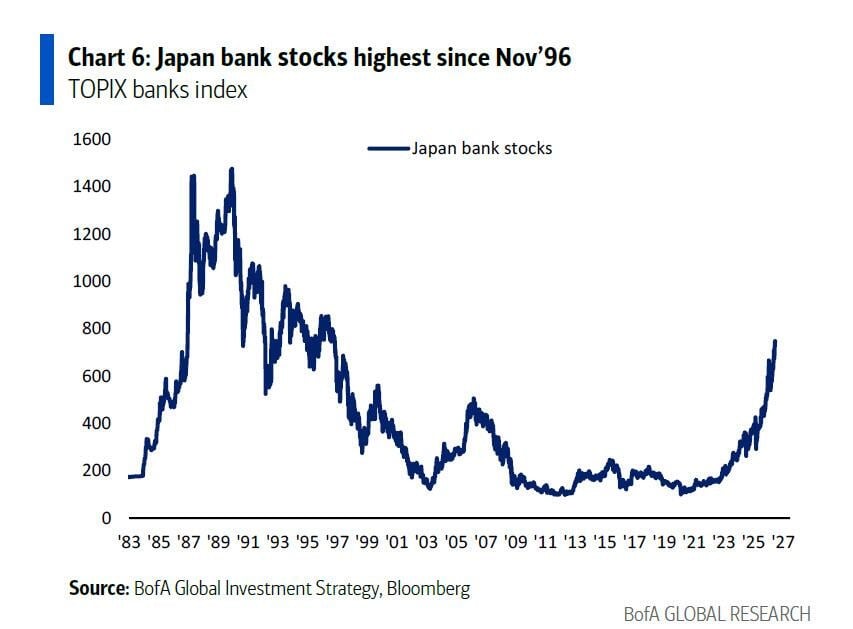
Signal two: 83% expect the Federal Reserve to not raise interest rates, reverse going long on the dollar.
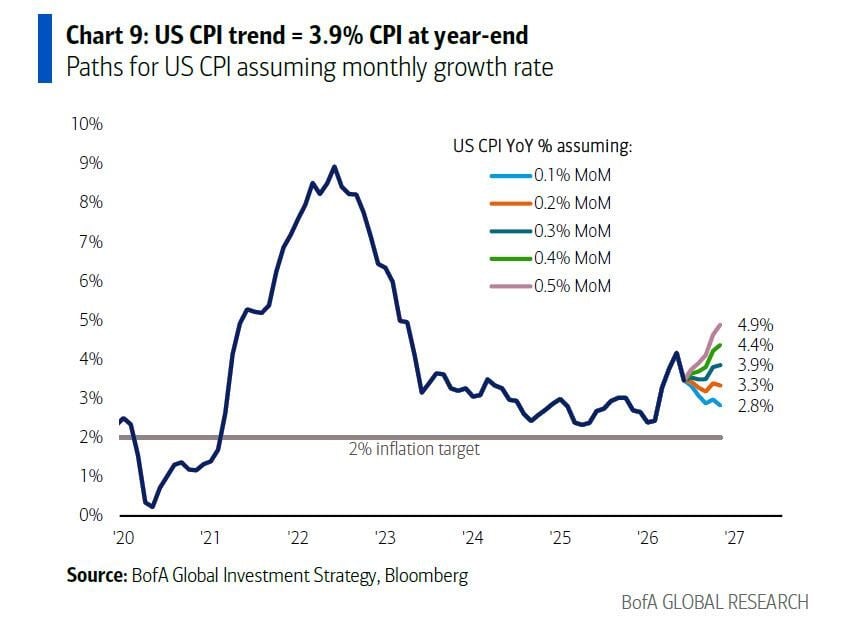
The survey shows that 83% of the interviewed fund managers believe that the Federal Reserve will not raise interest rates before the midterm elections in November, but Hartnett points out that the US CPI is projected to rise to 3.9% by the end of 2026 (3-month moving average is 0.3%). Meanwhile, the Strait of Hormuz has been blocked again, and US crude oil inventories are at a 45-year low (only 43 days of supply), while fund managers' year-end oil price expectations have sharply dropped from $86 per barrel to $71 per barrel. He believes that if the Federal Reserve unexpectedly raises interest rates, the best response is still to go long on the dollar.
Signal three: 61% expect AI capital expenditures to not be cut, reverse shorting chip stocks.
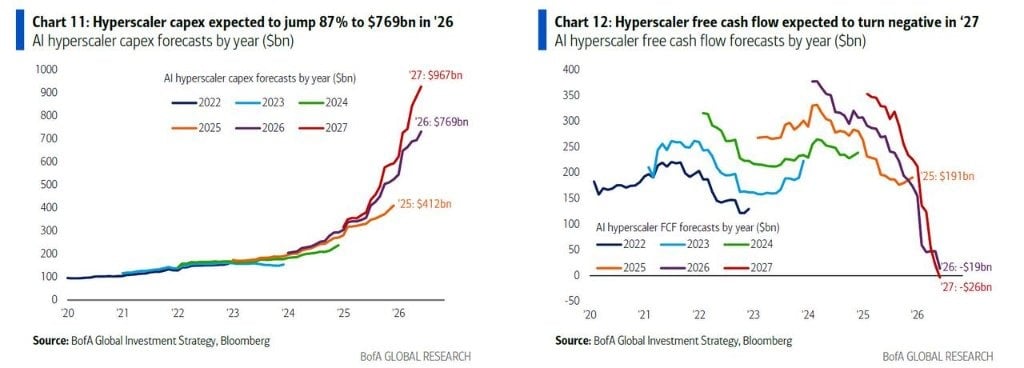
This is currently the most crowded consensus trade. AI capital expenditures are still growing rapidly, and 61% of respondents believe that mega cloud computing companies will not announce cuts to capital expenditures before the end of 2026. However, Hartnett points out that the free cash flow of mega-companies has started to turn negative, and financing pressures in the bond market continue to rise—Oracle's credit default swap spreads have risen from 59 basis points in September to 87 basis points, nearing previous highs. The recent relative performance of the "long MAGS, short SOX" strategy suggests that cuts to capital expenditures may be approaching.
Semiconductors: Crowded positions, technical pressure
The technical condition of the semiconductor sector has clearly deteriorated. The Philadelphia Semiconductor Index (SOX) is currently 33% above the 200-day moving average, down from 76% on June 3, which was the second-highest overbought level after the tech bubble peak in March 2000. SOX has fallen 20% from its peak, while the triple-leveraged semiconductor ETF (SOXL) has declined 55% from its peak.
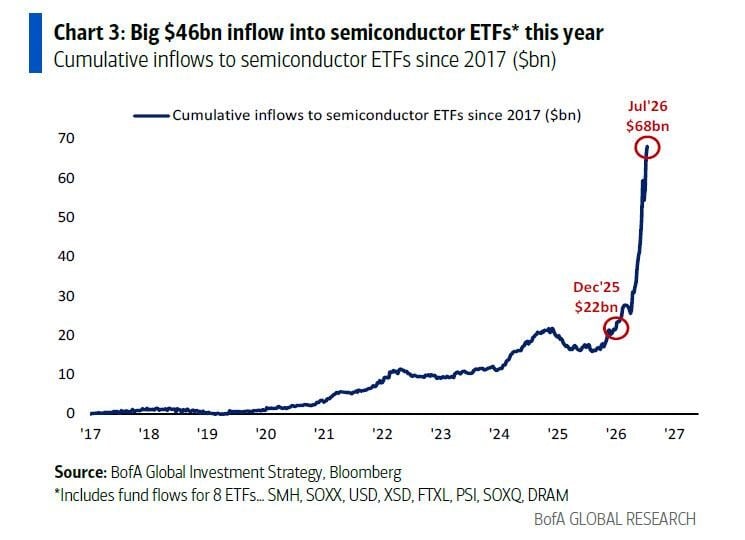
Despite the significant price decline, there has been almost no reduction in positions. According to Hartnett's statistics, this week, the eight major semiconductor ETFs recorded a net inflow of $2.3 billion, with a cumulative inflow of $46 billion since the beginning of the year, accounting for 31% of assets under management. Over the past three weeks, the tech sector had a cumulative inflow of $48.8 billion, which Hartnett describes as "institution-driven, reckless momentum chasing."
Capital flows: Historic cash outflow, obvious signs of overheating sentiment
The latest EPFR capital flow data further confirms the extremely optimistic market sentiment. This week, equities experienced a net inflow of $55.8 billion, bonds saw an inflow of $20 billion, gold had a mere inflow of $500 million, cryptocurrencies experienced a slight outflow of $100 million, while cash recorded a historic outflow of $119.6 billion—the largest single-week cash withdrawal since April 2026.
Specifically, investment-grade bonds recorded a net inflow for the 15th consecutive week, with a single-week inflow of $9.5 billion; emerging market equities saw an inflow of $25 billion, the largest since April 2025; the tech sector had a single-week inflow of $15.6 billion, setting a three-week cumulative inflow record; the financial sector saw an inflow of $2.7 billion, the largest since January 2026.
For Hartnett, cash pouring into stocks and the tech sector at such a scale is precisely the background for the Bull & Bear indicator hitting extreme values, and it is also his core reason for advising investors to remain cautious in the summer, prioritizing withdrawal rather than adding positions.
免责声明:本文章仅代表作者个人观点,不代表本平台的立场和观点。本文章仅供信息分享,不构成对任何人的任何投资建议。用户与作者之间的任何争议,与本平台无关。如网页中刊载的文章或图片涉及侵权,请提供相关的权利证明和身份证明发送邮件到support@aicoin.com,本平台相关工作人员将会进行核查。


