Crypto Circle Academician: On August 19, Bitcoin (BTC) has been stuck in a range, consuming the market's patience; true trends often emerge from enduring hardships! Latest market analysis
Bitcoin's current price is 64850. Many friends are caught in a dilemma; chasing highs fears being buried, while bottom fishing worries about further declines. Holding trades through ups and downs is the norm. Watching the market move sideways, many people frequently trade back and forth, resulting in losses on both sides, unable to earn money and repeatedly suffering losses. The market never moves according to the majority's thoughts, and in a fluctuating market, emotional trading is the biggest fear. Don't blindly go bullish at small rebounds, nor panic sell at slight pullbacks.
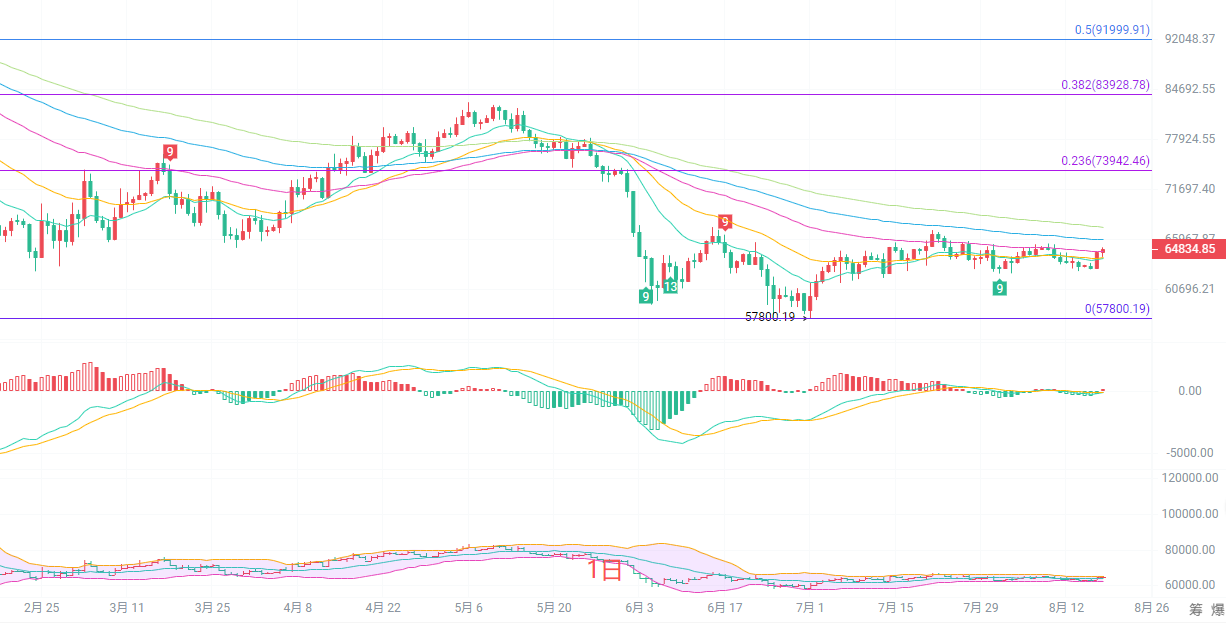
The daily candlestick is operating near the EMA15 and EMA30 moving averages, with short-term moving averages tangled and flattening. The mid to long-term EMA60 and EMA90 still maintain a downward trend, while the larger timeframe is still in a repair stage. The Bollinger Bands continue to tighten, with the upper and lower bands narrowing, indicating that the daily level is about to choose a direction. The daily MACD indicator DIF and DEA are gradually flattening below the zero axis, the red bars increasing slightly; the bullish momentum has not fully opened. The key support below is near 62400 at the lower Bollinger Band, and the upper pressure is at 65400 at the upper Bollinger Band. The daily candlestick still belongs to the consolidation phase after a large drop; do not treat it as a one-sided bull market before an effective breakout occurs, and mainly approach it with a range-bound trading mindset.
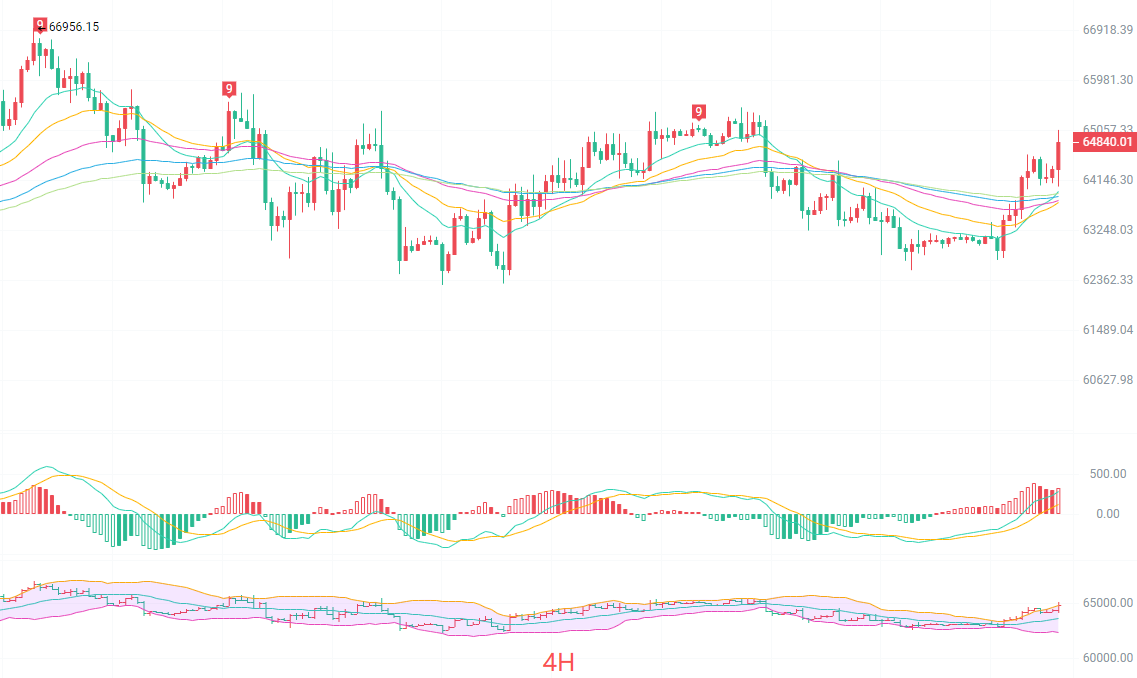
The four-hour candlestick has stabilized above several short-term EMA moving averages, with short-term moving averages forming a bullish arrangement, and short-term rebound momentum is showing. The Bollinger Bands are opening slightly upwards, and the price is running close to the upper band, showing signs of slight pressure. The four-hour MACD indicator DIF crosses above DEA, with red bars continuing to expand, showing short-term bullish dominance; however, it has already reached a relatively high position, indicating a need for a pullback. Strong pressure above is at the previous high area of 65700-66000, and if it cannot break through, it is likely to drop again. The support is at the four-hour middle line of 63600; if the pullback does not break this level, the short-term rebound structure remains intact. If this level is broken, the current short-term rebound will be declared over, and the market will return to a downward fluctuation.
Short-term trading ideas for reference:
Going long around 63900 to 63500, stop loss at 500 points, target at 65400 to 66000.
Going short around 65700 to 66000, stop loss at 500 points, target at 64200 to 63700.
Specific operations should be based on real-time market data. For more details, you can consult the author; the article's release has a delay, so it is suggested for reference only and at your own risk.

Kind reminder: The above content is solely created by the author's official account. The advertisements at the end of the article and in the comments section are unrelated to the author. Please be cautious in discerning, and thank you for reading.
免责声明:本文章仅代表作者个人观点,不代表本平台的立场和观点。本文章仅供信息分享,不构成对任何人的任何投资建议。用户与作者之间的任何争议,与本平台无关。如网页中刊载的文章或图片涉及侵权,请提供相关的权利证明和身份证明发送邮件到support@aicoin.com,本平台相关工作人员将会进行核查。