Master Discusses Hot Topics:
This morning I looked at yesterday's Ethereum spot ETF, which saw total holdings jump to 6 million coins, with BlackRock's clients alone accounting for 3.27 million coins. Although their tactics on Bitcoin have slowed down, they are in a frenzy mode with Ethereum, having bought over 70,000 coins in the last trading day.
The net buying of Ethereum by Americans is eight times that of Bitcoin. Even retail investors are now aware that funds are shifting towards Ethereum. The desire to trade is explosive, with BlackRock, Fidelity, and Grayscale all seeing net inflows; Ethereum has become the darling of the funds.
Additionally, there are still expectations for interest rate cuts. The market is buying into this narrative; it would be unacceptable not to cut rates in September. Old Powell is now like a duck being roasted over a fire; if he cuts, he will be criticized for being pressured by Trump, and if he doesn't cut, the market will unleash a barrage of criticism.
Returning to the market, Bitcoin has surged to a new high, confirming that the 117K support level is solid and completely aligns with my previous expectations. The first rebound target of the deviation channel from the overheated zone is 125K, and it just needs to break through. As long as it holds above that level, the probability of pushing even higher increases.
By the way, last night Bitcoin formed a golden cross on the 4-hour chart and started to gain momentum in the latter half of the night. The previous small pullback was just a false dip, with both the lows and highs climbing higher. A defensive strategy of buying on a slight pullback is completely valid.
This round of market activity is still led by spot trading, not the previous speculative contract-driven hype. Wall Street institutions and major players are working together to lift the market, and spot funds are slowly accumulating, indicating that the market will become increasingly stable.
There is a good chance for 130K to 140K; Bitcoin has not seen a significant pullback because institutions are firmly supporting the bottom, and the chip structure has already changed. In the future, when it reaches a certain scale, how institutions will sell, who will buy, and how much they can buy will be considerations for later. Right now, institutions are in a brainless accumulation phase, and when they stop buying, that will signal an exit, so I believe we are just getting started.
As for Ethereum, I mentioned the monthly trend in my analysis last month. The golden cross on the monthly chart compared to the previous 2440 trend has not changed my prediction for this wave of upward movement. Therefore, short sellers need to be cautious; don’t stubbornly hold on, as we are all insignificant in the face of the trend.
Once Ethereum hits 4900, it will be a historical high, and there will be no reference points afterward; no one can confidently predict how high it will go. Currently, there isn’t even a decent pullback signal on the chart. Those who were overly optimistic about shorting last week probably didn’t even think about where to set their stop-loss, relying solely on their gut feelings.
For short sellers, the most crucial thing is if there is a direct 50 basis point rate cut around the 18th of next month, followed by a real rally in October to November; that would be problematic.
However, for short-term trading, I still won’t blindly FOMO; I will only take what is visible in front of me. Just because you think something is impossible doesn’t mean it is; if the market really goes crazy, it won’t care about your short positions…
Master Looks at Trends:
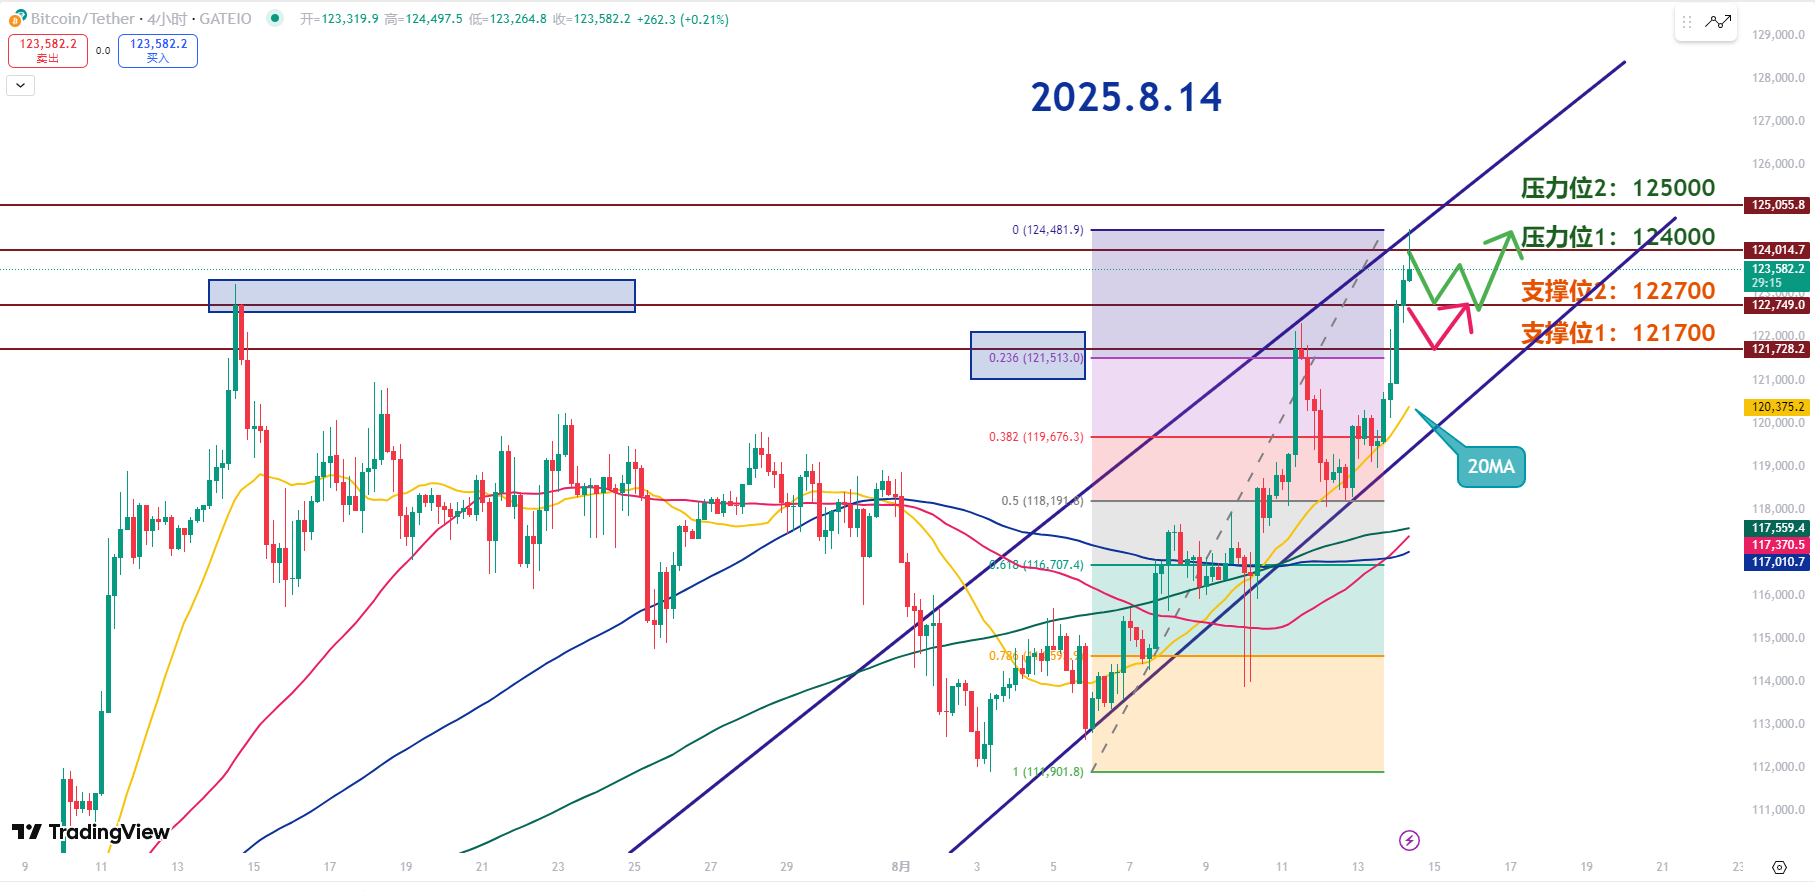
Resistance Levels Reference:
Second Resistance Level: 125000
First Resistance Level: 124000
Support Levels Reference:
Second Support Level: 122700
First Support Level: 121700
Once Bitcoin reaches a new high, some will take profits, leading to short-term selling pressure, and the K-line will show a long upper shadow. We can consider the 122.7 to 123K range as a short-term support area; this is crucial. If it holds, it can serve as a springboard for further upward movement. How to adjust is important; aggressive traders can go long near 122.7K, while more cautious traders can wait until 121.7K to enter.
According to Fibonacci retracement, the 0.236 level is around 121.7K, which is a good area for low entries. Also, pay attention to the 20-day moving average; following the short-term rhythm, a pullback will present a buying opportunity.
The first resistance at 124K is also a psychological pressure point. If it breaks through and holds, the short-term momentum will accelerate, but this is also the most likely place for a correction. If it can stabilize, the probability of another breakout increases significantly.
The second resistance at 125K is a strong resistance level, and it can only be considered if 124K holds. A new high is not to be feared, but the lack of support below is concerning; if the support area is solid, 125K won’t be a problem.
The first support at 122.7K is also a short-term defensive level; if it holds and gives a lower shadow, it’s an opportunity to enter long positions.
The second support at 121.7K is the previous high from August 11 and is the last line of defense for bulls. If it breaks, there could be a sharp short-term drop, but such drops often present opportunities to accumulate.
Today's trading strategy is straightforward; after a new high, it’s normal for selling pressure to emerge, and I will look for rebound opportunities during pullbacks. The trend is so strong that going against it to short is purely self-destructive. Even if you want to enter, you must wait for a proper pullback; going long at lower levels is the correct approach.
8.14 Master’s Swing Trading Setup:
Long Entry Reference: Accumulate in the 121700-122700 range, Target: 124000-125000
Short Entry Reference: Not currently considered
If you genuinely want to learn from a blogger, you need to keep following them, rather than making hasty conclusions after just a few market observations. This market is filled with performative players; today they screenshot their long positions, and tomorrow they summarize their shorts, appearing to "catch tops and bottoms" every time, but in reality, it’s all hindsight. A truly worthy blogger will have a trading logic that is consistent, coherent, and withstands scrutiny, rather than jumping in only when the market moves. Don’t be blinded by flashy data and out-of-context screenshots; long-term observation and deep understanding are necessary to discern who is a thinker and who is a dreamer!
This content is exclusively planned and published by Master Chen (WeChat: CoinMasterChen). For more real-time investment strategies, solutions, spot trading, short, medium, and long-term contract trading techniques, and knowledge about K-lines, you can join Master Chen for learning and communication. A free experience group for fans and community live broadcasts are now available!

Friendly Reminder: This article is only written by Master Chen on the official account (as shown above), and any other advertisements at the end of the article or in the comments are unrelated to the author! Please be cautious in discerning authenticity. Thank you for reading.
免责声明:本文章仅代表作者个人观点,不代表本平台的立场和观点。本文章仅供信息分享,不构成对任何人的任何投资建议。用户与作者之间的任何争议,与本平台无关。如网页中刊载的文章或图片涉及侵权,请提供相关的权利证明和身份证明发送邮件到support@aicoin.com,本平台相关工作人员将会进行核查。


