# What is a Pinbar
- Definition and Theoretical Background
A Pinbar (Pin Bar Signal) is a key reversal pattern derived from price action theory, representing significant fluctuations in market sentiment through a single candlestick. The core logic of a Pinbar is based on the market's behavior of "rejecting price levels": within a certain time window, regardless of whether buyers or sellers dominate, the market ultimately rejects extreme directions in an attempt to find a "balanced price." This signal is particularly valuable near trend reversals and key resistance and support levels.
From a quantitative analysis perspective, a Pinbar is a pattern recognition signal that can be precisely quantified. Its calculation logic includes the following components:
Long Shadow: The length of the shadow must be significantly greater than the length of the body (e.g., 2 times or more).
Body Position: The body must be close to one end of the shadow, reflecting the reversal strength in a short time frame.
Price Touching Range: The context in which the Pinbar is formed usually accompanies important price structures, such as moving averages, Fibonacci retracement levels, or previous key highs and lows.
For example, for a "Bullish Pinbar," when the market tests lower price levels (such as a support area) and a long lower shadow appears, it indicates that the sellers' breakout attempt has failed, and the buyers are in control; while a "Bearish Pinbar" appears near resistance levels, indicating that the buyers' upward momentum is being suppressed.
- Core Features
As a typical price action signal, a Pinbar has the following structural characteristics:
Long Shadow Length: The shadow length is generally more than 2 times the length of the body.
Special Body Position: Located at one end of the shadow, representing a concentrated expression of reversal sentiment.
Trading Logic: The shadow represents a strong rejection of price levels in one direction, usually indicating the importance of support or resistance areas.
- Relation to Quantitative Analysis
Combining Pinbars with key market levels (such as moving averages, Fibonacci retracements, support, and resistance levels) can significantly improve the accuracy of trend reversal judgments.
In quantitative models, Pinbars can serve as a parameterized signal, which can be further optimized in conjunction with trend indicators (such as MACD, RSI) or volatility indicators (such as ATR).
- Mathematical Modeling Analysis
Pinbars can also be described using mathematical modeling methods, for example:
Upper shadow length: (high − max(open, close))
Lower shadow length: (min(open, close) − low)
Body length: |open − close|
Signal judgment condition: Assuming shadow length ≥ body length * 2 and the candlestick closing price is close to one end of the shadow, the pattern is established.
# Pinbar Trading Strategy · Pinbar Signal Direction
In the design of this strategy, the Pinbar Signal is the core trigger of the trend reversal logic, and the confirmation of the signal direction is closely integrated with the execution strategy. The strategy logic is precise, efficient, and follows causal relationships, capturing maximized market opportunities with minimal pattern inputs.
The core idea of the Pinbar trading strategy can be seen as "discovering the market's turning point direction through a Pinbar":
If the market pushes up (long upper shadow), it indicates that there is significant resistance above, and the price is likely to move down. At this point, sell your long positions and start shorting.
If the market pushes down (long lower shadow), it indicates that there is strong support below, and the price is very likely to rebound upwards. At this point, close your short positions and start buying long.
It acts like a "market probe," helping us to detect potential directional changes in advance. Importantly, this signal is based on strict conditions, and when combined with trend direction and support/resistance levels, it can greatly enhance accuracy.
# Pinbar Trading Strategy · Pinbar Signal
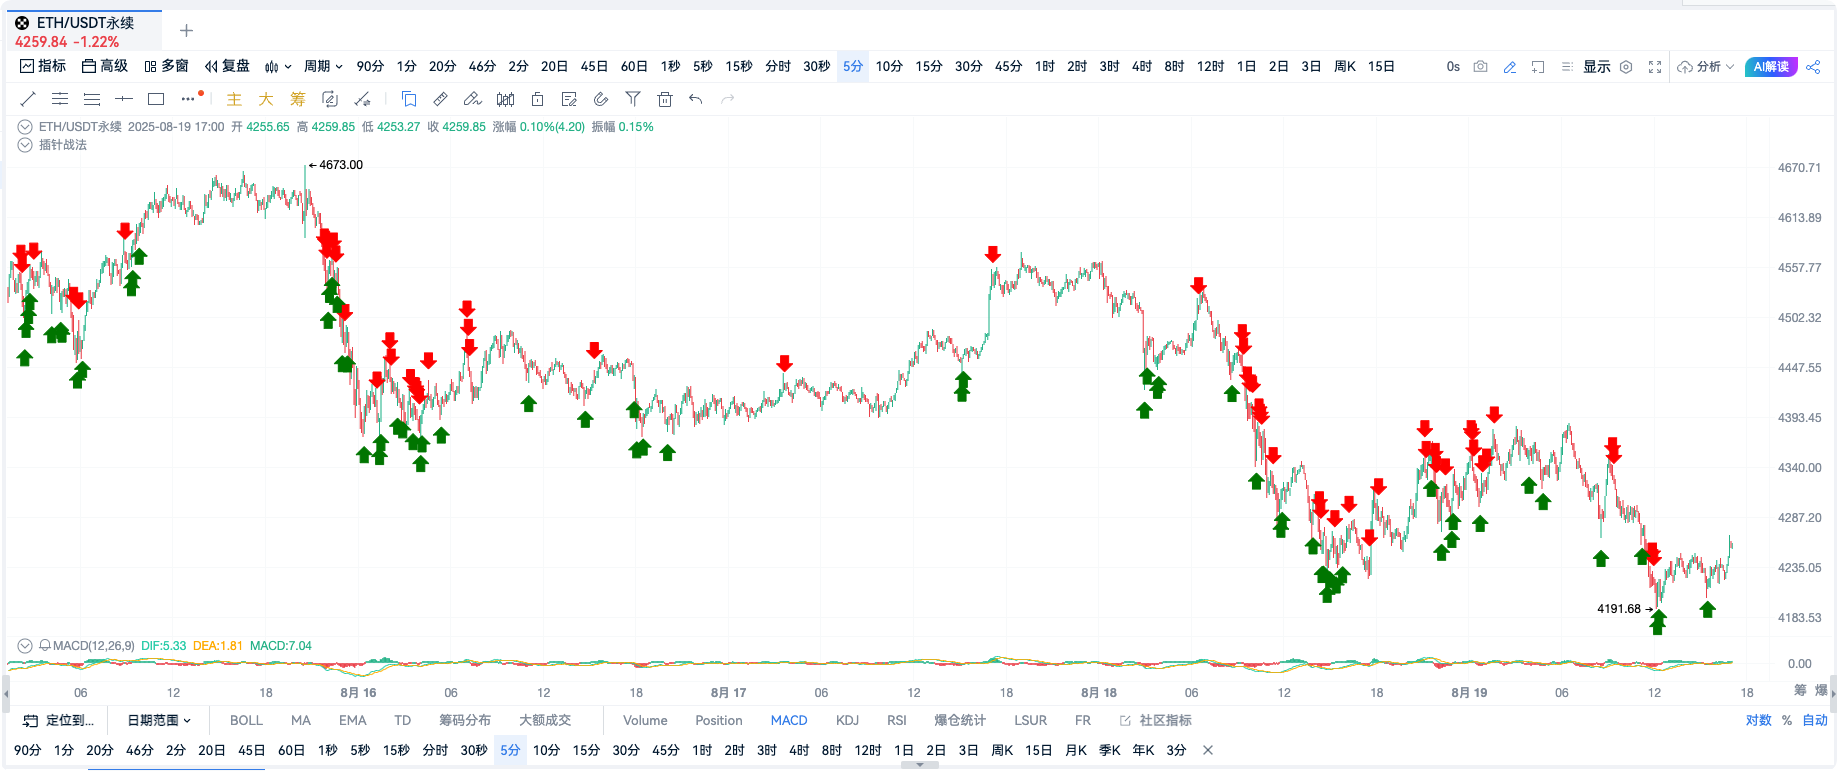
Chart OKX-ETHUSDT perpetual contract 5-minute period
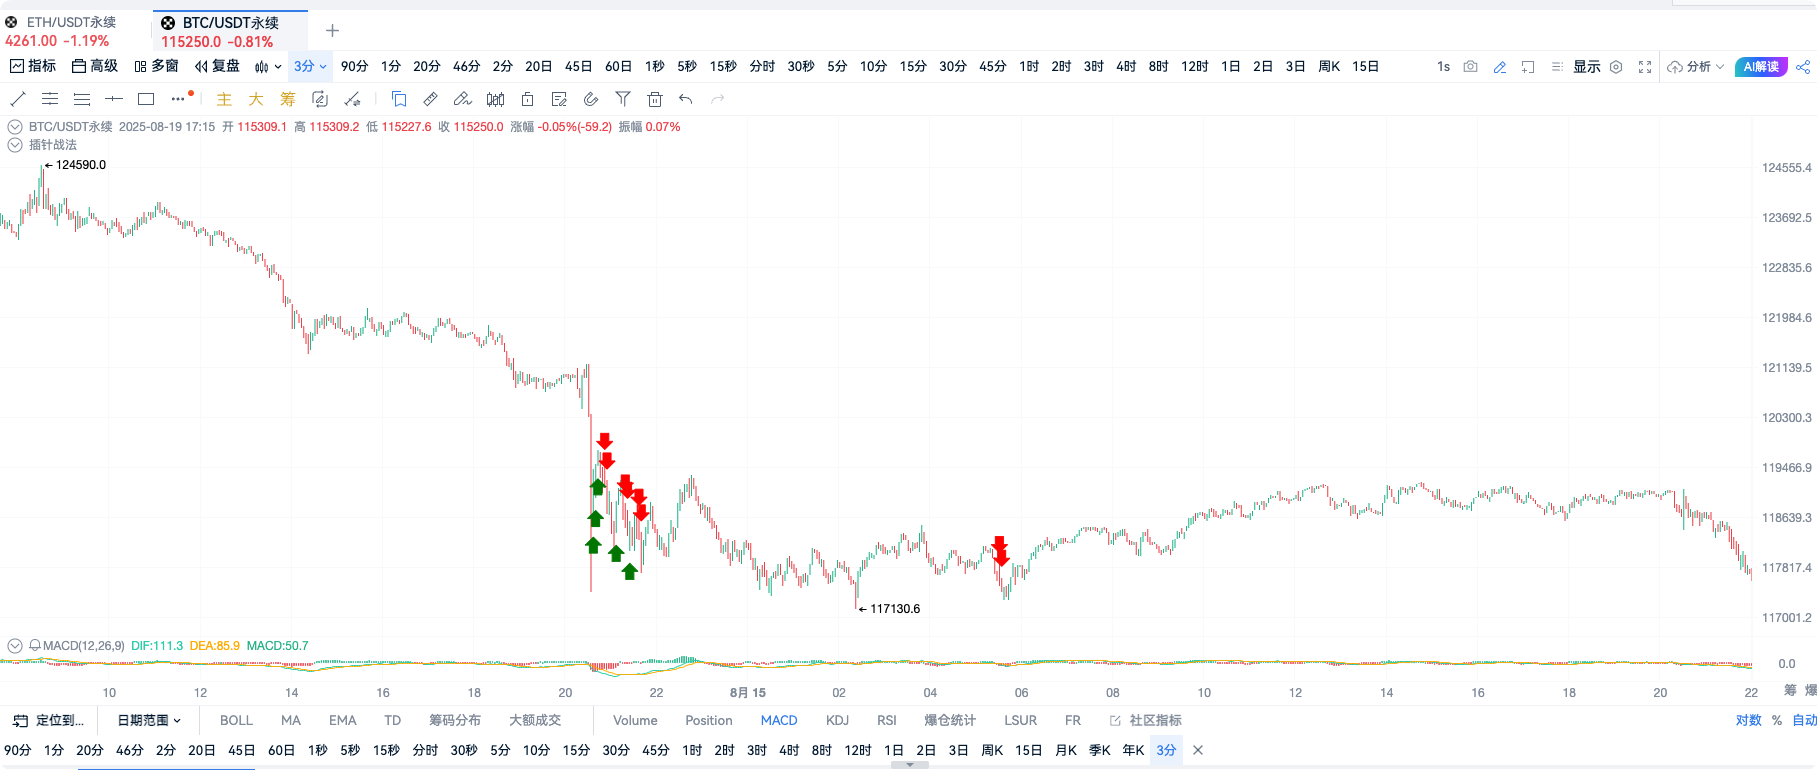
Chart OKX-BTCUSDT perpetual contract 3-minute period
# Backtesting Analysis
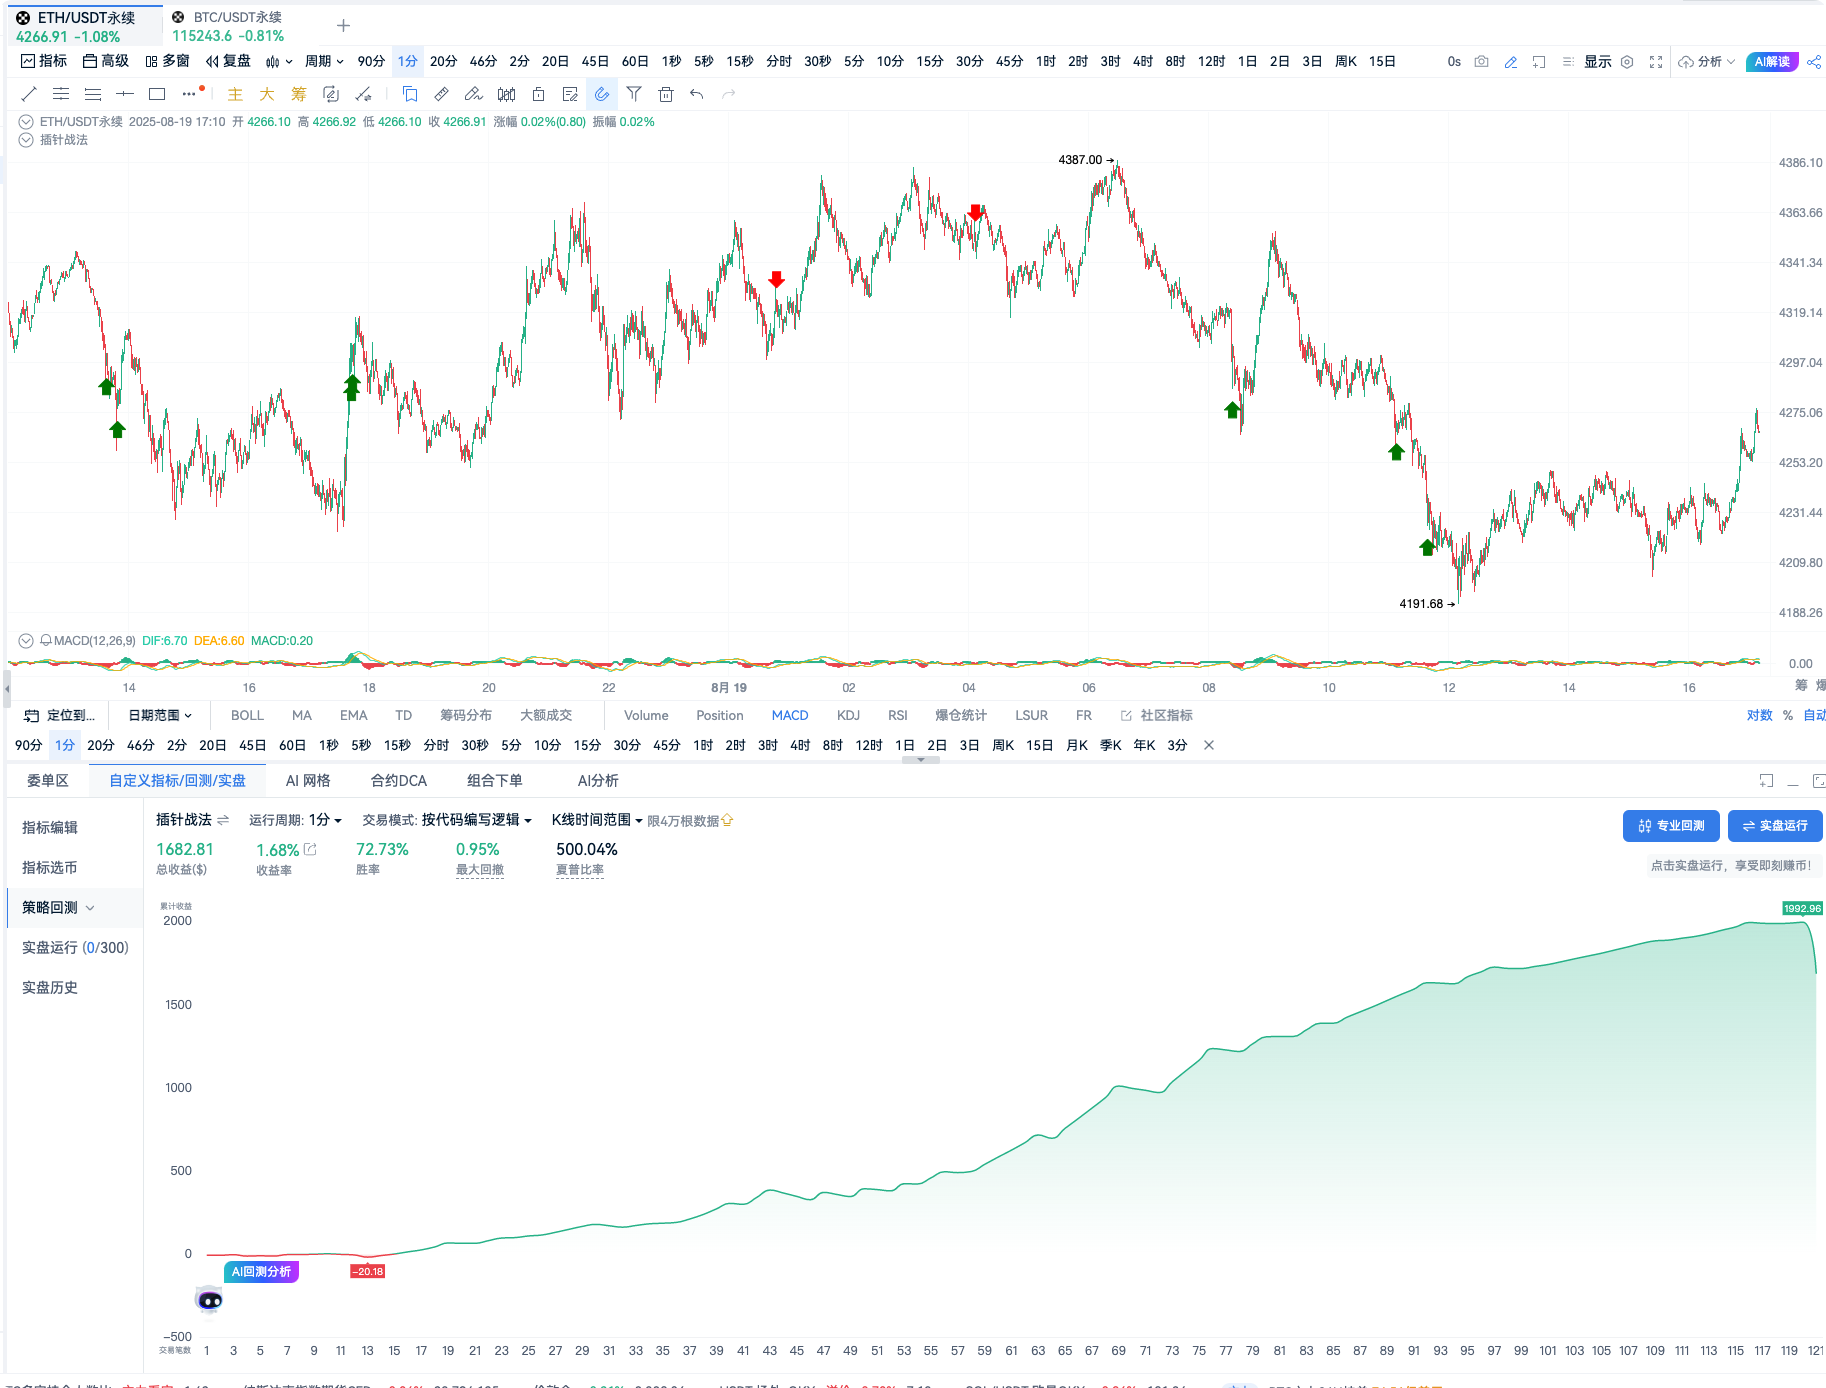
Chart OKX-ETHUSDT perpetual contract 1-minute period
Backtest Highlights: Win Rate 72.73%, Maximum Drawdown: 0.95%
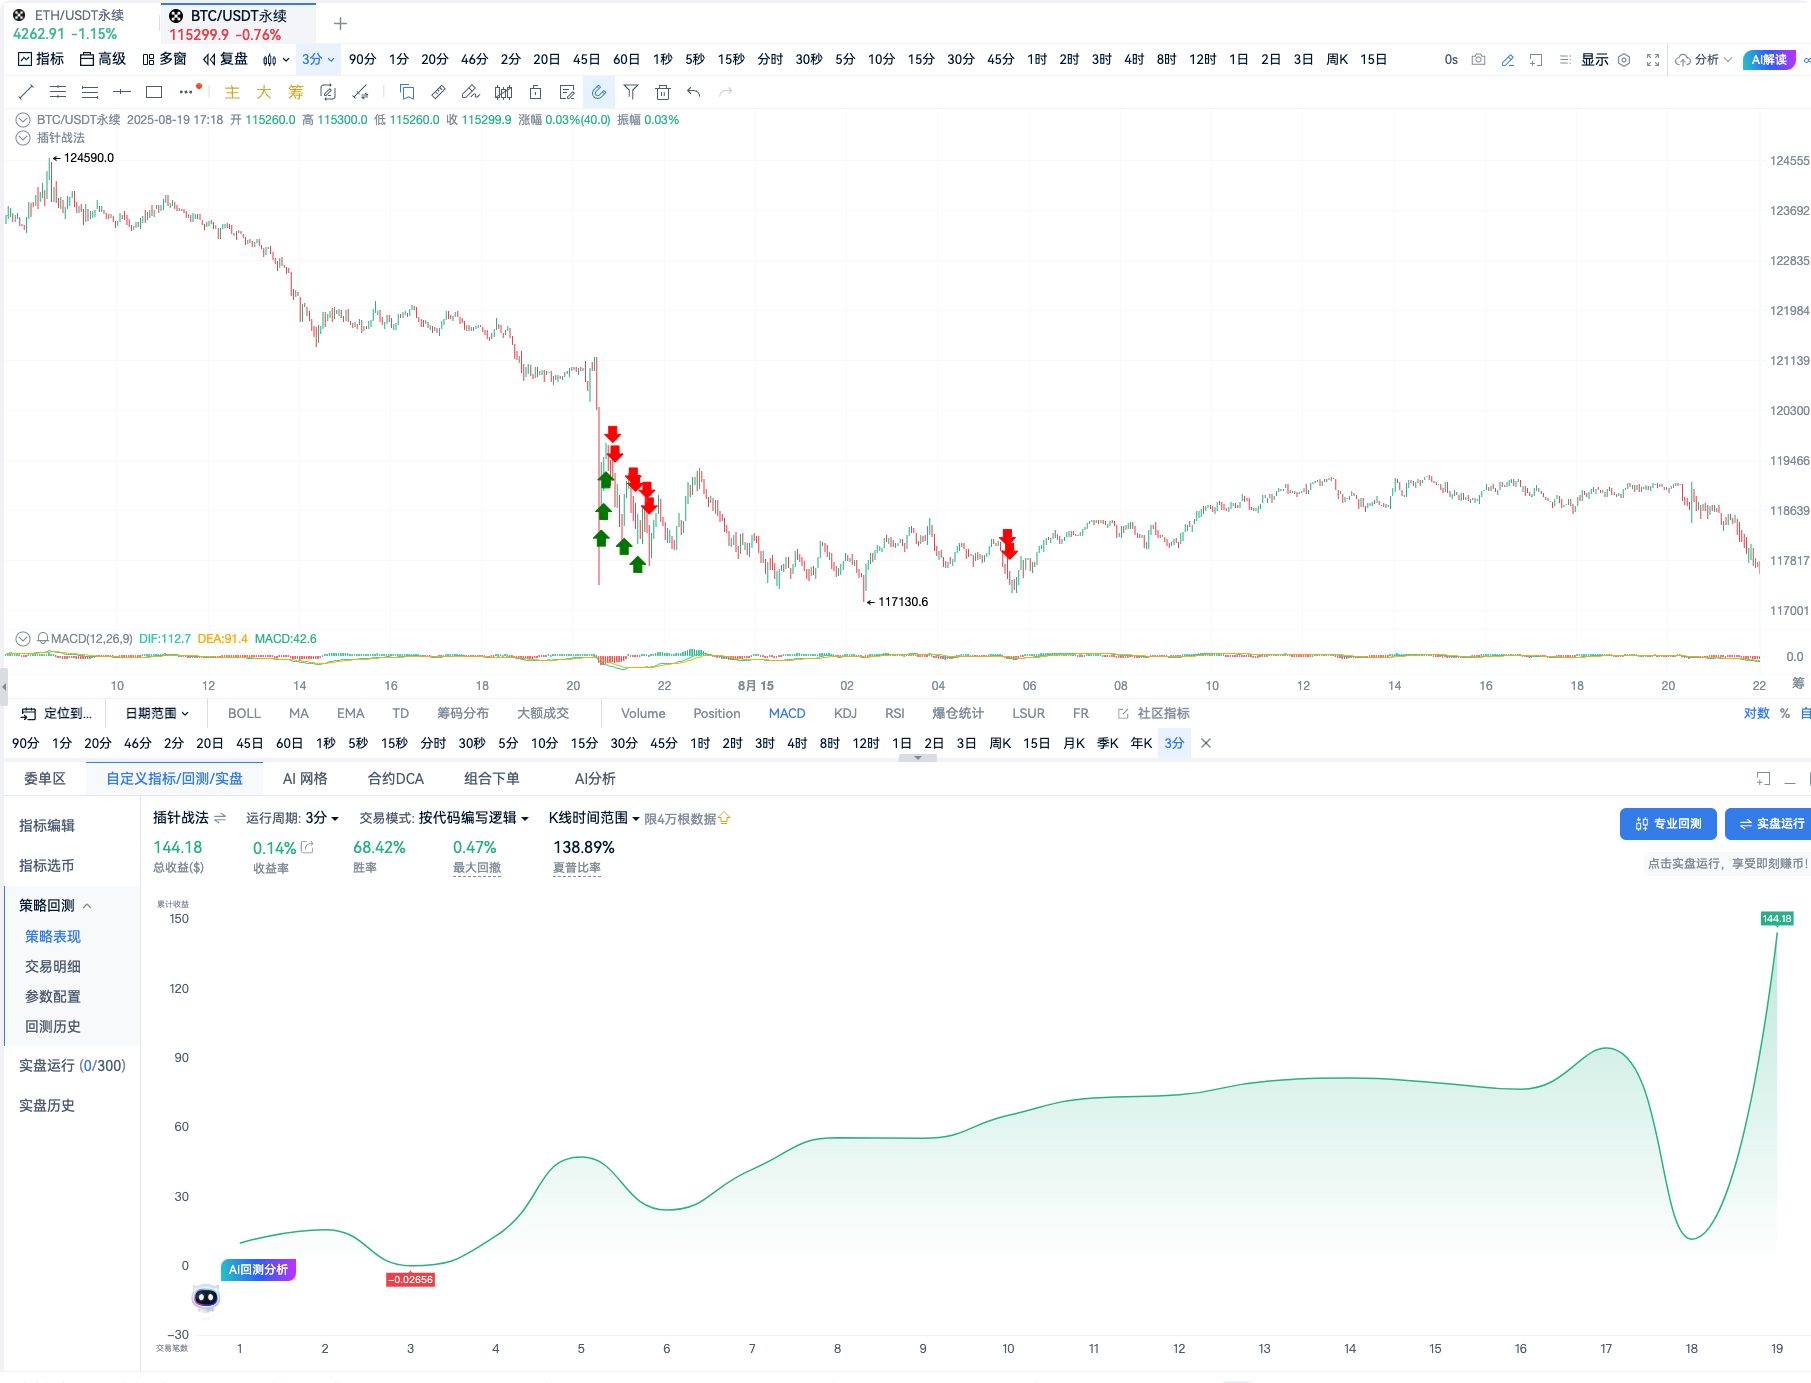
Chart OKX-BTCUSDT perpetual contract 3-minute period
Backtest Highlights: Win Rate 68.42%, Maximum Drawdown: 0.47%
# Indicator Source Code
//@version=2
// Amplitude threshold
amplLimit=0.003
// Body threshold
solidLimit=0
// Shadow limit
shadowPctLimit=0.002
// Calculate upper shadow
overshadow = high - max(open, close)
// Calculate candlestick body
solid = abs(close - open)
// Calculate lower shadow
undershadow = min(close, open) - low
// Calculate amplitude
ampl = (high - low) / close[1]
// Calculate upper shadow percentage change
overshadowPct = overshadow / max(open, close)
// Calculate lower shadow percentage change
undershadowPct = undershadow / min(close, open)
// Pinbar judgment algorithm
pinbar = 0
if (ampl > amplLimit) {
if (solid > solidLimit && undershadowPct > shadowPctLimit && overshadowPct > shadowPctLimit) {
pinbar := 4
}
else if (solid >= solidLimit && undershadowPct > shadowPctLimit) {
pinbar := -1
} else if (solid >= solidLimit && overshadowPct > shadowPctLimit) {
pinbar := 1
}
}
// 1 is upper Pinbar
// -1 is lower Pinbar
// 4 is both upper and lower Pinbar
up = (pinbar == 1 and close < open) or (pinbar[1] == 1 and close < open)
down = (pinbar == -1 and close > open) or (pinbar[1] == -1 and close > open)
// up = pinbar == 1
// down = pinbar == -1
// Create corresponding alert conditions for use in the alert window
alertcondition(up, title='Upper Pinbar', direction="sell")
alertcondition(down, title='Lower Pinbar', direction="buy")
// Draw on the chart
// plot(close, title="Close")
plotShape(up, title="Upper Pinbar", shape='arrowDown', color='red', refSeries=high, placement='top', fill=true)
plotShape(down, title="Lower Pinbar", shape='arrowUp', color='green', refSeries=low, placement='bottom', fill=true)
// Close short and open long
exitShort(down, price='market', amount=1)
enterLong(down, price='market', amount=1)
// Close long and open short
exitLong(up, price='market', amount=1)
enterShort(up, price='market', amount=1)
# Summary
A Pinbar is a uniquely structured candlestick with a long shadow and a short body, resembling the market "probing" at a certain price level. When this probe appears in key price areas, such as support or resistance levels, it often suggests that the market is testing and intends to reverse, helping us determine the trend direction.
If the shadow appears below (long lower shadow): The market is receiving strong support, and the likelihood of a price rebound upwards is high, which is a typical bullish signal.
If the shadow appears above (long upper shadow): The market is facing strong resistance, and the likelihood of a price drop downwards is high, which is a typical bearish signal.
The Pinbar can be understood as a market "probe," reflecting the behavior of rejecting extreme price levels and tending towards balance during price fluctuations. In simple terms, this special candlestick pattern can capture the market's directional choices at critical moments, providing clear guidance for trading decisions. However, it is worth noting that relying solely on Pinbar signals may carry certain risks; we recommend combining them with other indicators (such as trend, momentum, or volatility indicators) to enhance the precision and stability of the signals, thereby improving the effectiveness of the strategy.
Join our community to discuss and grow stronger together!
Official Telegram community: t.me/aicoincn
AiCoin Chinese Twitter: https://x.com/AiCoinzh
Group chat - Wealth Group: https://www.aicoin.com/link/chat?cid=10013
免责声明:本文章仅代表作者个人观点,不代表本平台的立场和观点。本文章仅供信息分享,不构成对任何人的任何投资建议。用户与作者之间的任何争议,与本平台无关。如网页中刊载的文章或图片涉及侵权,请提供相关的权利证明和身份证明发送邮件到support@aicoin.com,本平台相关工作人员将会进行核查。