
After Powell's speech, Bitcoin rose by five points, and Ethereum increased by 15%. The CME's interest rate cut expectations briefly surged to 91% before retreating to the current 75%. Bitcoin peaked at 117,300, and over the weekend, it tested the support around 114,700 again. On the 23rd, the analyst reminded that if it cannot quickly rise above 118,600, the risk of a decline cannot be eliminated, so we will see if it can grind its way up.
The key focus is still on Ethereum, which peaked at 4,886 before retreating and is currently maintaining around 4,750. The analyst's view is that the entire crypto market has entered the second phase, with Ethereum leading the way. This can also be considered as the mid-to-late stage of a bull market. Here, we can refer to January 2021 when Bitcoin surged to 64,800, increasing by about 1.2 times, while Ethereum rose from 950 to over 4,300, nearly 3.6 times.
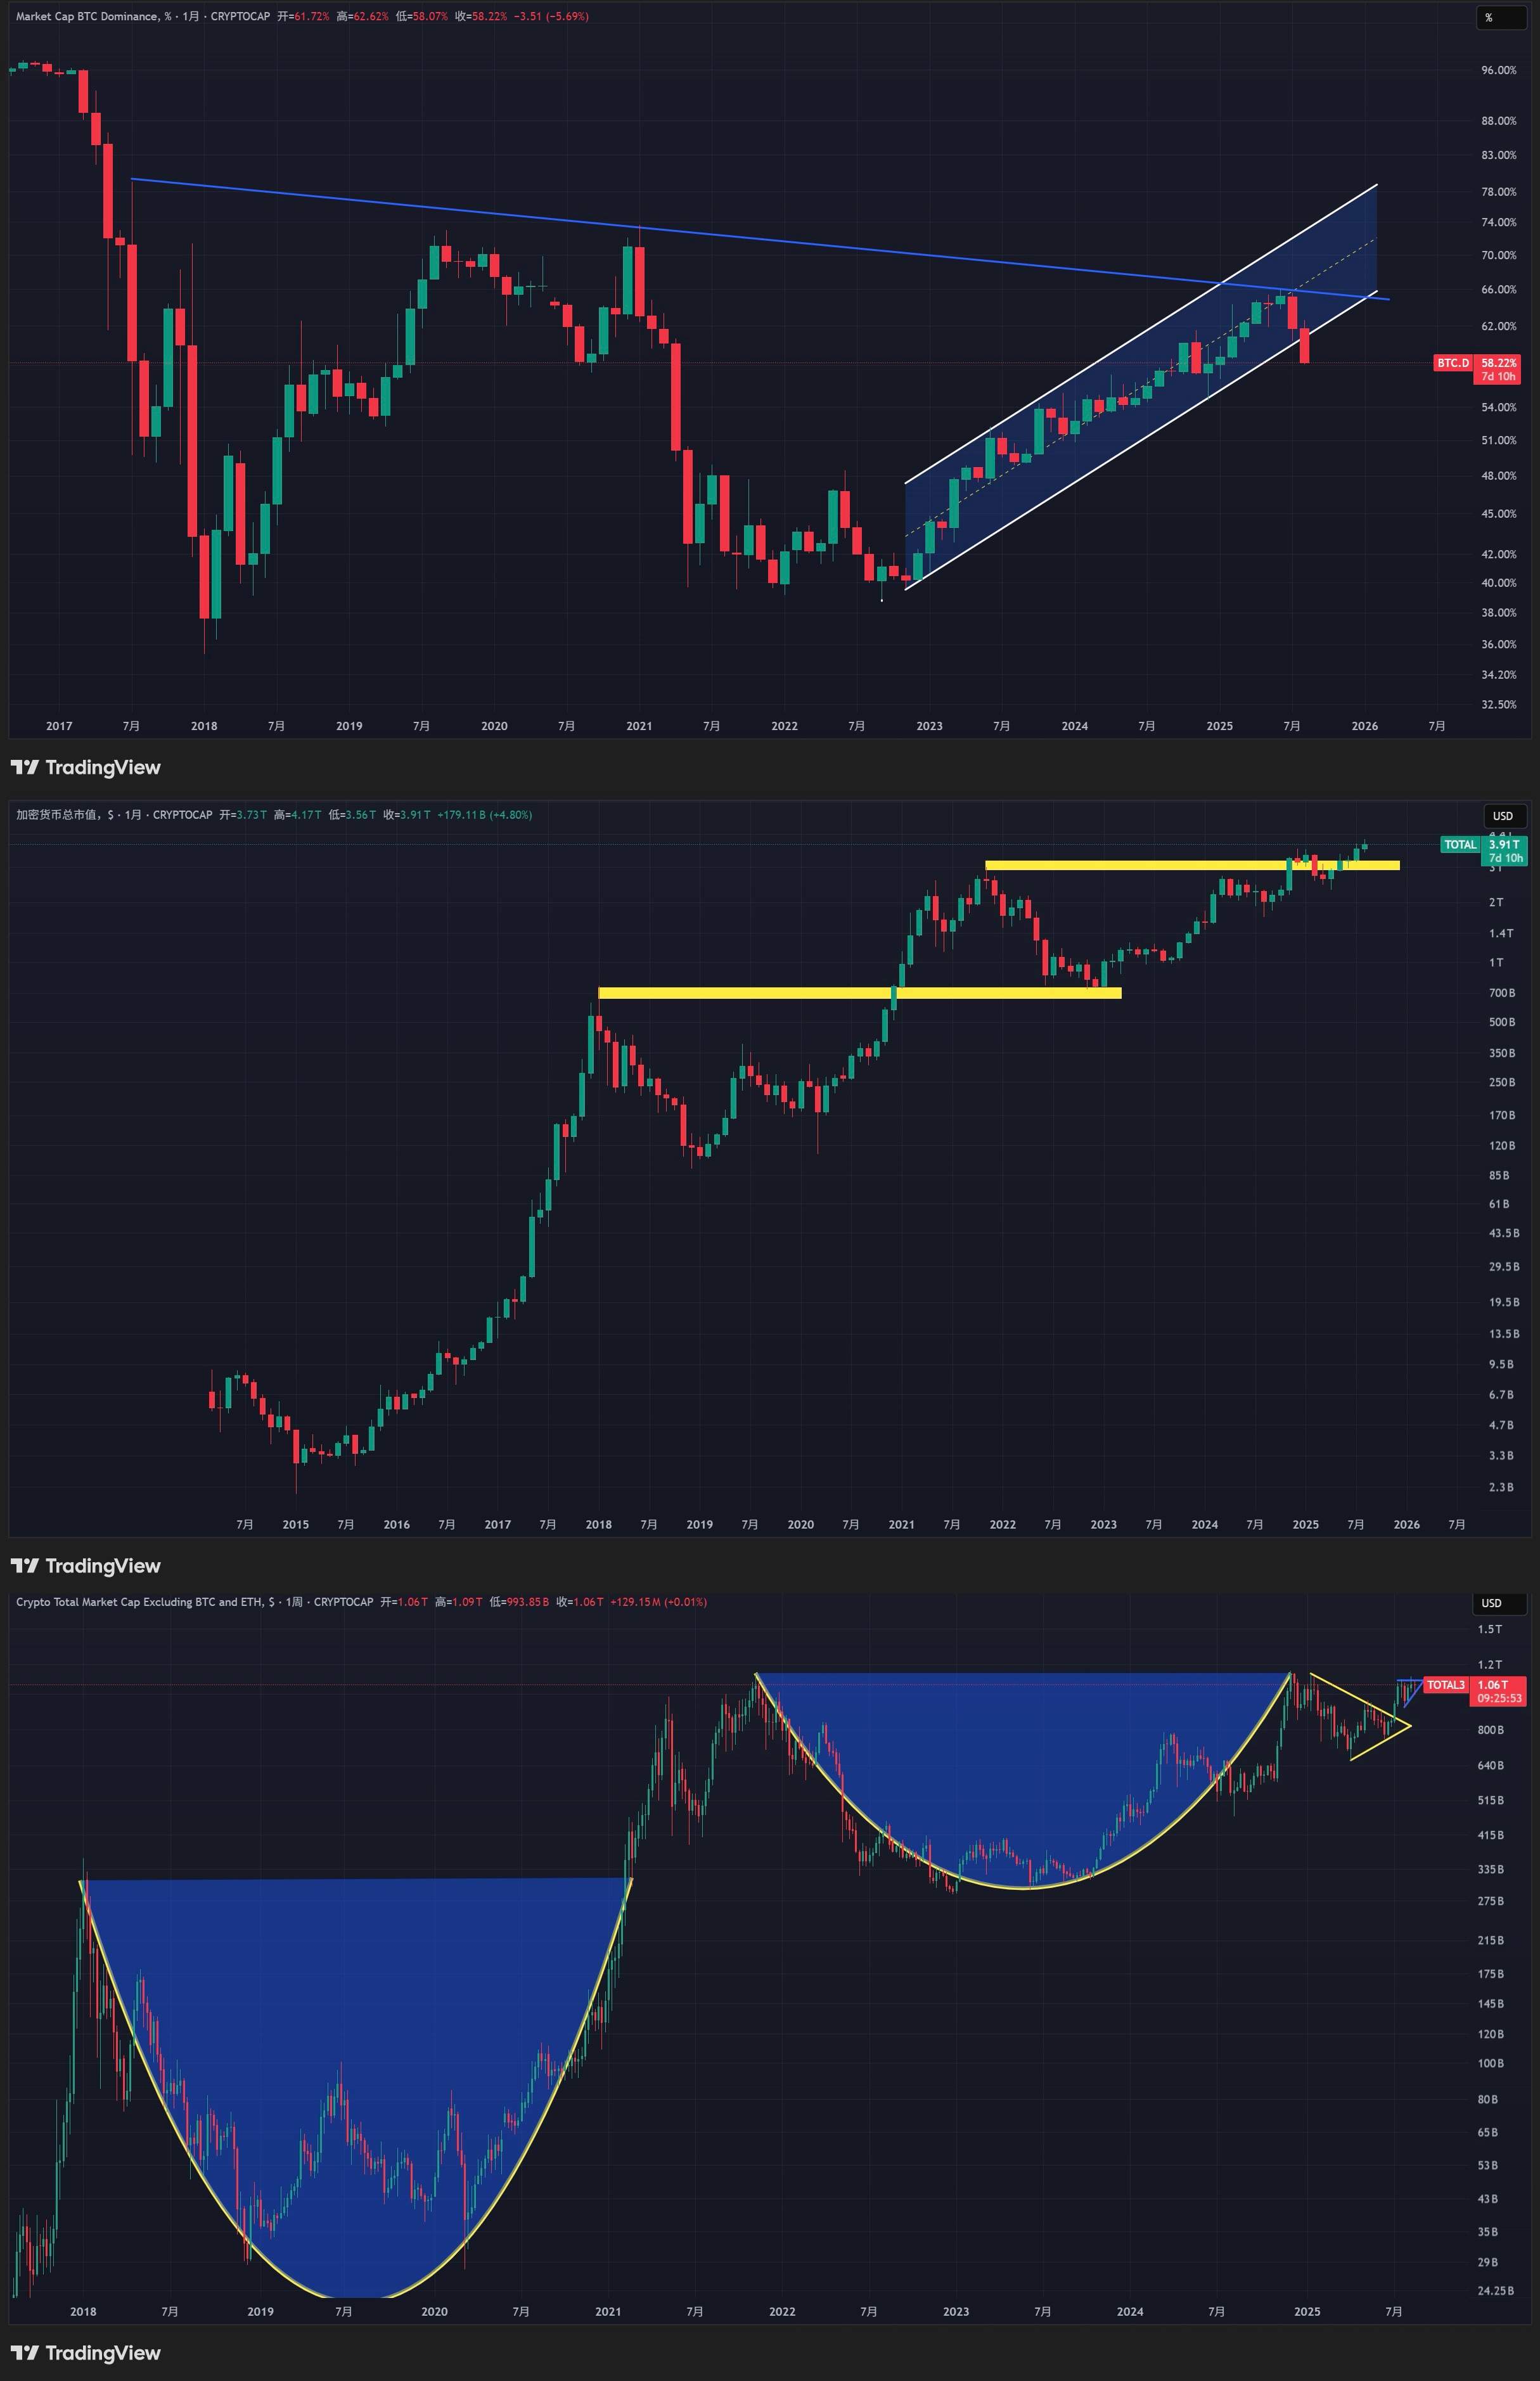
Now let's look at a few data indicators. The first is the BTC D, which shows that Bitcoin's market cap share has been declining for two consecutive months, with a drop of 11%. Currently, many large holders are reallocating their portfolios to favor Ethereum and altcoins, which increases the risk for Bitcoin as funds flow out of it. If Ethereum can maintain a strong performance, this situation may last for two to three months, but if it moves quickly, it could be just one or two months. At that time, Bitcoin's correction could pull it down.
The second indicator is the TOTAL cryptocurrency market cap, which has broken a historical high and has formed two doji candles. From the daily chart, there is a chance to create a new high.
The third indicator is the Crypto Total Market Cap Excluding BTC and ETH, which has also approached historical highs and has formed a triangular structure, indicating a high probability of a breakout. Among the top 100 cryptocurrencies by market cap, only four altcoins have outperformed Ethereum: OKB, PENGU, AERO, and CFX. However, in recent days, we have seen short-term rebounds in BIO, Qtum, MEME, and others.
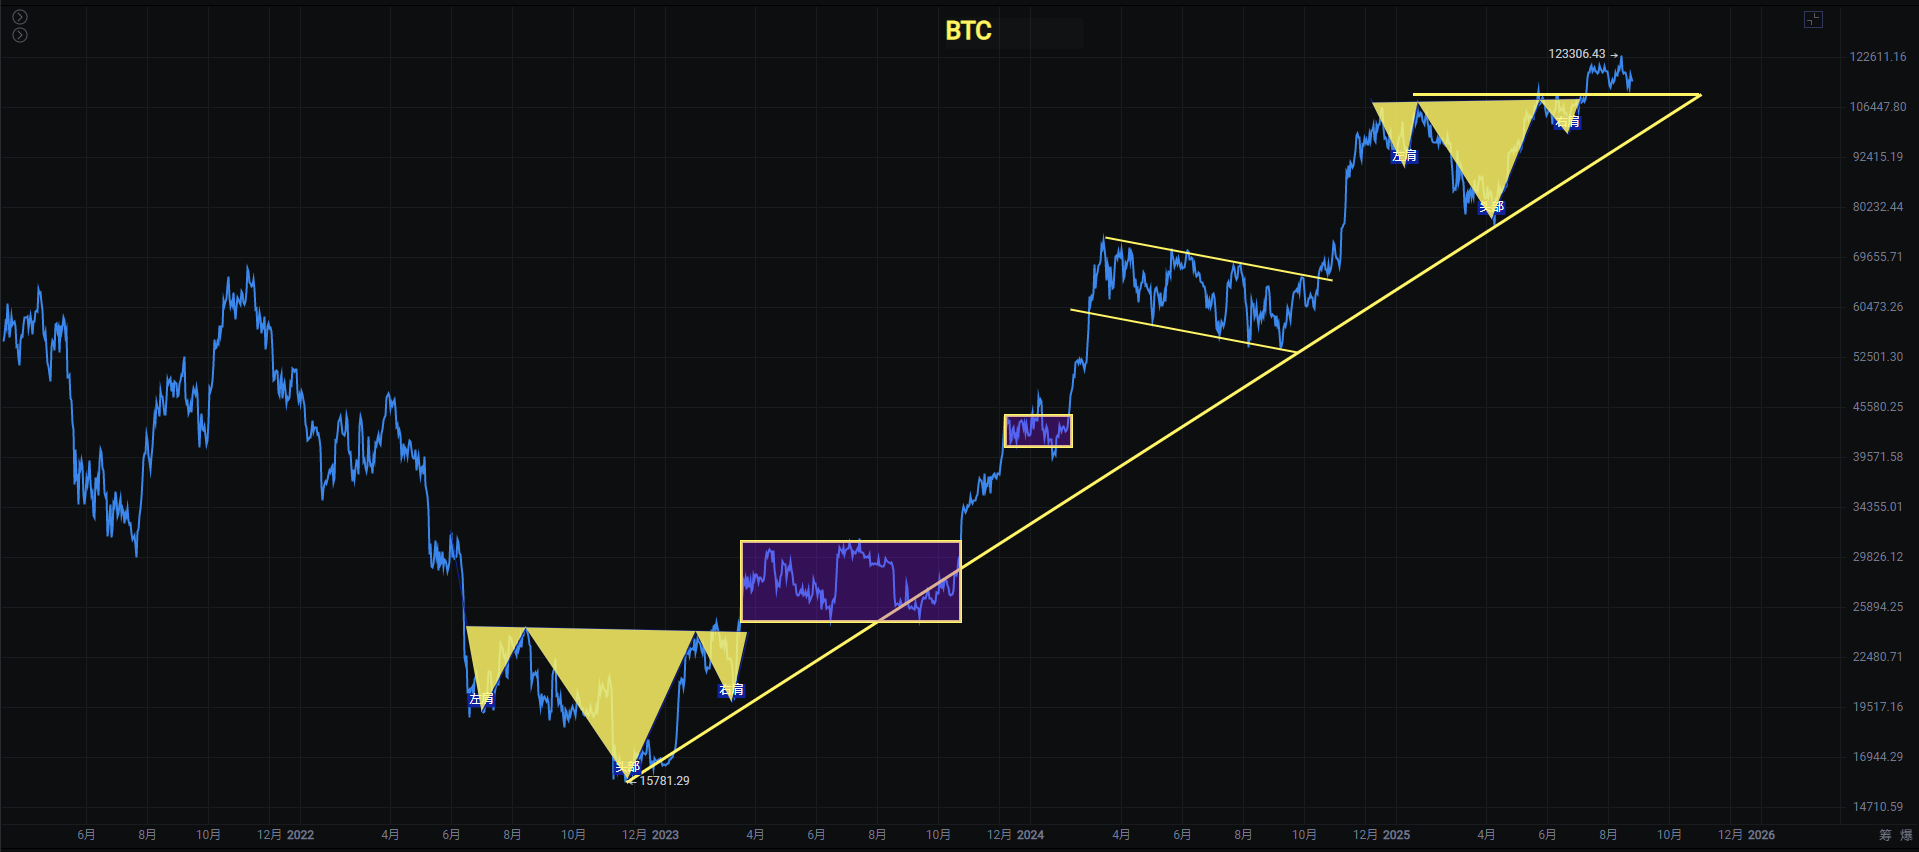
Bitcoin
Bitcoin's monthly line has about a week left to close. The opening next month is crucial; if it falls below 112,000, the downside potential will open up. The weekly chart has been consolidating at high levels for six weeks, with two upward spikes that fell back. Now we are watching the support around 112,000.
On the daily chart, it is still within the box and is temporarily moving according to the box's fluctuations. However, if the ascending support line is broken, we need to consider that failing to reclaim this trend line could lead to a third or even fourth test of the 112,000 support, which carries the risk of breaking it. The daily chart is under pressure from the 20-day moving average, so we need to pay attention to whether the MACD can form. Currently, the 4-hour chart is testing the support around 114,500, and we will focus on the strength of the rebound.
Support: 111,625 to 114,500
Resistance: 117,500 to 118,600 to 121,000
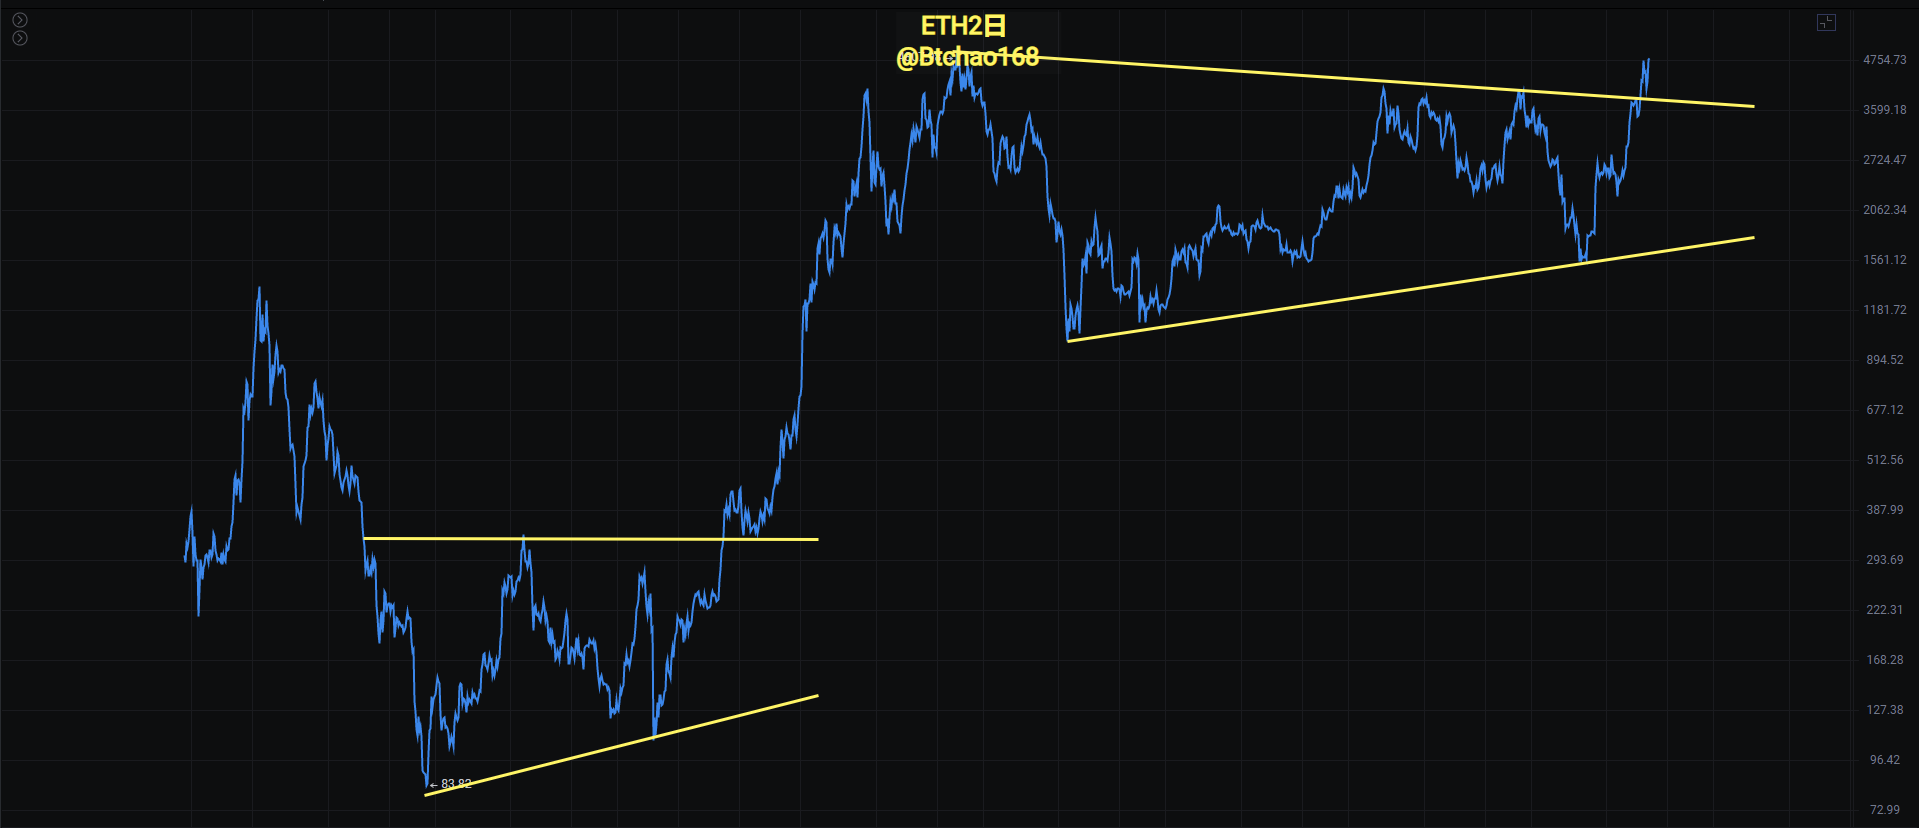
Ethereum
Ethereum's weekly chart has a converging triangle breakout and has also reached a historical high, still looking for further acceleration. The first target is 5,600, and the second target is 6,700. As for Tom Lee and other external institutions predicting 15,000 to 20,000, we will not set overly high expectations for now.
In the eyes of seasoned investors, 10,000 dollars for Ethereum is a psychological barrier, just like the 100,000 mark for Bitcoin. This cycle for Ethereum reaching such levels is already a blessing, so we must remain calm when others are FOMOing. This time, Ethereum has risen from over 1,000 to over 3,000, and now we see it at 5,700 and even 6,700.
On the daily chart, it has already broken the historical high, peaking at 4,887, and the recent pullback has been relatively small, so Ethereum is still stable. By the end of the year, there is also the Fusaka upgrade, and the only time the risk is significant is if Bitcoin falls below 112,000.
Support: 4,400 to 4,658
Resistance: 5,600 to 6,700
If you like my views, please like, comment, and share. Let's navigate through the bull and bear markets together!!!
The article is time-sensitive and for reference only, with real-time updates.
Focusing on K-line technical research, sharing global investment opportunities. Official account: BTC Trading Analyst Fusu

免责声明:本文章仅代表作者个人观点,不代表本平台的立场和观点。本文章仅供信息分享,不构成对任何人的任何投资建议。用户与作者之间的任何争议,与本平台无关。如网页中刊载的文章或图片涉及侵权,请提供相关的权利证明和身份证明发送邮件到support@aicoin.com,本平台相关工作人员将会进行核查。


