Author: White55, Mars Finance
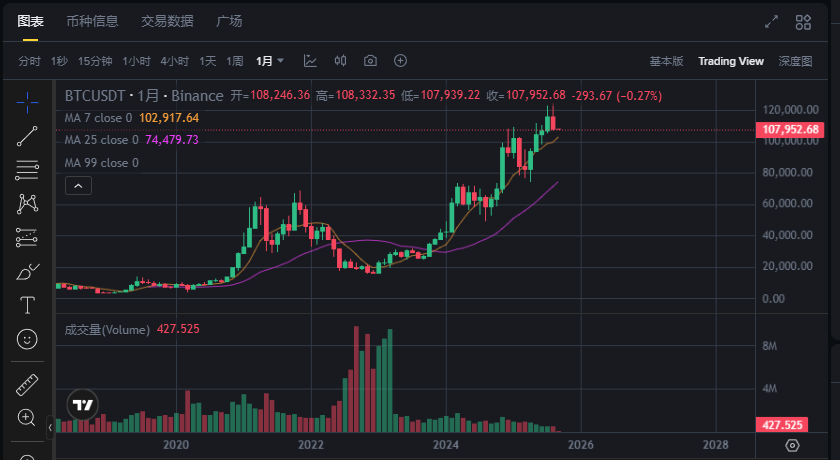
The Bitcoin market has once again reached a critical turning point. As of today, September 1st, Bitcoin's price closed at around $108,000 in August, marking the first monthly decline since April.
The current Fear and Greed Index has dropped to a neutral 47, with retail investors no longer experiencing the euphoric highs of Bitcoin's continuous new peaks at the beginning of the month, while whales are hesitating on whether to increase their positions or sell amid the ongoing decline.
The market is caught in a fierce battle between the historical "September Curse" and the potential bullish signals that could lead to new highs. This contradiction and uncertainty lay the groundwork for September's market trends.
Historical Patterns: September as Bitcoin's Traditional Weak Period
Since Bitcoin began trading, September has been known for its weak performance.
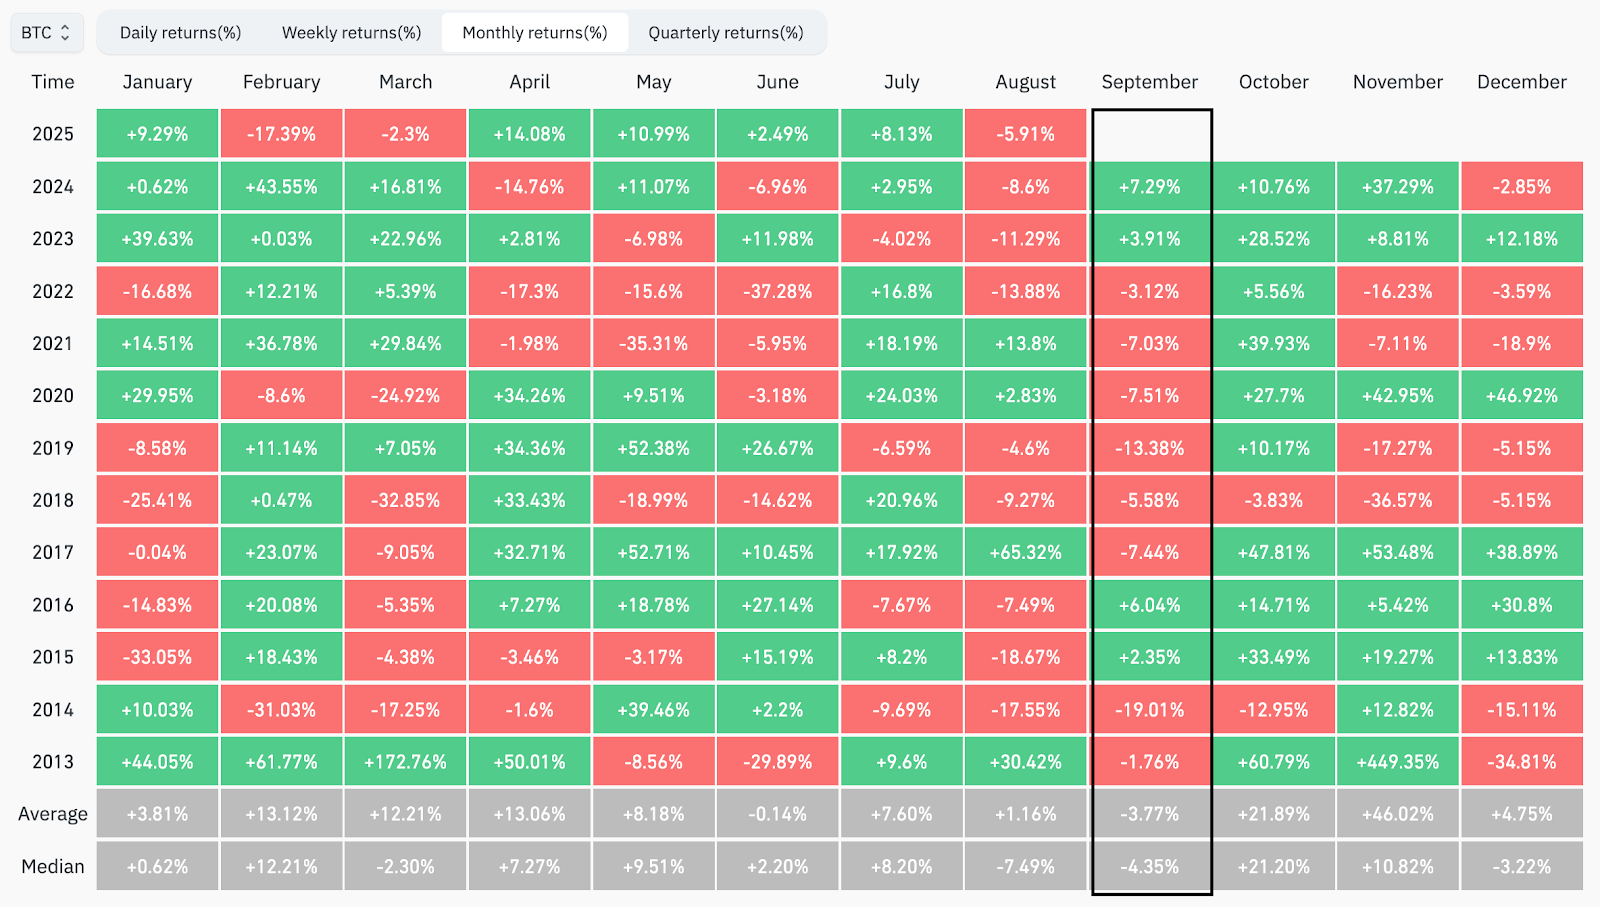 Bitcoin Monthly Return Rate
According to historical data from Coinglass, Bitcoin's average decline in September is 3.77%, making it one of only two months in the year with a negative average return.
A deeper analysis of the data reveals that in the past 14 years, Bitcoin has declined in September in 10 of those years, with a drop probability of 71.4%. Notably, in September 2011, Bitcoin plummeted by 37.65%, marking the worst single-month performance in history.
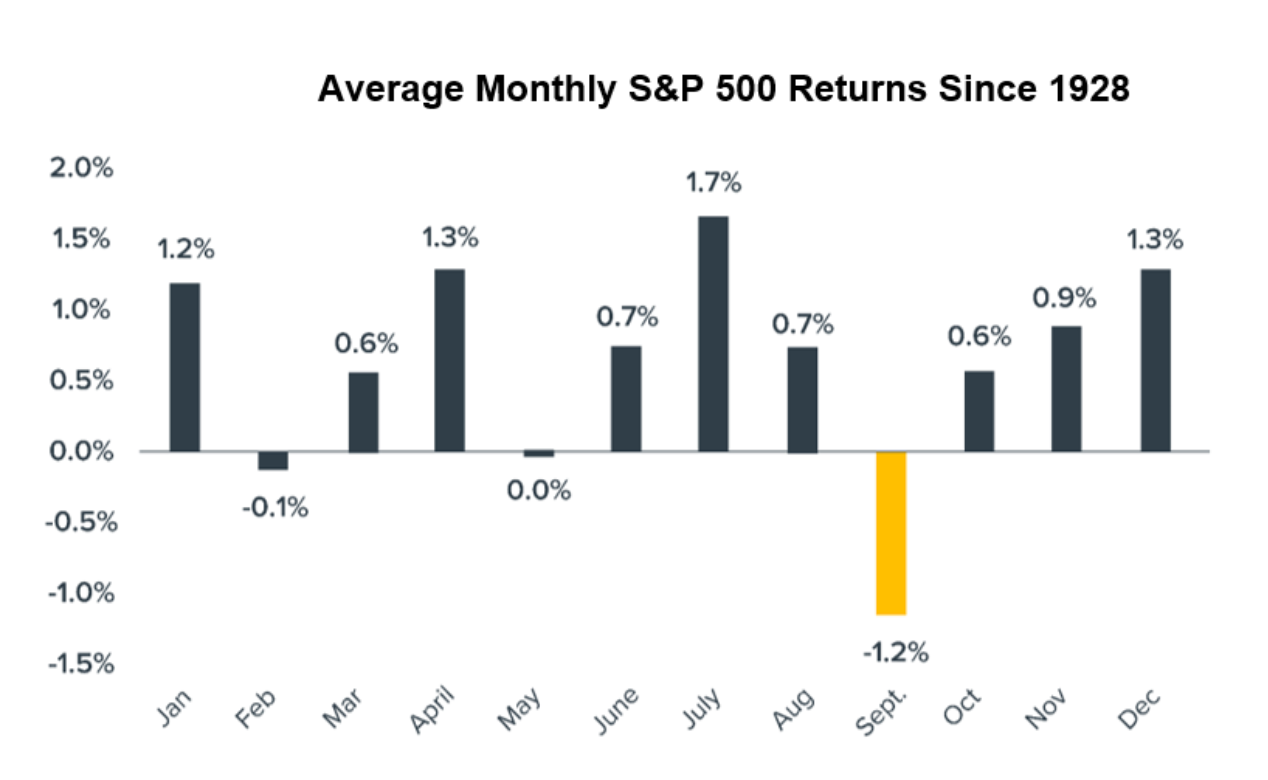 Average Monthly Return of the S&P 500 Index Since 1928
The traditional stock market also exhibits a "September Effect." Since 1928, the average return of the S&P 500 Index in September has been approximately -1.2%, making it the only month with consistently negative performance. This seasonal weakness has plagued the market for nearly a century.
The regular decline is supported by market mechanisms. Mutual funds typically end their fiscal year in September, triggering tax-loss harvesting and portfolio rebalancing, which releases a large volume of sell orders into the market.
Multiple Factors Contributing to September's Weakness
The formation of "Red September" is not coincidental but rather the result of multiple factors working together.
Yuri Berg, an advisor at Swiss crypto liquidity provider FinchTrade, points out: "This pattern is easy to predict: negative discussions on social media tend to spike around August 25, followed by an increase in Bitcoin exchange deposits within 48-72 hours."
Liquidity contraction is one of the core factors. After the summer holidays, traders return to their positions and reassess after months of low liquidity. Meanwhile, a surge in bond issuance after Labor Day leads institutional funds to shift from stocks and risk assets to fixed-income products.
Uncertainty in Federal Reserve policy also exacerbates market volatility. The Federal Open Market Committee (FOMC) meeting in September often freezes buying activity until the policy direction becomes clear.
In the cryptocurrency space, these pressures are further amplified: Bitcoin trades 24/7, and there is no "circuit breaker" when sell-offs accelerate; combined with a smaller overall market capitalization, it is more susceptible to the movements of whale funds.
Recent Performance: Market Shows Signs of Weakness and Downward Pressure
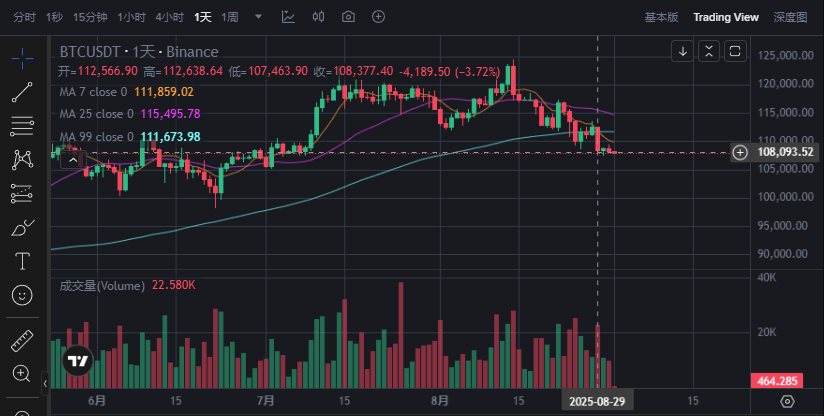
The market has already shown signs of weakness by the end of August. On August 26, Bitcoin fell to $108,717, marking its fourth consecutive day of decline. Ethereum also saw a significant pullback, dropping to $4,314, down 13% from its historical high. Following a brief rebound, Bitcoin again sharply fell to a low of $107,300 on August 29, triggering large-scale liquidations.
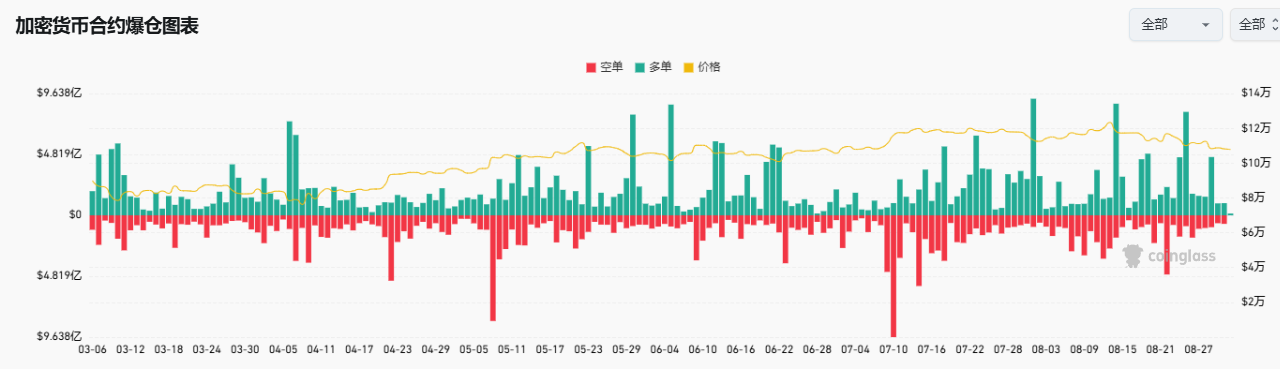
According to CoinGlass data, the liquidation volume of long positions in the past month has far exceeded that of January to July, with a rapid chain reaction in the market, putting pressure on mainstream altcoins across the board.
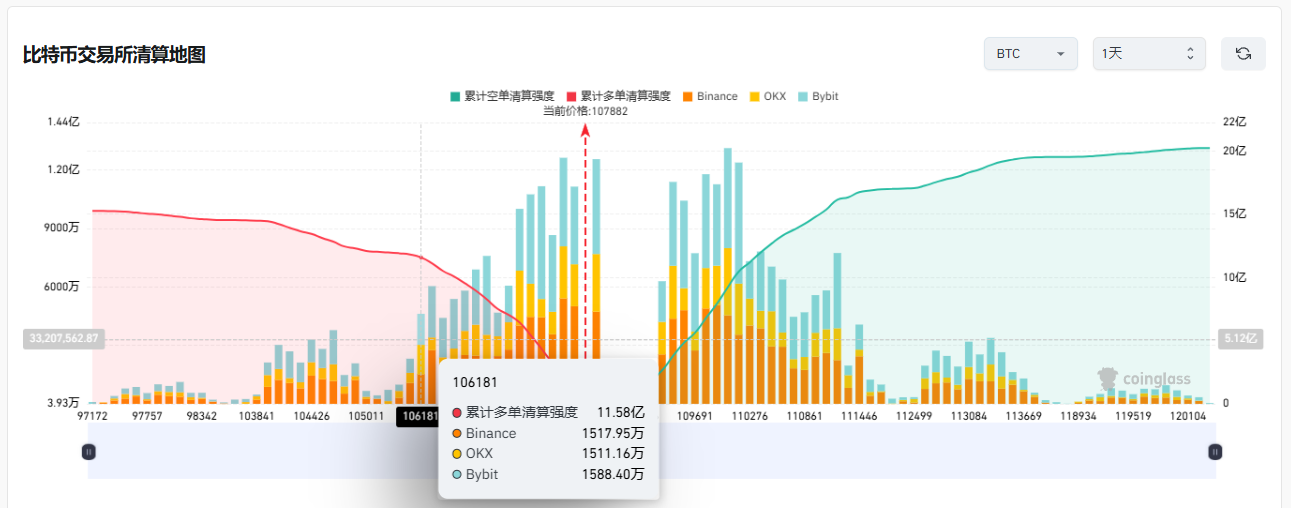
Based on Coinglass data, if Bitcoin falls to $106,000, it could trigger over $1.1 billion in long liquidations.
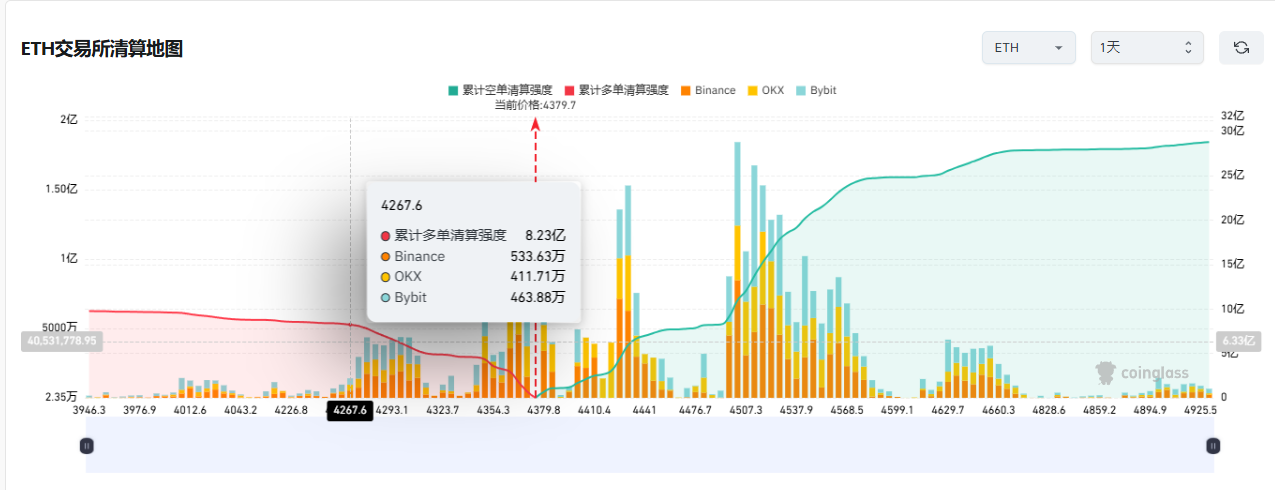
According to Coinglass data, if Ethereum falls to $4,260, it could trigger over $800 million in long liquidations.
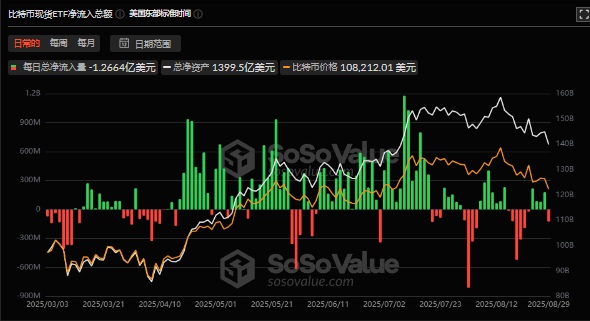
The slowdown in ETF fund inflows has further intensified bearish pressure. In the past two weeks, nearly $1.5 billion has flowed out of Bitcoin ETFs, indicating a weakening of institutional investor confidence.
On-chain data also reveals structural signals. Glassnode points out that all Bitcoin holder groups "have collectively entered the distribution phase," highlighting that the market is experiencing widespread selling pressure.
Divergent Views: Market Analysts Split on Outlook
Faced with a complex market environment, analysts have shown clear divergence in their views on the short-term outlook.
Some analysts believe that Bitcoin may retest the $100,000 mark.
Dr. Profit predicts that September may dip below $100,000, followed by a potential rebound.
Doctor Profit adds a pessimistic judgment from macro and psychological perspectives. He believes that the Fed's interest rate cuts in September are more likely to ignite uncertainty rather than be a positive factor. Unlike the "soft landing rate cuts" expected in 2024, this time could represent a true "major turning point."
However, other analysts hold a different opinion. Rekt Fencer states: "Bitcoin will not drop below $100,000 in this cycle and will reach new highs again."
Analyst Rekt Fencer indicates that based on Bitcoin's performance in 2017, there will be "no September crash" this year.
The charts of 2017 and 2025 overlay to present an almost mirrored image. In both cycles, Bitcoin experienced a significant drop at the end of August, stabilized at key support levels, and then reversed to rise.
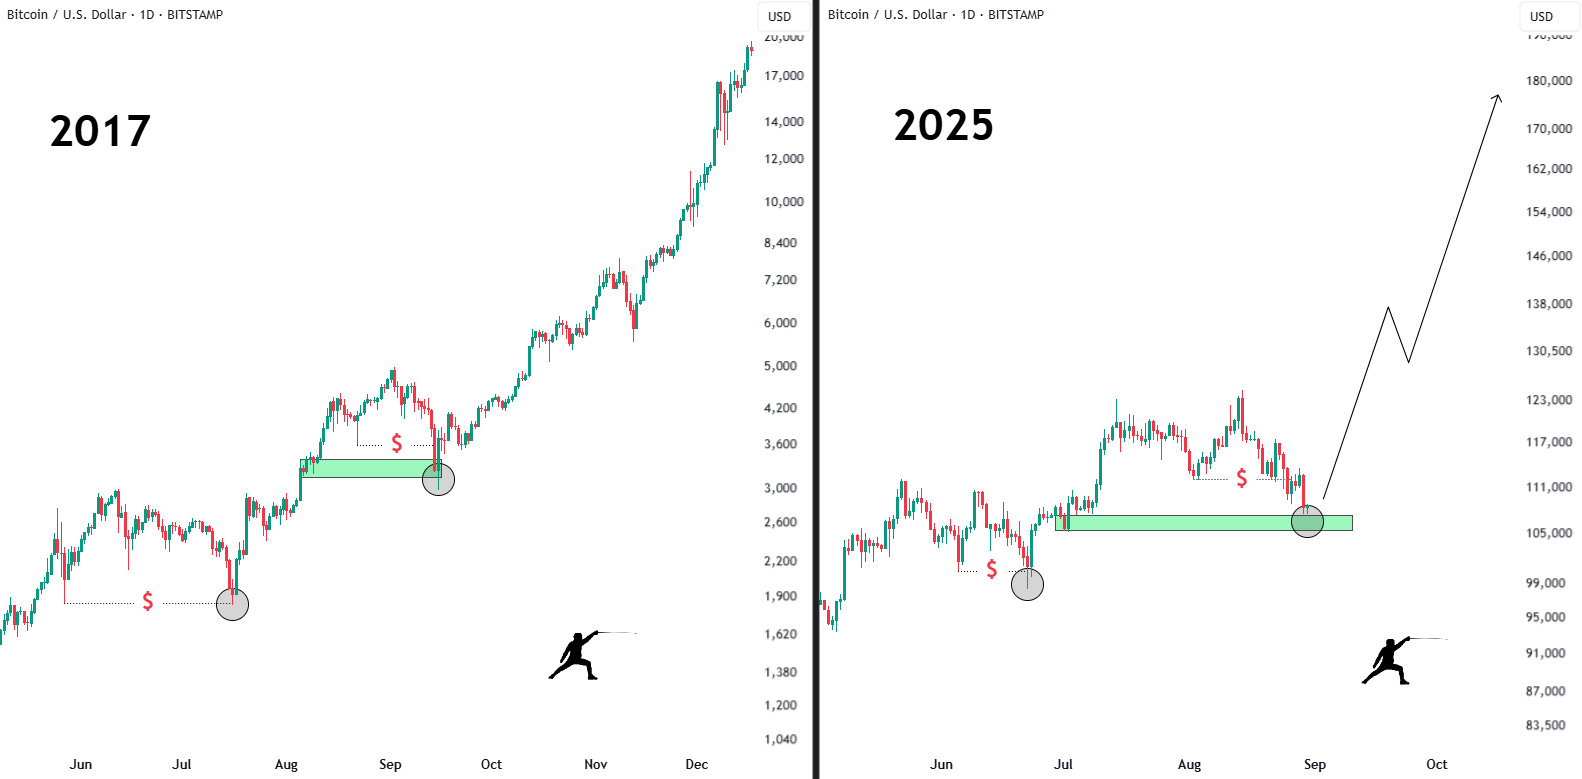 Comparison of Daily Price Trends of BTC/USD in 2017 and 2015.
As early as 2017, that retest marked the last shakeout before BTC's price soared to $20,000.
Fast forward to today, Bitcoin is once again hovering around the $105,000 to $110,000 range, which could serve as a launchpad for another parabolic rise.
Macroeconomic Environment: Weakening Dollar May Provide Support
Changes in the macroeconomic environment may support Bitcoin. Due to the slowing U.S. economy and the pressure of interest rate cut expectations on market sentiment, currency traders have begun to take a bearish stance on the dollar. They expect the dollar to decline another 8% this year, and Donald Trump's criticism of the Fed has intensified this downward trend.
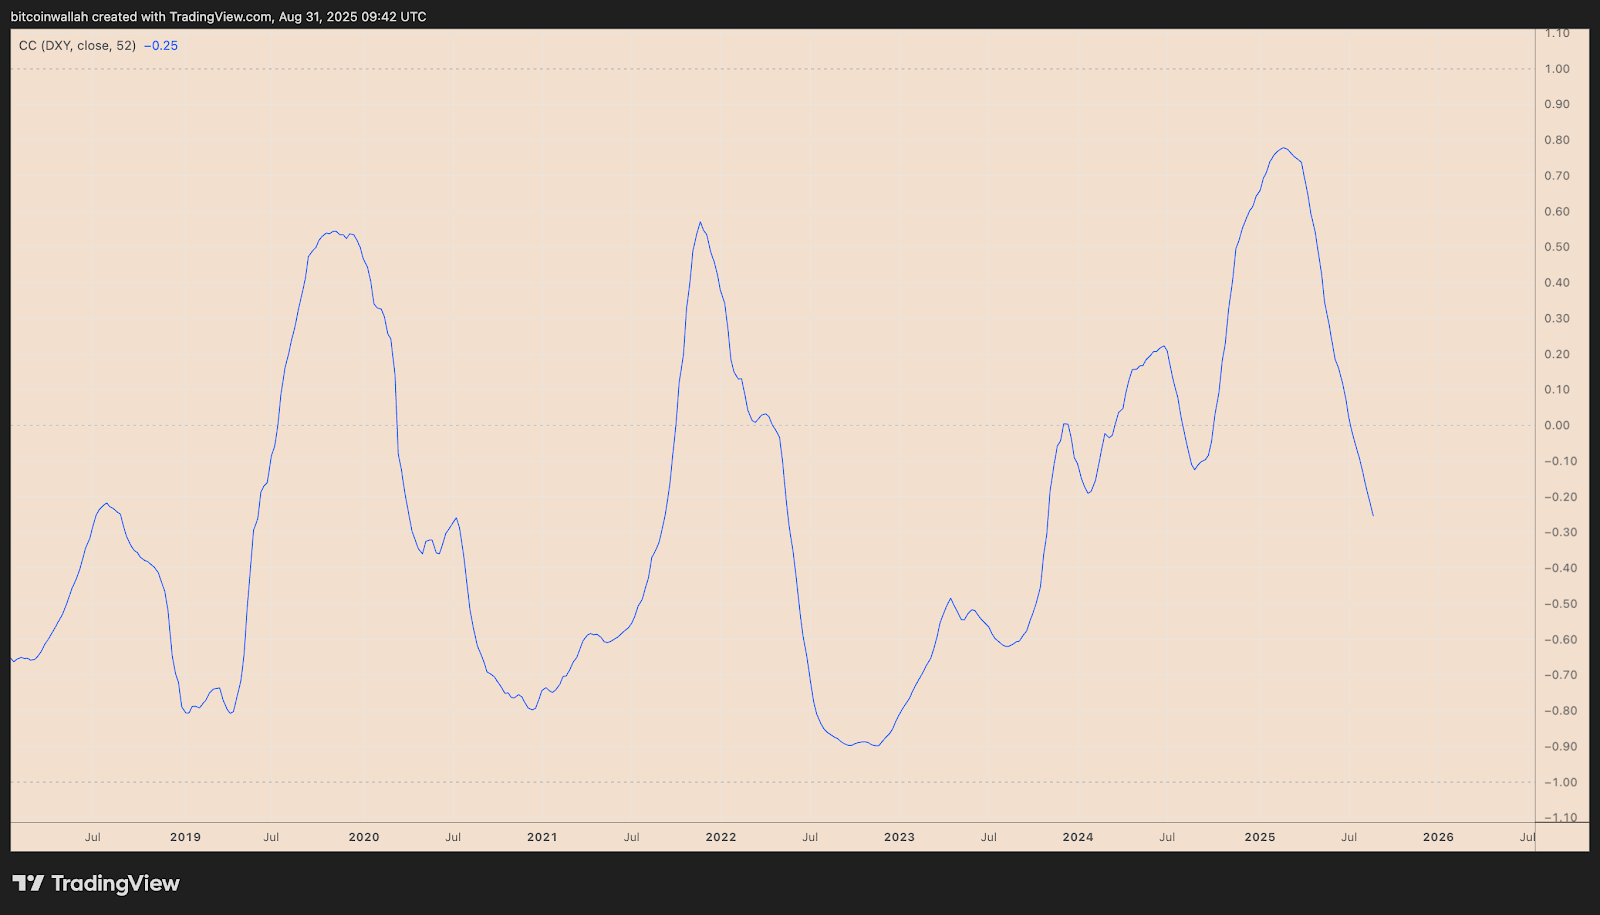 Correlation Coefficient of BTC/USD and DXY Over 52 Weeks.
Recently, the 52-week correlation between Bitcoin and the Dollar Index (DXY) has dropped to -0.25, the lowest level in two years. This strengthening negative correlation suggests that if the dollar continues to decline, the likelihood of Bitcoin rising increases.
The Fed's policy direction remains a key variable. The market widely expects the Fed to cut rates again at the meeting on September 18. However, core inflation remains stagnant at 3.1%, and two ongoing wars are disrupting global supply chains, creating a "perfect storm."
Analyst Ash Crypto states: "The Fed will start the money printing machine in the fourth quarter of this year," adding, "Two rate cuts mean trillions of dollars will flow into the cryptocurrency market. We are about to enter a parabolic phase, and altcoin prices will skyrocket 10 to 50 times."
Three Scenarios: Possible Developments for September's Market
Based on the current market situation, I outline three possible scenarios.
Surge After a Drop — If BTC drops, its price may fall to the $100,000 to $104,000 range, thereby shaking off over-leveraged longs.** After that, a strong rebound could push it towards $130,000, with the bull market support band (BSB) around $106,000 serving as a launchpad.
Holding the Line — On the other hand, if BTC holds the $107,000 to $110,000 area**, it may quickly recover to $114,500 and rise, especially if rate cuts provide additional momentum.
Worst-Case Bear Market Signal — The real danger lies in a deeper decline. A drop towards the 50-week moving average ($92,000 to $98,000) would signal a trend reversal.** Historically, breaking below this level has marked the top of cycles, such as in 2017 and 2021.
Currently, the market generally considers a wide range of fluctuations / sideways consolidation to be the most probable scenario. In this scenario, mixed messages from bulls and bears create a lack of clear direction, with both sides balanced in strength, causing prices to fluctuate within a large range.
Conclusion
From historical data, Bitcoin indeed struggles to escape the shadow of the "September Curse."
However, the different scenarios presented by technical analysis are also worth noting: the key support area of $100,000 to $106,000, hidden bullish divergences, and the macro environment of a weakening dollar may collectively drive Bitcoin to achieve an unexpected rebound in September.
The market always seeks direction amid uncertainty. September may be a test for Bitcoin, but it is also an opportunity — volatility means risk, but it also means potential rewards.
免责声明:本文章仅代表作者个人观点,不代表本平台的立场和观点。本文章仅供信息分享,不构成对任何人的任何投资建议。用户与作者之间的任何争议,与本平台无关。如网页中刊载的文章或图片涉及侵权,请提供相关的权利证明和身份证明发送邮件到support@aicoin.com,本平台相关工作人员将会进行核查。


