Author: Proton Capital Research Team
As we enter the third quarter of 2025, the digital asset market is at a critical turning point. Bitcoin has played the role of a "risk asset anchor" in past cycles, but its dominance is gradually weakening. We firmly believe that Ethereum is taking over from Bitcoin to become the dominant force in the second half of the bull market.
In the short term, the current market adjustment is more a result of seasonal factors and macro uncertainties rather than a trend reversal. The Federal Reserve's mild signals at the central bank annual meeting provide marginal support for risk assets; meanwhile, the Treasury's trillion-dollar financing plan and low overnight reverse repurchase agreement balances indicate that dollar liquidity still faces certain pressures. This pattern of "policy moderation coexisting with liquidity tightening" has led the market into a "halftime" phase.
More critically, the baton for the second half has been passed to Ethereum. Whether it is capital inflows, on-chain capital accumulation, derivatives market structure, or policies regarding stablecoin legislation and financial on-chain initiatives, all signals are gradually converging. For investors, this is not just a switch in asset prices but a re-pricing process of capital logic and institutional dividends. For retail investors, this means that Bitcoin's high-growth period is essentially over, while Ethereum is opening a new window for wealth accumulation; for institutions, ETH is not only a type of asset in the crypto market but also the core foundation for stablecoins, RWA, and compliant financial infrastructure. Whether to timely allocate ETH will determine the performance differentiation in the coming years. In other words, Ethereum's rise is related to the reconstruction of the entire crypto financial landscape.
In this context, we provide a mid-term benchmark price forecast: by the end of 2025, the target price for BTC is $130,000, and for ETH, it is $11,000.
Halftime Break - Macro Disturbances
Recently, the market has experienced a certain degree of adjustment, which is not uncommon in seasonal patterns. Summer is typically a low point for trading activity, with traders in major markets in Europe and the U.S. on vacation, combined with macro policy uncertainties, leading to overall liquidity being relatively scarce and risk appetite naturally becoming cautious. In this context, the market's reaction to short-term news has been amplified, resulting in increased price volatility.
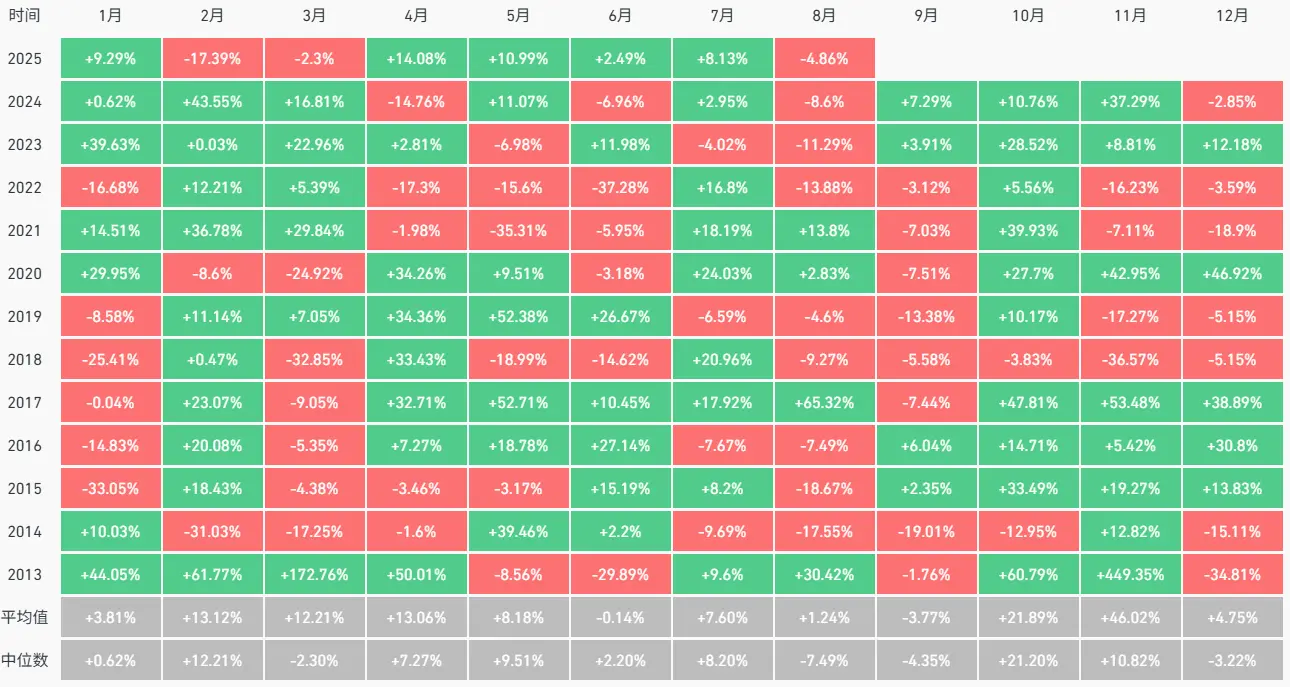
Figure 1. BTC Seasonal Performance (Source: Coinglass)
From a macro perspective, the oscillation of investor expectations regarding the Federal Reserve's interest rate cuts has become the core driving factor for recent price fluctuations. Notably, at the central bank annual meeting held at the end of August, Chairman Powell released relatively mild signals, suggesting that the Federal Reserve may gradually shift towards a more accommodative policy stance based on an assessment of economic and inflation progress. This statement has somewhat alleviated market concerns about excessive tightening of monetary policy and provided marginal positive support for risk assets.
However, contrasting with the mild shift in monetary policy is the liquidity pressure brought about by the Treasury's financing operations. According to the U.S. Treasury's Q3 financing plan, the expected financing scale for the third quarter will reach $1 trillion. Assuming the TGA balance increases to $850 billion by the end of September (currently at $526 billion), the market will inevitably need to absorb a large amount of new Treasury bond issuance. Meanwhile, the overnight reverse repurchase (ON RRP) account balance, acting as a "reservoir of excess liquidity," has dropped to a historical low of less than $40 billion. In this environment, the Treasury's bond issuance siphoning effect may partially offset the positive impact brought about by the Federal Reserve's shift in policy stance, posing short-term pressure on the dollar funding market.
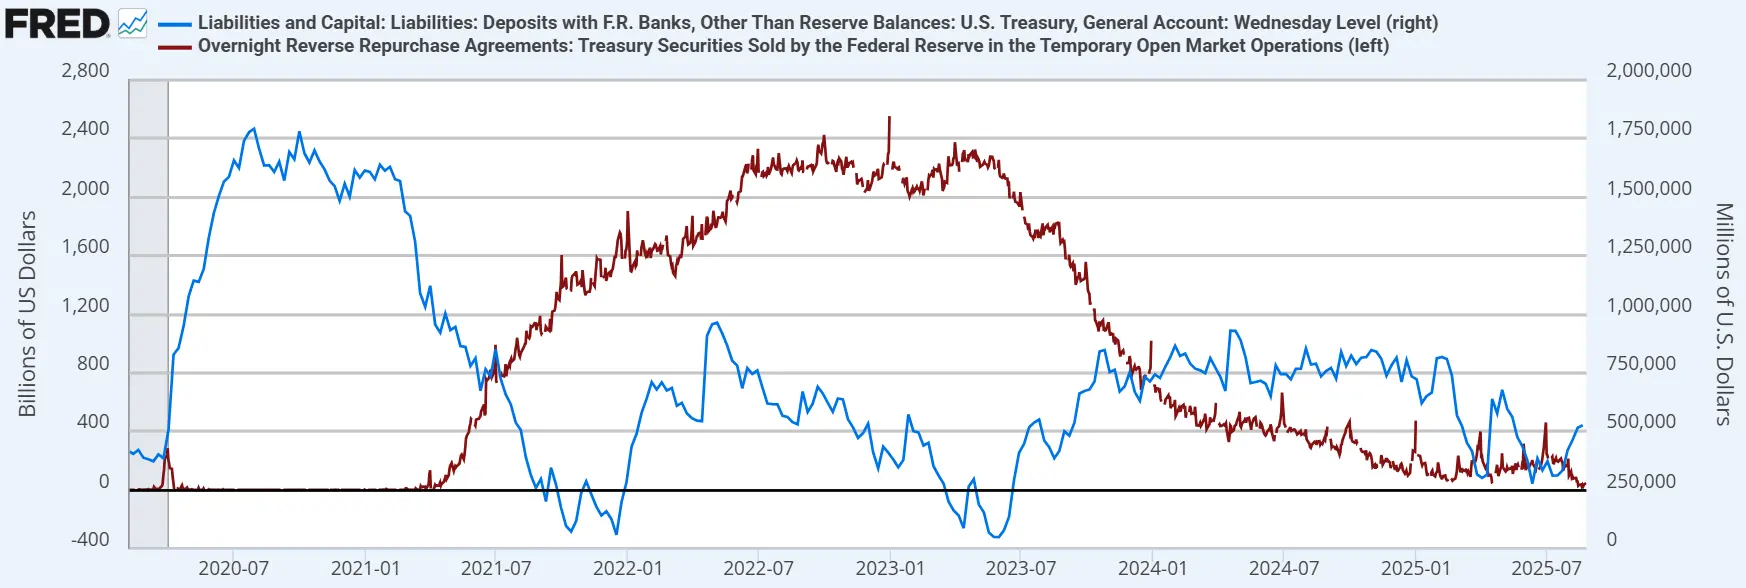
Figure 2. U.S. Treasury TGA Account Balance and Overnight Reverse Repurchase Account Balance (Source: FRED)
Despite the mixed signals at the macro level, we firmly believe that this resembles a "halftime break" in a bull market rather than a trend reversal. First, from the long-term market indicators we track internally, BTC currently does not exhibit the characteristic signals corresponding to historical peaks, and the market structure is still some distance from a cyclical top. Second, the overall policy path of the Federal Reserve remains accommodative, and the probability of a "soft landing" for the U.S. economy is rising, providing solid support for maintaining a medium- to long-term upward trend in risk assets. In other words, while short-term macro disturbances may bring volatility, they do not alter the fundamental logic of the continuation of the bull market.
Market Structure Signals: BTC Retreats, ETH Rises
BTC.D has decreased from 66% in June 2025 to about 59% currently, which typically indicates that the bull market may be entering its second half from the perspective of traditional four-year cycles. ETH will take the baton and lead the market, and the overall market performance from July to August 2025 corroborates this view. Although the market has slightly retreated this week, it is merely a halftime break, and ETH is expected to continue its strong performance after a brief adjustment.
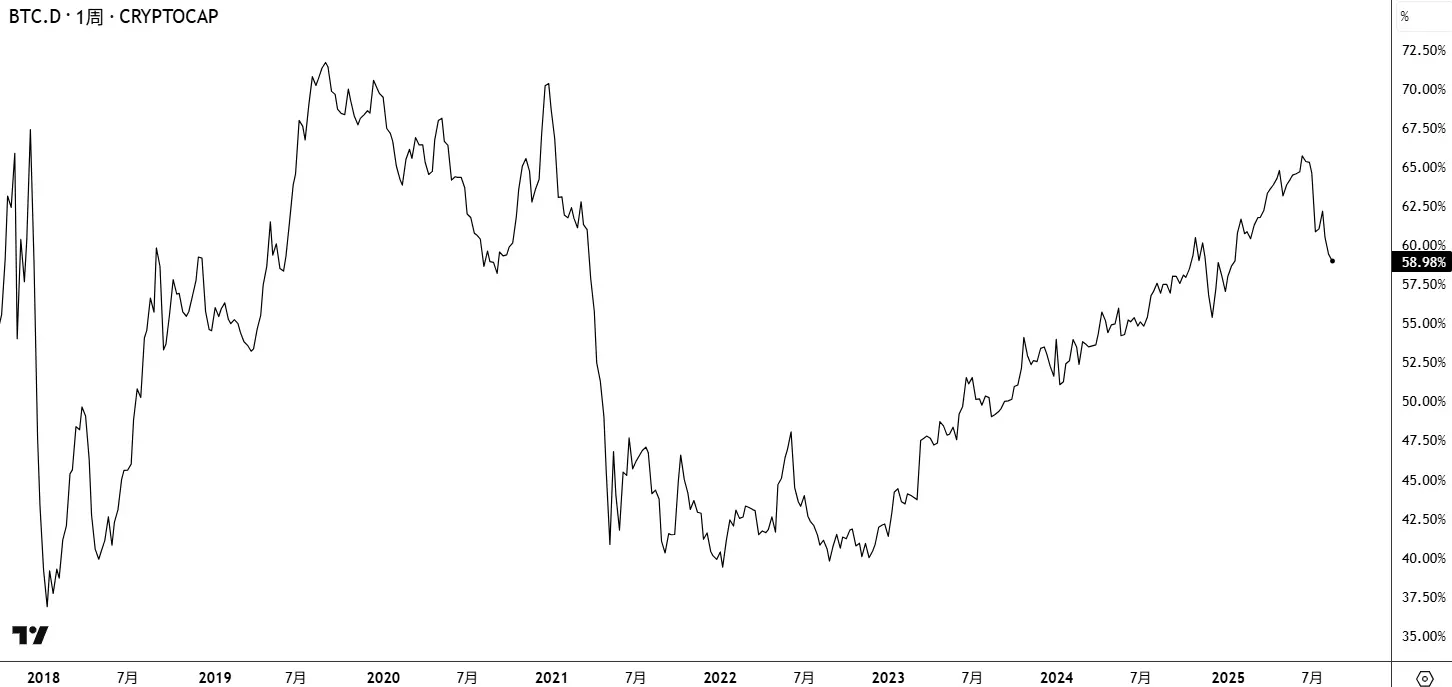
Figure 3. BTC.D Weekly Chart (Source: Tradingview)
The ETH/BTC price ratio has officially broken through the 60-week moving average on the weekly chart, confirming the end of the price bear market since 2022. In terms of the price ratio's position, we are still in the early stages of returning to historical averages, and market consensus is just beginning to form. After significant adjustments in regulatory policies, holding structures, and chip structures over the past few months, as more actual policies are implemented, ETH will enter the next phase: value discovery.
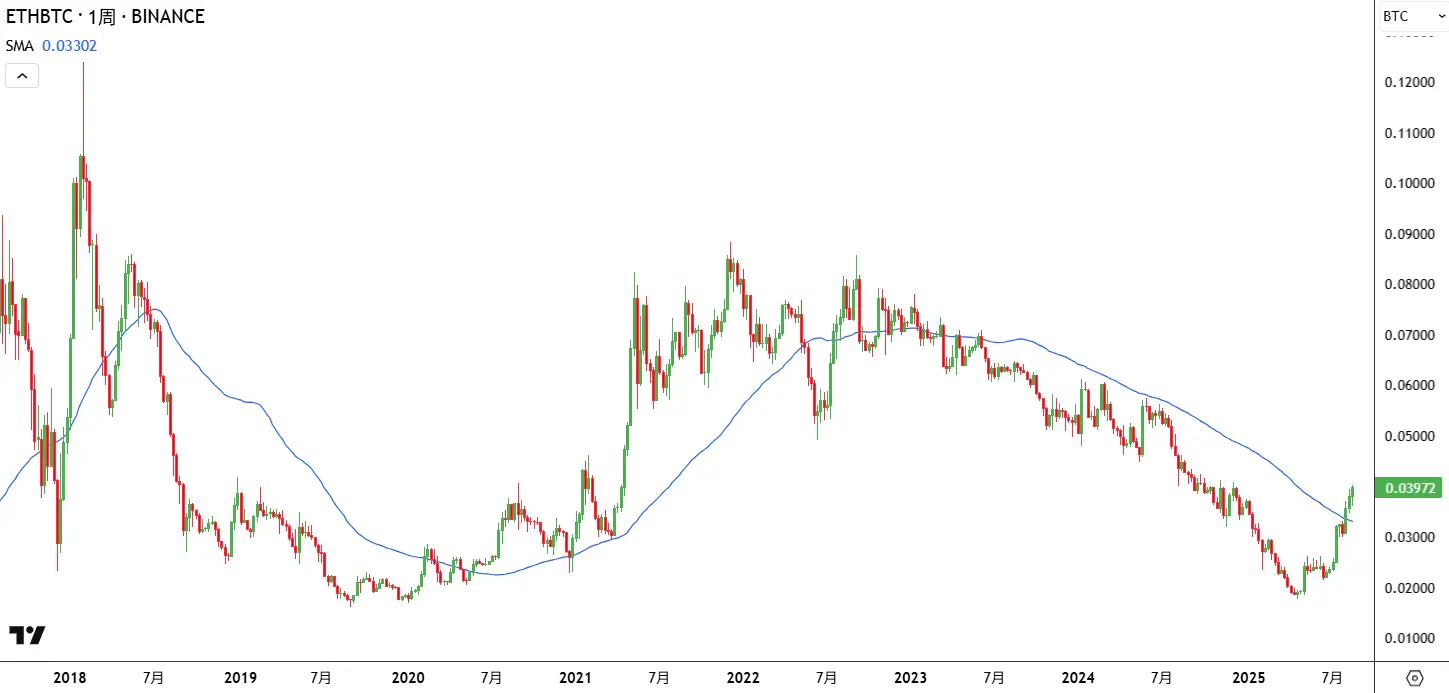
Figure 4. ETH/BTC Weekly Chart (Source: Tradingview)
Exchange Liquidity Changes
Observing exchange data, we can see that the supply structure of ETH is undergoing changes similar to those that BTC once experienced. Over the past two months, the stock of ETH on exchanges has continuously hit historical lows, indicating that selling liquidity is rapidly decreasing. This process was previously seen during BTC's bull market and ultimately led to supply tightening and accelerated price increases. Since July 1, the influx of institutional funds has become a key driver of the decline in exchange balances: publicly listed companies represented by BMNR have cumulatively purchased 2.9 million ETH (approximately $13 billion); ETFs have added 2.22 million ETH during the same period. This indicates that institutional buying is rapidly changing the liquidity landscape of ETH. As more funds shift towards long-term locking (corporate treasuries, ETFs, staking), the circulating supply will further contract, and this tightening on the supply side will have a significant marginal impact on prices.
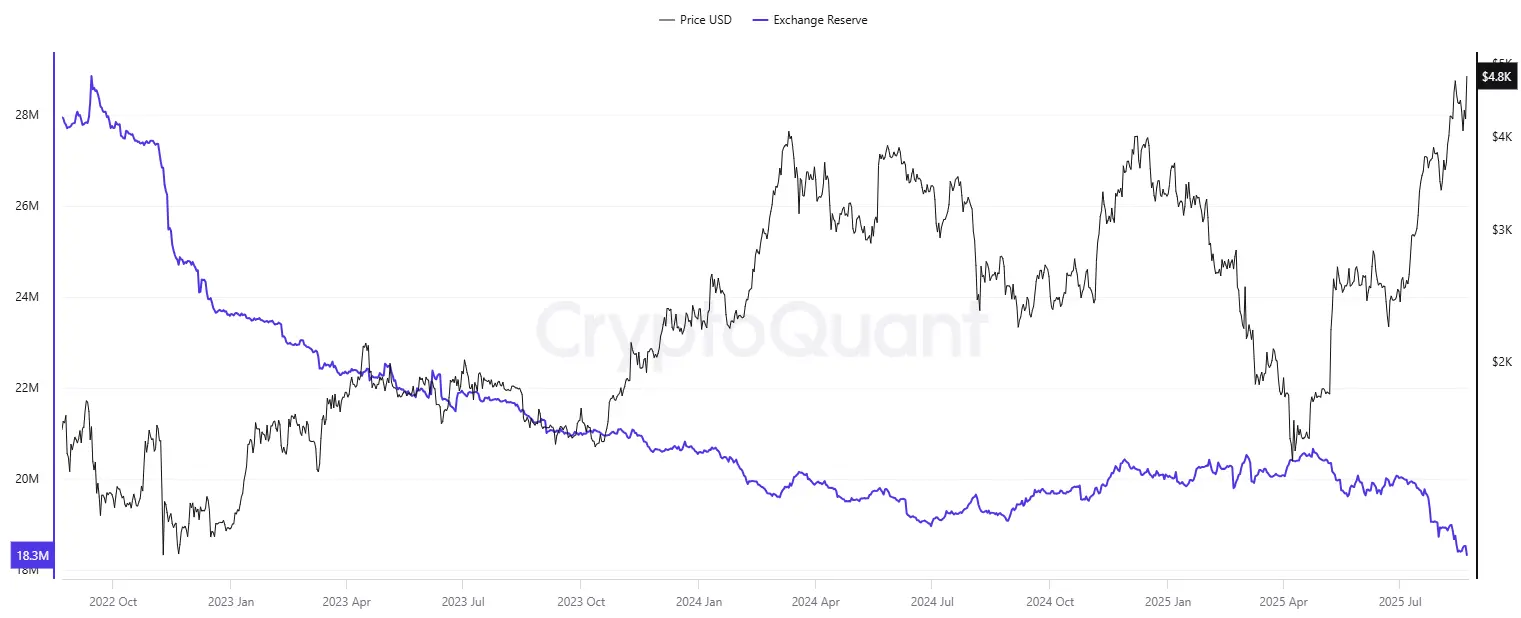
Figure 5. ETH Exchange Balance (Source: CryptoQuant)
Institutional Holding Structure: Significant Incremental Space Remains
Currently, the overall institutional penetration rate of ETH is 8.74% (ETF holdings 5.34% + corporate treasury 3.40%), which is still significantly lower than BTC's 10.89%. In other words, if the institutional holding ratio of ETH aligns with that of BTC, there is at least a passive incremental demand for 2.6 million ETH in the market. This gap not only indicates that the current level of institutionalization of ETH is still in its early stages but also suggests that there is considerable room for catching up in the future.
At the same time, the potential launch of staking ETFs and the expected entry of long-term funds such as pensions (e.g., 401(k)) will become new driving forces for institutional buying in the future. Combined with the supply contraction effect brought about by ETH's own staking mechanism, it can be expected that institutional funds will continue to play a dominant role in the ETH ecosystem in the future.
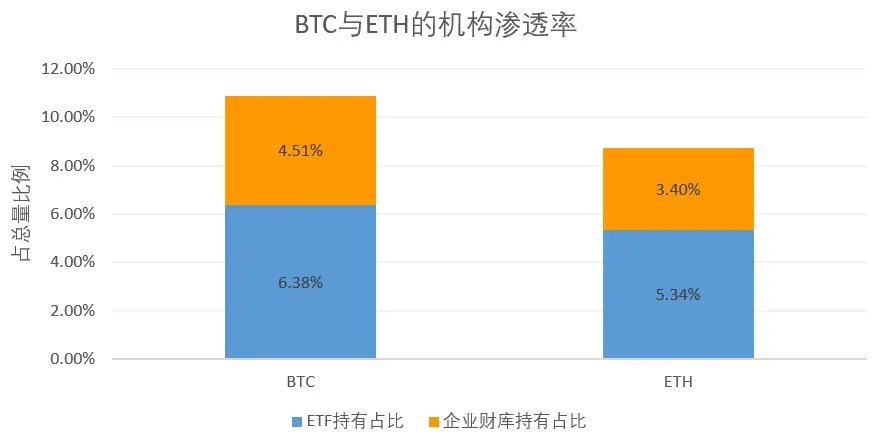
Figure 6. Institutional Holding Proportions of BTC and ETH
Derivatives Market: Leverage and Liquidity are Migrating
The structural changes in the derivatives market also clearly point towards ETH. According to Glassnode data, the trading volume of ETH perpetual contracts has recently surged. The trading volume of ETH perpetual contracts relative to BTC has reached a historical high of 67%, which also indicates that market speculation interest in altcoins is rising. Another data point—open interest in perpetual contracts—shows that ETH's dominance is also rapidly increasing and approaching BTC, currently nearing 45%. For the entire market, the total open interest of major altcoins (ETH, SOL, XRP, and DOGE) has recently reached a new high of $60.2 billion, indicating that market risk appetite and capital flow are comprehensively shifting. This means that in terms of capital allocation, ETH has become the core target for market risk pricing and speculative activities, while BTC plays more of a "value anchor" role.
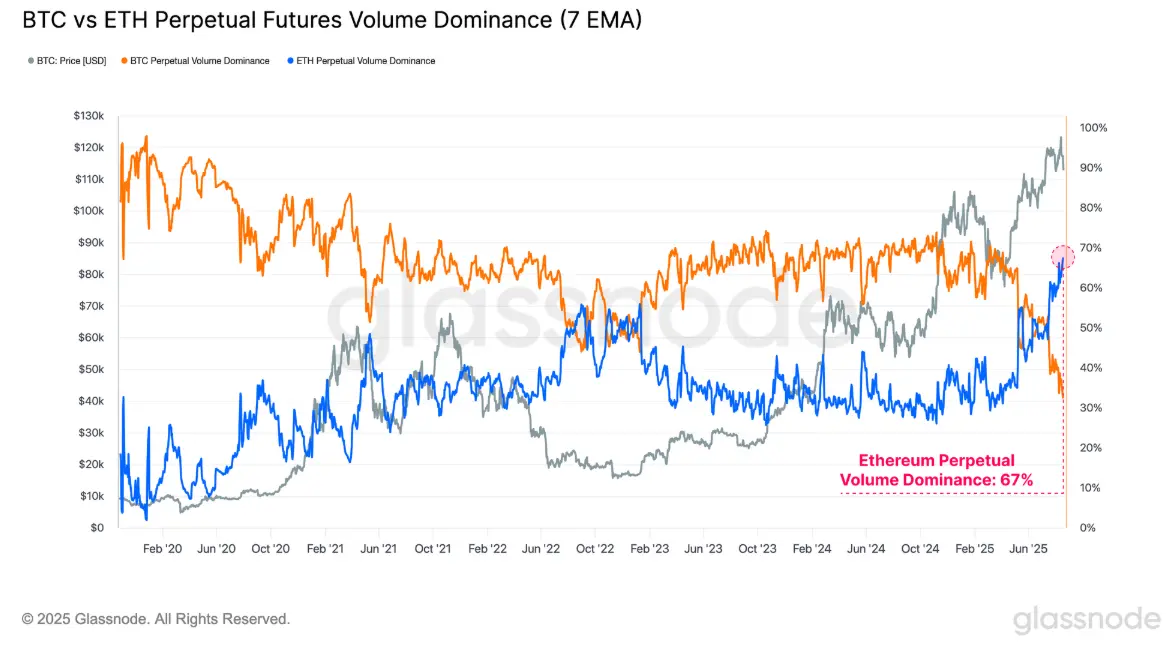
Figure 7. Dominance of BTC and ETH Perpetual Contract Trading Volume (Source: Glassnode)
On-Chain Data: Real Capital Inflow
From the perspective of on-chain capital accumulation, ETH's performance also surpasses that of other mainstream assets. Realized Cap is an important indicator for measuring real capital inflow on-chain, calculated by summing the value of each token based on its last on-chain transfer price. As of August, ETH's Realized Cap has maintained a stable and rapid growth trend since July, while BTC and SOL have shown sideways or declining performance. This indicates that the process of capital accumulation on-chain is clearly leaning towards ETH. This not only means a larger scale of capital inflow but, more importantly, reflects that these funds represent an accumulation of "real costs," indicating that ETH's position in investors' asset allocation is systematically rising.
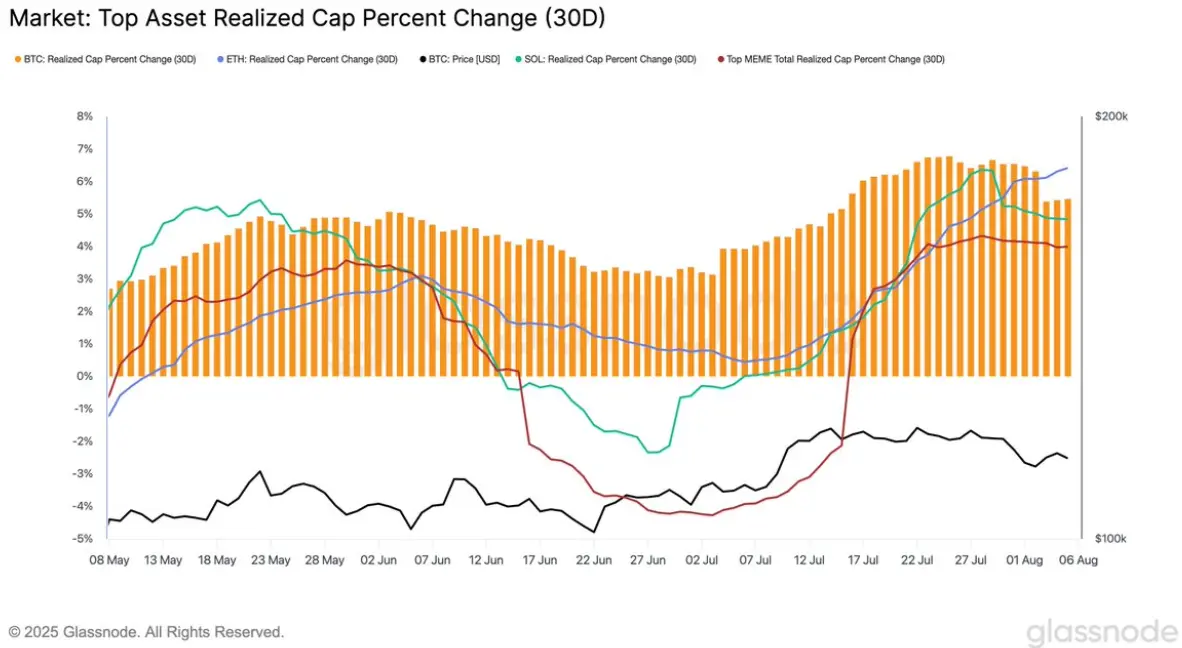
Figure 8. Realized Market Capitalization of Major Crypto Assets (Source: Glassnode)
Policies and Narratives: Accelerated Release of Institutional Dividends
Recent policies and narratives have also injected strong momentum into the medium- to long-term development of Ethereum. In July 2025, the United States officially passed the GENIUS Act, the first federal legislative framework for stablecoins. This bill not only clarifies compliance requirements for issuance, reserves, and audits but also provides institutional guarantees for the long-term development of dollar-pegged stablecoins. As regulatory uncertainties gradually diminish, market confidence has significantly improved. Considering that currently over half of stablecoin issuance is on the Ethereum network, we expect the total market capitalization of stablecoins to further expand to nearly the trillion-dollar level, with Ethereum being the most direct beneficiary.
At the same time, the progress in scaling the Ethereum network is providing practical support for this narrative. Benefiting from the rapid development of layer two networks, Ethereum's daily transaction volume recently hit a new high, while Gas fees remain relatively low. This not only ensures the network's scalability under high-intensity usage but also provides a stable operating environment for the future deployment of more application scenarios, especially for the large-scale use of on-chain financial assets and stablecoin payments.
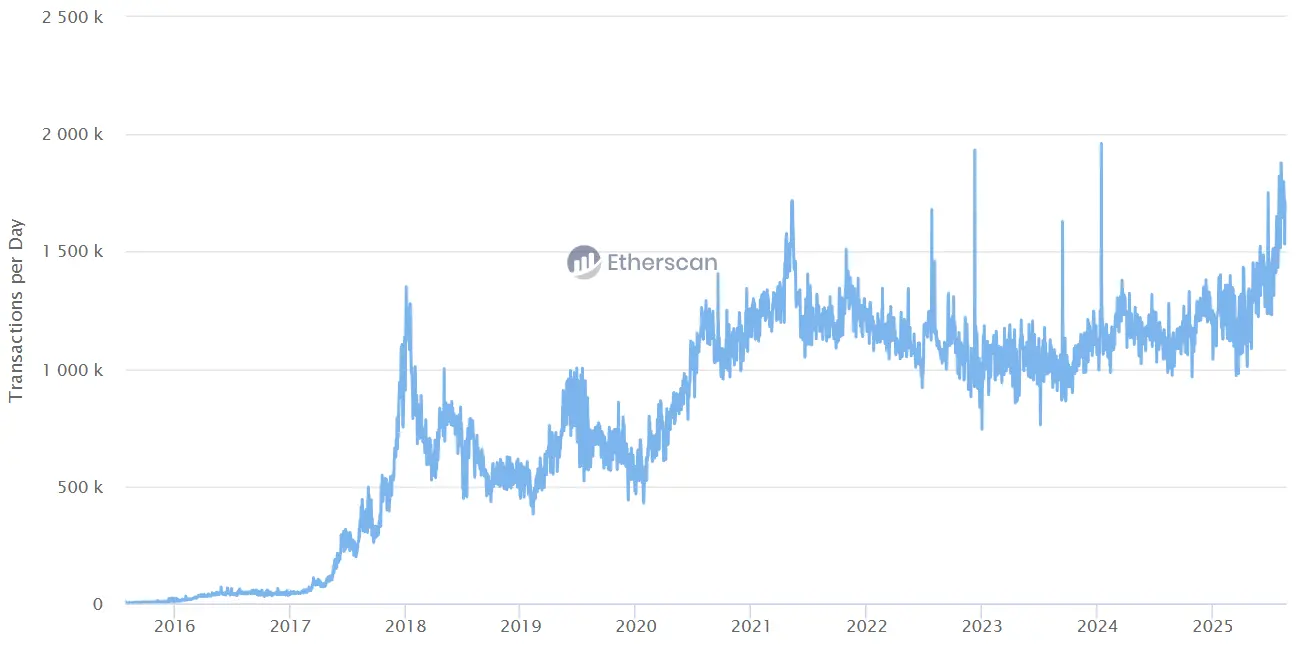
Figure 9. Daily Transaction Volume on the ETH Network (Source: Etherscan)
Another major catalyst on the policy front comes from the "Project Crypto" plan launched by the Trump administration in August 2025. The goal of this plan is to systematically revise existing securities laws and promote the gradual migration of capital markets to a blockchain environment. If implemented, this plan will effectively reduce compliance barriers between traditional finance and crypto finance, allowing the U.S. to establish capital market infrastructure for crypto assets ahead of the rest of the world. Such institutional dividends directly benefit real-world assets (RWA) and decentralized finance (DeFi) sectors. In fact, leading protocols in the ETH ecosystem, such as AAVE, ETHENA, and PENDLE, have recently seen accelerated growth in total locked value (TVL), reflecting a positive feedback loop of capital expectations regarding the regulatory environment.
From a longer-term perspective, if future pension channels like 401(k) allocate crypto assets, ETH is likely to become the only core asset that can be included alongside BTC. This means that, driven by both institutional and capital factors, Ethereum is not only maintaining its dominant position in terms of technology and ecosystem but is also gradually establishing its strategic position in the global financial market.
Conclusion
Considering market structure, capital flows, on-chain data, and the policy environment, our judgment is very clear: Ethereum is gradually taking over from Bitcoin to become the core asset in the second half of the bull market. Short-term fluctuations and corrections will not change the long-term trend; rather, they create a valuable window for capital reallocation.
From the perspective of investor structure, the market is shifting from a singular narrative around BTC to a diverse ecosystem around ETH, indicating that the next phase of wealth opportunities will be more concentrated in Ethereum. For funds, whether to timely establish and increase positions in ETH will directly determine their relative performance in industry competition over the next few years. Missing this phase may lead to a significant gap with peers. The role of ETH is transcending that of a single public chain; it is gradually becoming a core infrastructure deeply tied to stablecoins, RWA, and compliant financial markets, representing the inevitable direction of the financial system moving on-chain.
Therefore, we maintain our mid-term benchmark forecast: by the end of 2025, the target price for BTC is $130,000, while the ETH/BTC price ratio will further rise to 0.08, with a target price for ETH of $11,000. This is not just a price figure but a reflection of the evolution of market structure and the realization of institutional dividends. As capital continues to flow in, circulating supply is compressed, and the policy environment becomes clearer, the revaluation of ETH's value is just beginning. The stage for the second half has been set, and ETH will become the undisputed protagonist.
免责声明:本文章仅代表作者个人观点,不代表本平台的立场和观点。本文章仅供信息分享,不构成对任何人的任何投资建议。用户与作者之间的任何争议,与本平台无关。如网页中刊载的文章或图片涉及侵权,请提供相关的权利证明和身份证明发送邮件到support@aicoin.com,本平台相关工作人员将会进行核查。


