Cryptocurrency News
September 6 Hot Topics:
1. SOL Strategies has been approved to list on Nasdaq on September 9, with the stock code STKE.
2. The U.S. SEC and CFTC propose to promote 24/7 operation of U.S. financial markets.
3. The Senate Banking Committee updates the market structure draft, clarifying auxiliary assets, DePIN exemptions, and regulatory coordination mechanisms.
4. SharpLink plans to deploy part of its $3.6 billion Ethereum treasury to the Linea network, exploring diversified staking paths.
5. BITWISE AVALANCHE ETF has been registered in Delaware.
Trading Insights
Share 4 hidden K-line signals from market makers to avoid 50% of pitfalls!
False Breakout: The "Previous High Trap" set by market makers ① Characteristics: Price quickly falls back after reaching the previous high, with trading volume shrinking compared to the average of the previous 3 days (rather than increasing), akin to "hanging a false light" to lure buyers. ② Key Distinction: A true breakout requires volume and price to move in sync, with volume at least 1.5 times the average of the previous 3 days; a false breakout only "touches" the previous high, with weak volume.
Yin-Yang "Washing Pin": Market makers' emotional manipulation Core observation: At support levels (like MA60), the appearance of "Yin Pin + Yang Pin" signals a washout test of panic selling by market makers; at resistance levels (like previous highs), the appearance of "Yang Pin + Yin Pin," with the Yin Pin's volume increasing (like 2 times), indicates a lure for selling.
Long-term Sideways: Market makers' "Hawk Waiting" accumulation technique ① Misconception: Sideways movement is not without action; rather, it is a method for market makers to exhaust retail investors' patience, with direction often revealed at the end of the sideways phase. ② Technique: If sideways movement lasts over 15 days, the breakout will be stronger; a true breakout requires simultaneous volume and price increase, while a false breakout sees price rise with volume shrinking (market makers "drawing a door").
Sharp Top vs. Round Bottom: Market makers' "Selling" and "Accumulating" signals ① Sharp Top (Selling): A rapid rise and fall form a "sharp knife" shape, often accompanied by massive volume (trading volume exceeding 3 times the usual), leaving little time to exit. ② Round Bottom (Accumulating): A slow grind and rise form a "round pot" shape, requiring low volume (trading volume shrinking to below 50% of the average of the previous 3 months).
Final Reminder: K-lines are the "footprints" of market makers. While these patterns are not 100% accurate, mastering them can at least help avoid half of unnecessary losses. Now, open the K-line chart for comparison, and you may discover missed signals. The cryptocurrency market is a game of hunters and prey; understanding the "subtext" can help you avoid being harvested and take more initiative.
LIFE IS LIKE
A JOURNEY ▲
Below are the real trading signals from the Big White Community this week. Congratulations to those who followed along; if your trades are not going well, you can come and test the waters.
Data is real, and each trade has a screenshot from the time it was sent.
**Search for the public account: *Big White Talks About Coins*
BTC
Analysis
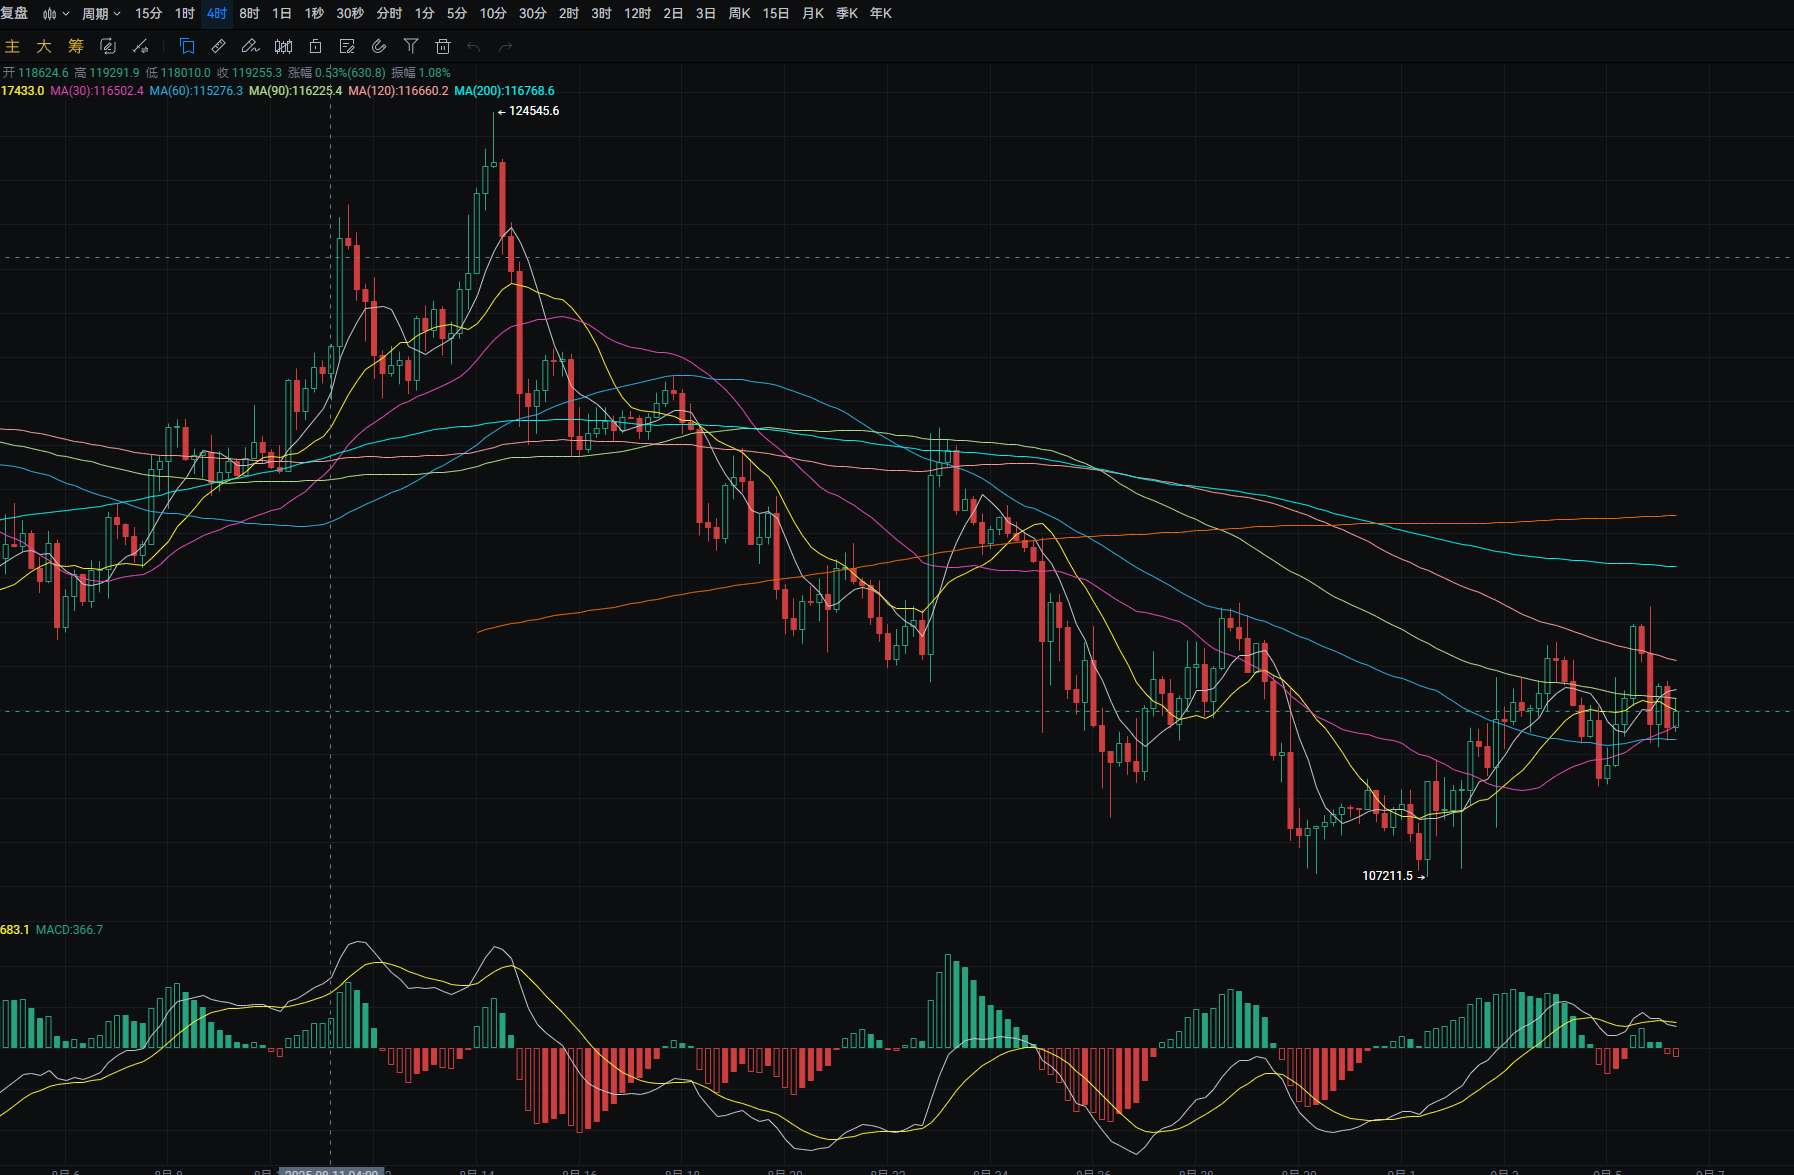
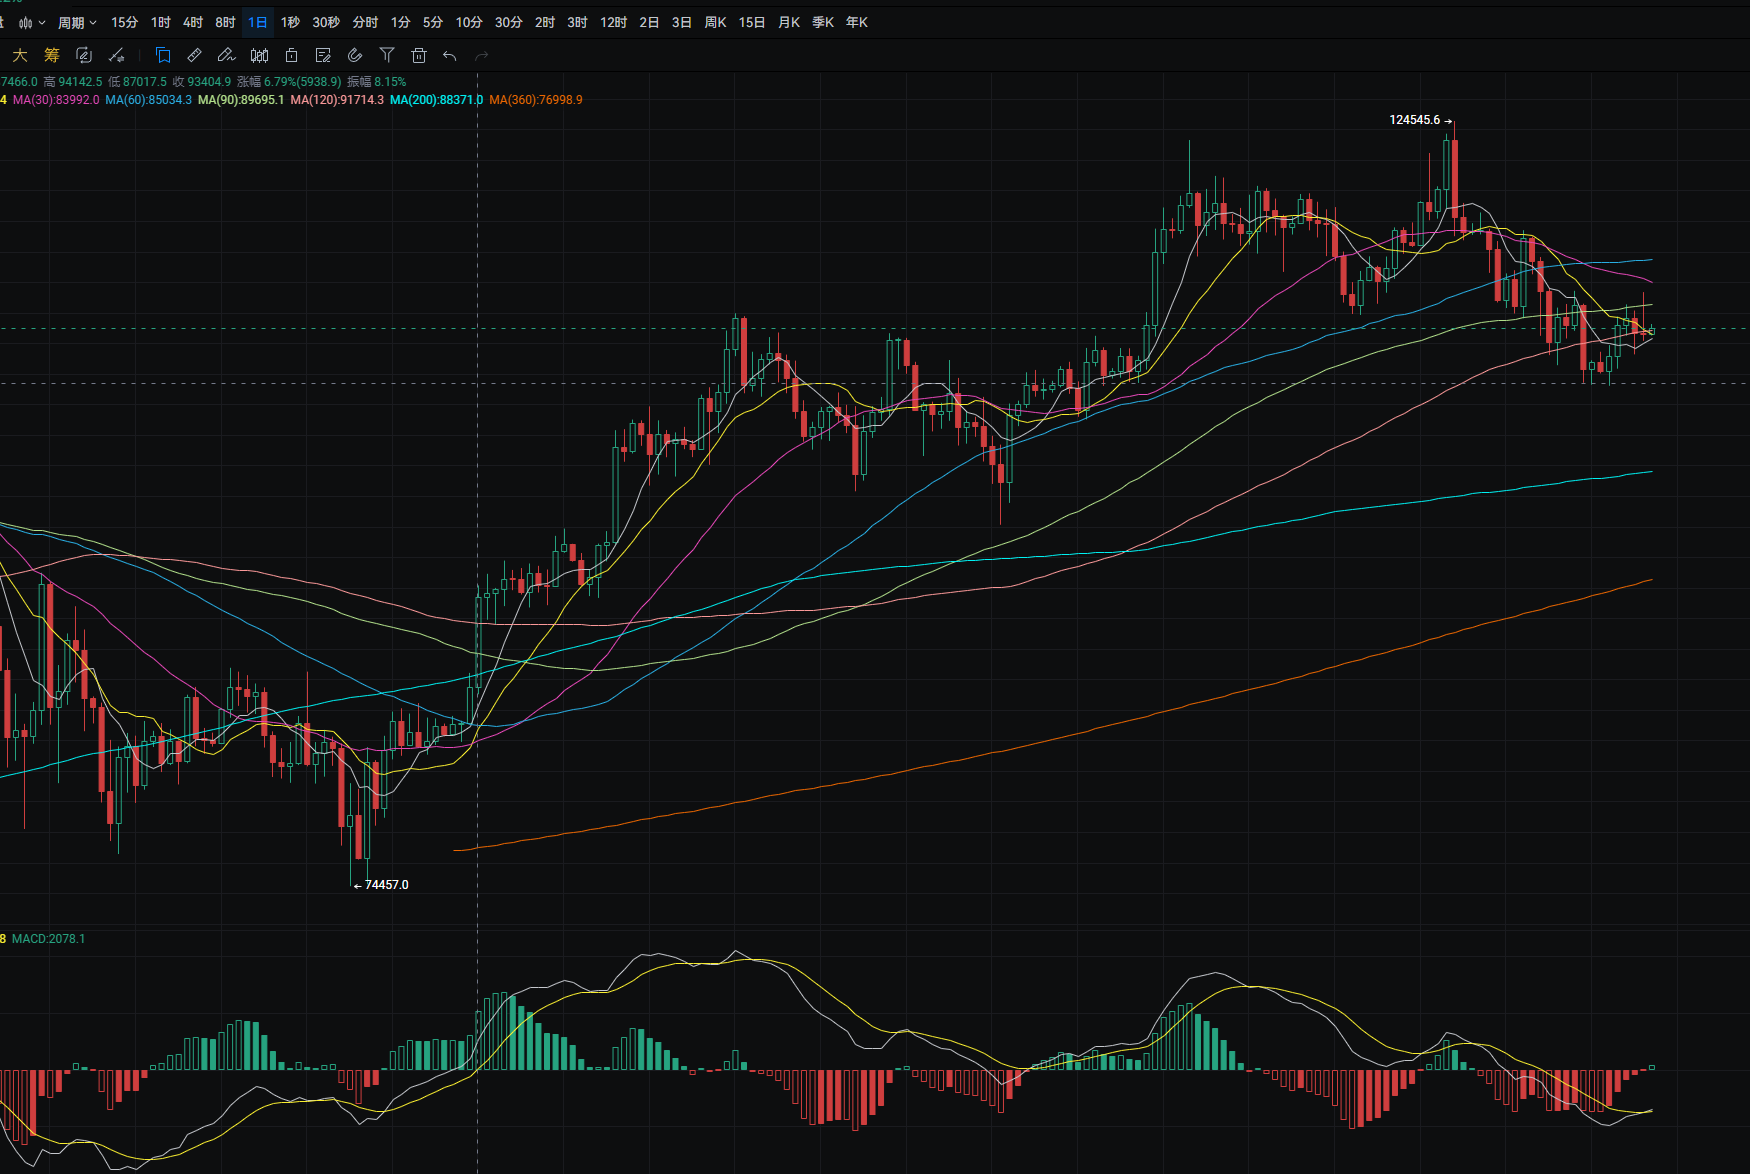
Bitcoin's daily line fell from a high of around 113,350 to a low of around 110,150 yesterday, closing around 110,600. The support level is around 108,250; if it breaks, it could drop to around 105,300. A pullback can be used to buy near this level. The resistance level is around MA90; if it breaks, it could rise to around MA60. A rebound near this level can be used to sell. MACD shows a decrease in bearish volume, indicating a potential golden cross formation. The four-hour support level is around MA60; if it breaks, it could drop to around 108,150. A pullback can be used to buy near this level. The resistance level is around MA120; if it breaks, it could rise to around MA200. A rebound near this level can be used to sell. MACD shows an increase in bearish volume, forming a death cross.
ETH
Analysis
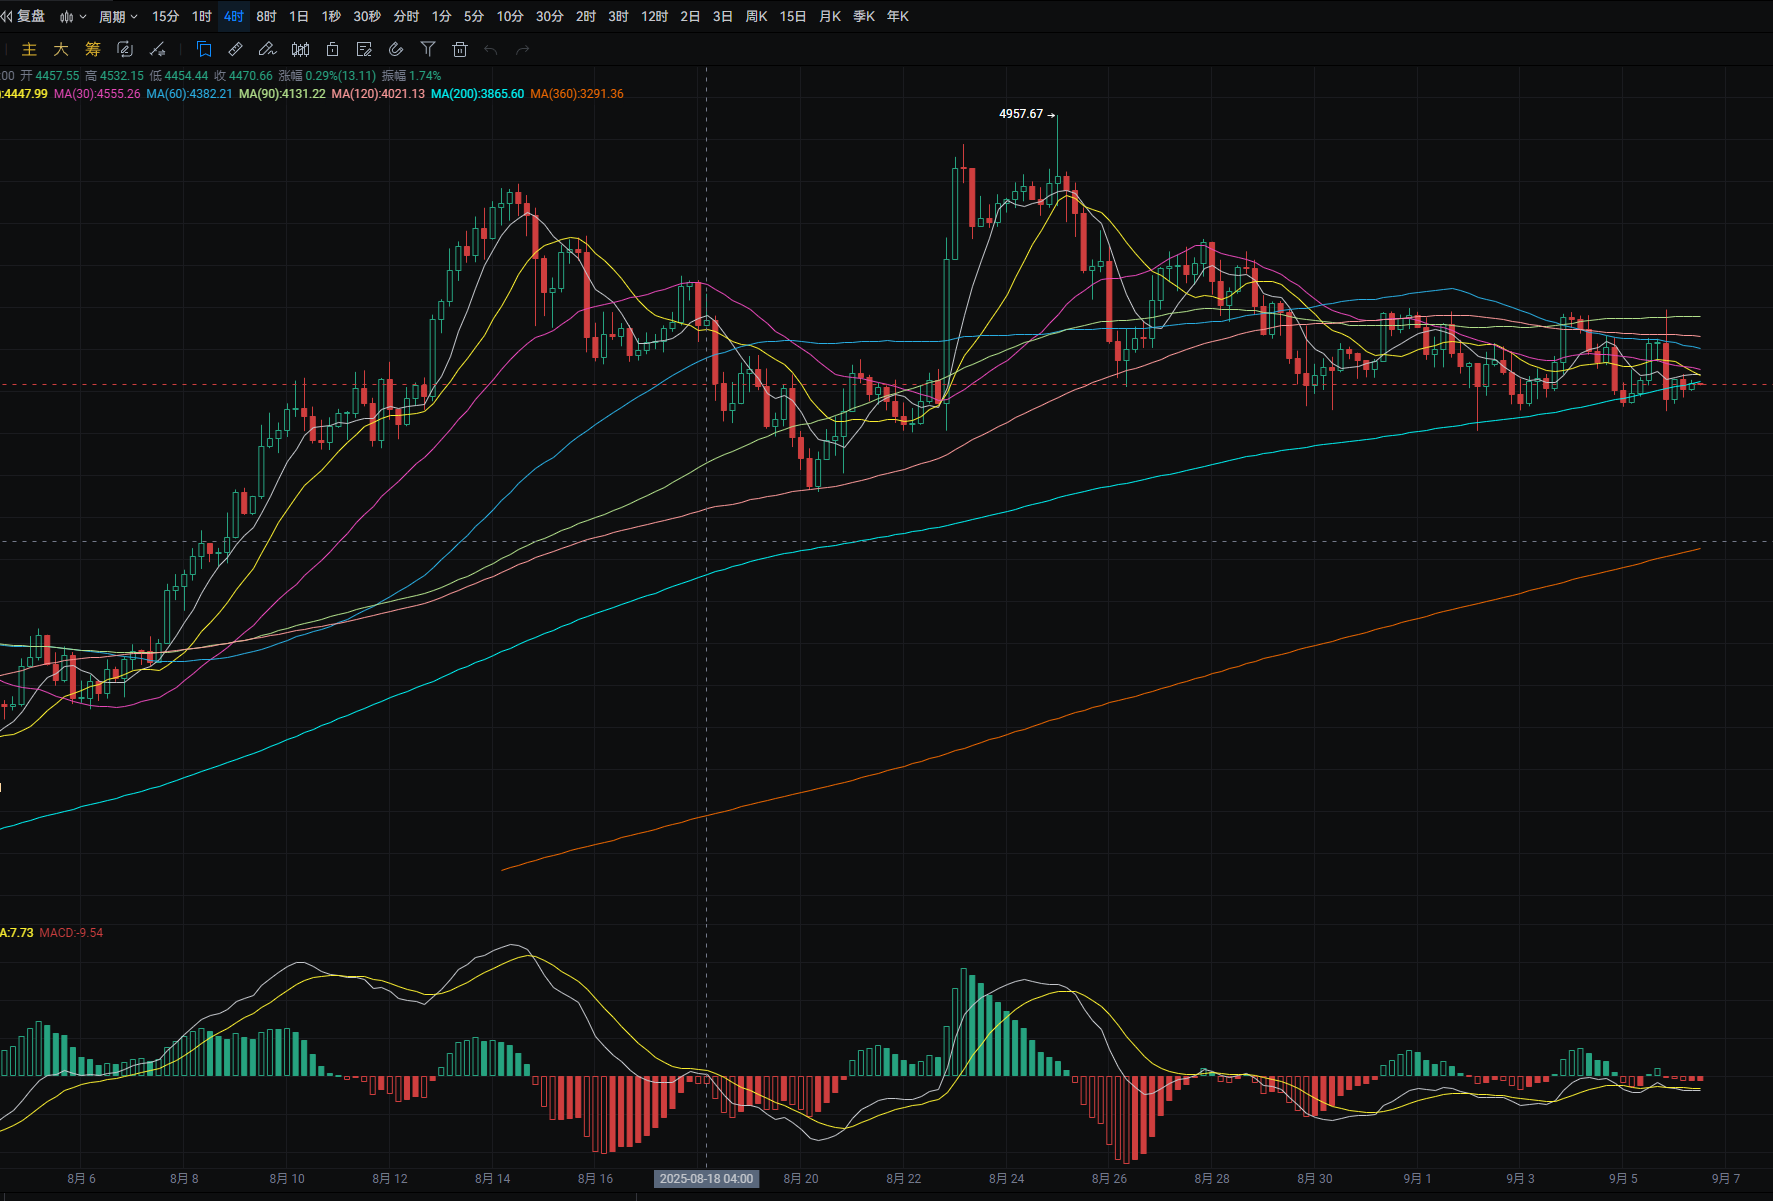
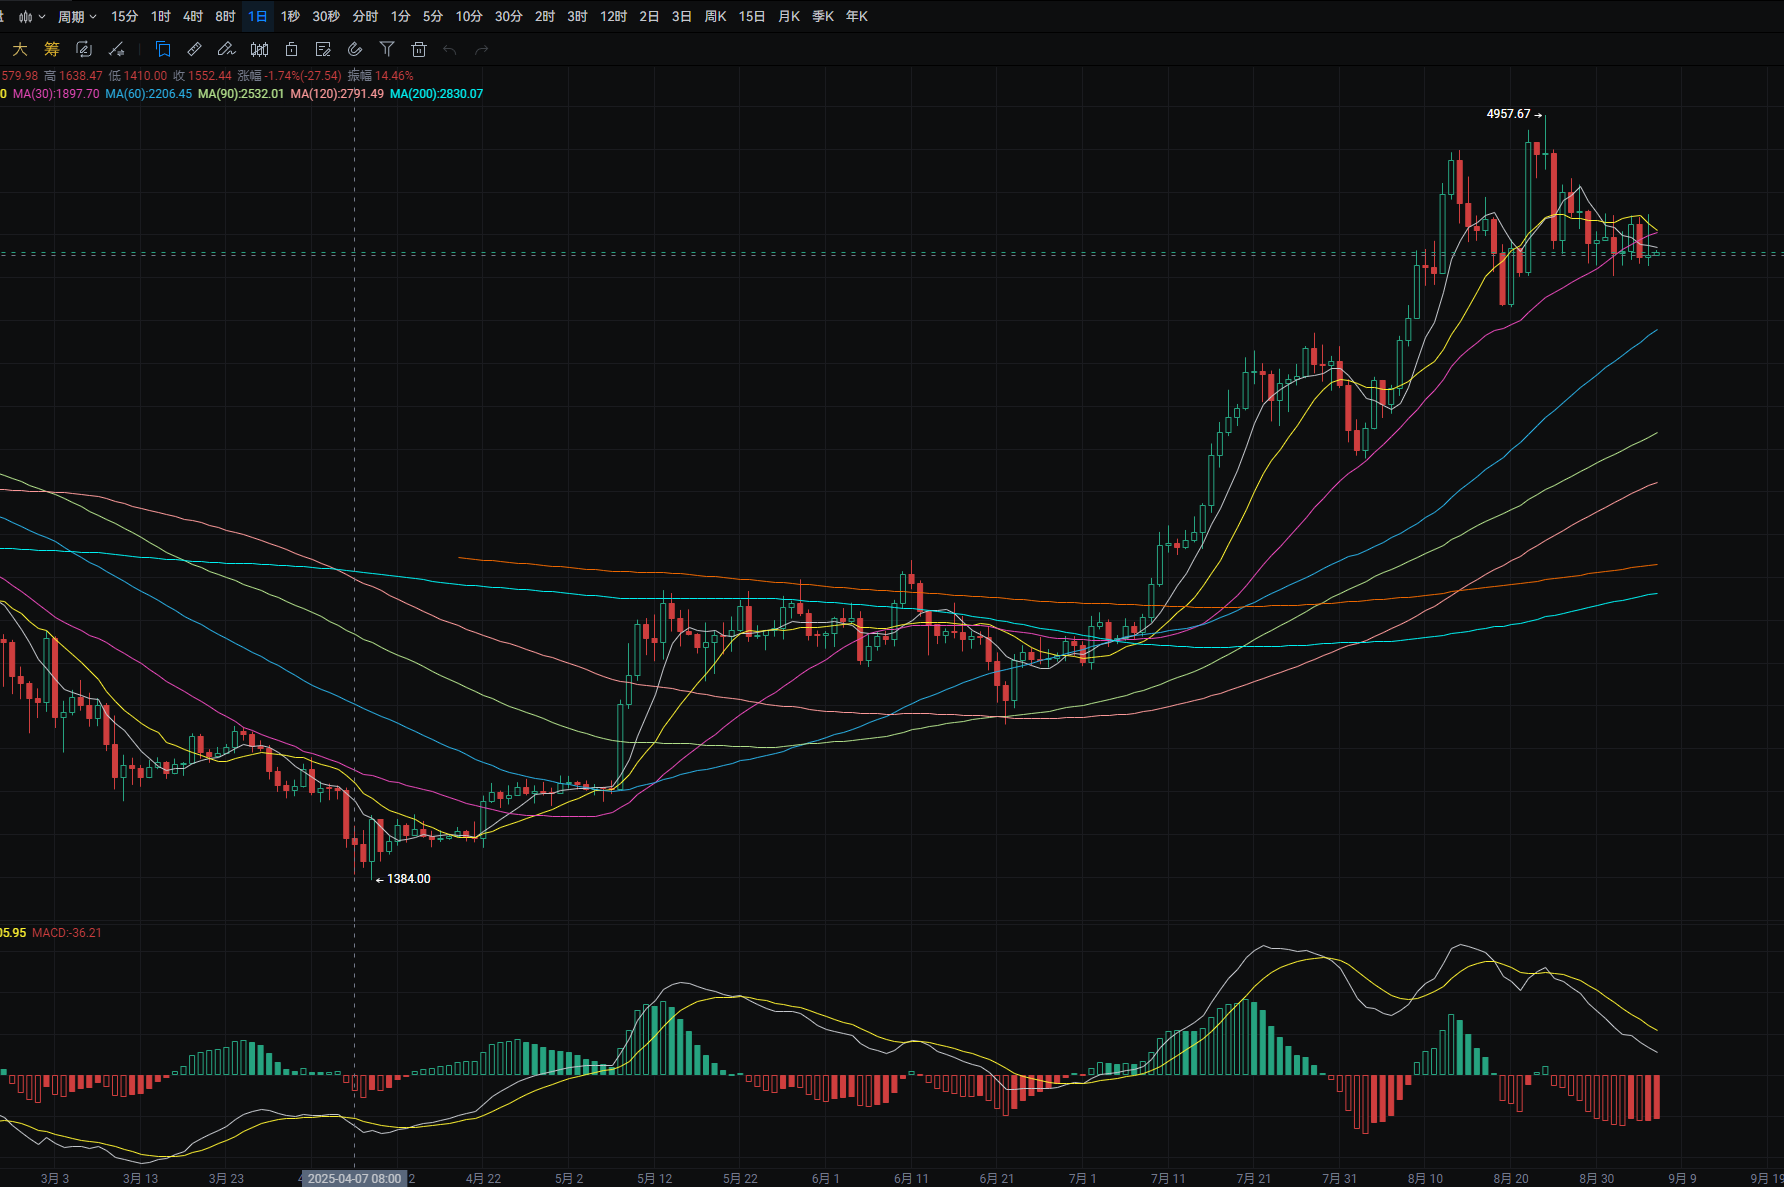
Ethereum's daily line rose from a low of around 4,250 to a high of around 4,495 yesterday, closing around 4,305. The support level is around 4,220; if it breaks, it could drop to around 4,070. A pullback can be used to buy near this level. The resistance level is around MA14; if it breaks, it could rise to around 4,590. A rebound near this level can be used to sell. MACD shows an increase in bearish volume. The four-hour support level is around 4,270; if it breaks, it could drop to around 4,140. A pullback can be used to buy near this level. The resistance level is around MA60; if it breaks, it could rise to around MA90. A rebound near this level can be used to sell. MACD shows an increase in bearish volume.
Disclaimer: The above content is personal opinion and for reference only! It does not constitute specific trading advice and does not bear legal responsibility. Market conditions change rapidly, and the article may have some lag; if you have any questions, feel free to consult.
免责声明:本文章仅代表作者个人观点,不代表本平台的立场和观点。本文章仅供信息分享,不构成对任何人的任何投资建议。用户与作者之间的任何争议,与本平台无关。如网页中刊载的文章或图片涉及侵权,请提供相关的权利证明和身份证明发送邮件到support@aicoin.com,本平台相关工作人员将会进行核查。


