【Price Trend Analysis】
- K-line Pattern:
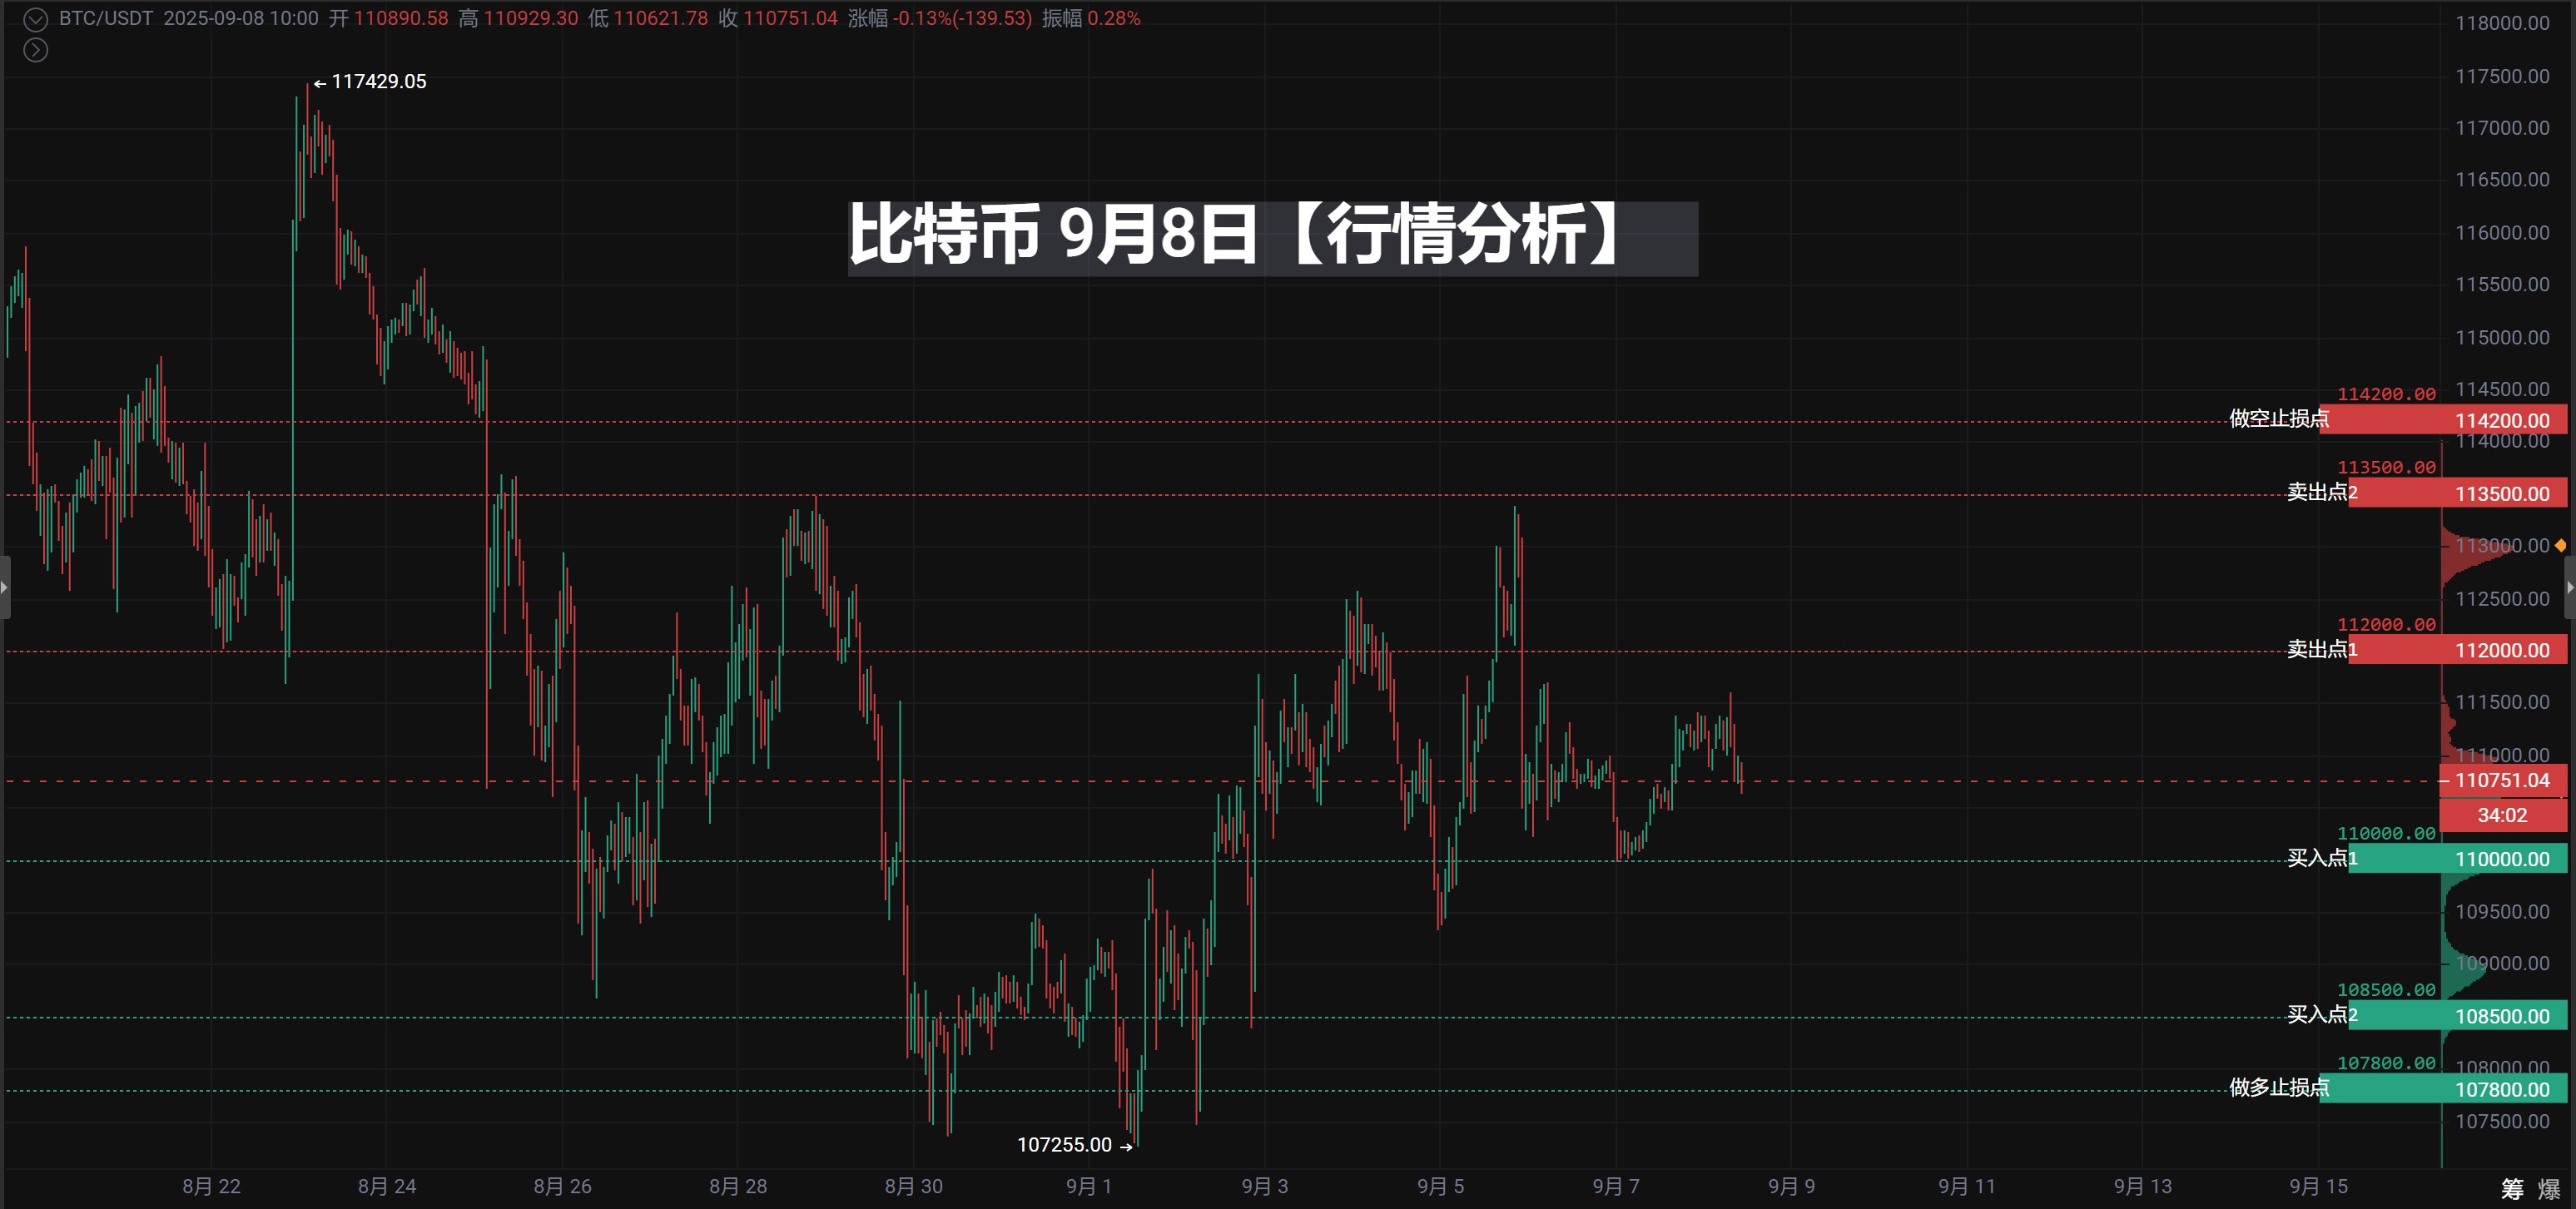
The daily level shows that recent prices are oscillating at a high level, with a long upper shadow appearing on September 5, indicating strong selling pressure above. In the following days, the closing price gradually declined, forming a short-term correction trend.
At the 4-hour level, the price began to rebound after a sharp drop on September 6, but the rebound strength weakened, and it is currently in a consolidation phase.
Technical Indicators:
MACD: The 4-hour MACD histogram has turned from red to green, and the DIF and DEA are close to the zero axis, indicating weakened momentum; the daily MACD remains in the bearish zone, with no significant bullish divergence signals observed.
RSI: The 4-hour RSI hovers around 50, showing a neutral market sentiment; the daily RSI has slightly declined but has not entered the oversold zone.
EMA: The 4-hour EMA7 and EMA30 are converging, with prices fluctuating around EMA120, indicating an unclear short-term direction; the daily EMA shows a bearish arrangement, with EMA7 crossing below EMA30.
Trading Volume:
The daily trading volume has generally shrunk, especially from September 6 to 8, indicating reduced market participation.
The 4-hour trading volume expanded during the sharp drop on September 6 and then gradually decreased, showing a strong wait-and-see sentiment among investors.
Trading Strategy Analysis and Optimization Suggestions
Technical Point Evaluation
Operation Direction
Price Level (USDT)
Technical Basis
Risk Assessment
Suggested Position
Buy Point One
110,000
Integer level + previous low support + EMA120
⭐⭐⭐☆☆
40% of funds
Buy Point Two
108,500
Low point after the sharp drop + volume support
⭐⭐⭐⭐⭐
60% of funds
Long Stop Loss
107,800
Key support break
⭐⭐⭐⭐☆
Strict execution
Sell/Take Profit One
112,000
Integer pressure + oscillation high point
⭐⭐⭐☆☆
Reduce by 50%
Sell/Take Profit Two
113,500
Previous high resistance area
⭐⭐⭐⭐⭐
Close all positions
Short Stop Loss
114,200
Trend continuation confirmation
⭐⭐⭐⭐☆
Light position operation
Execution Strategy Suggestions
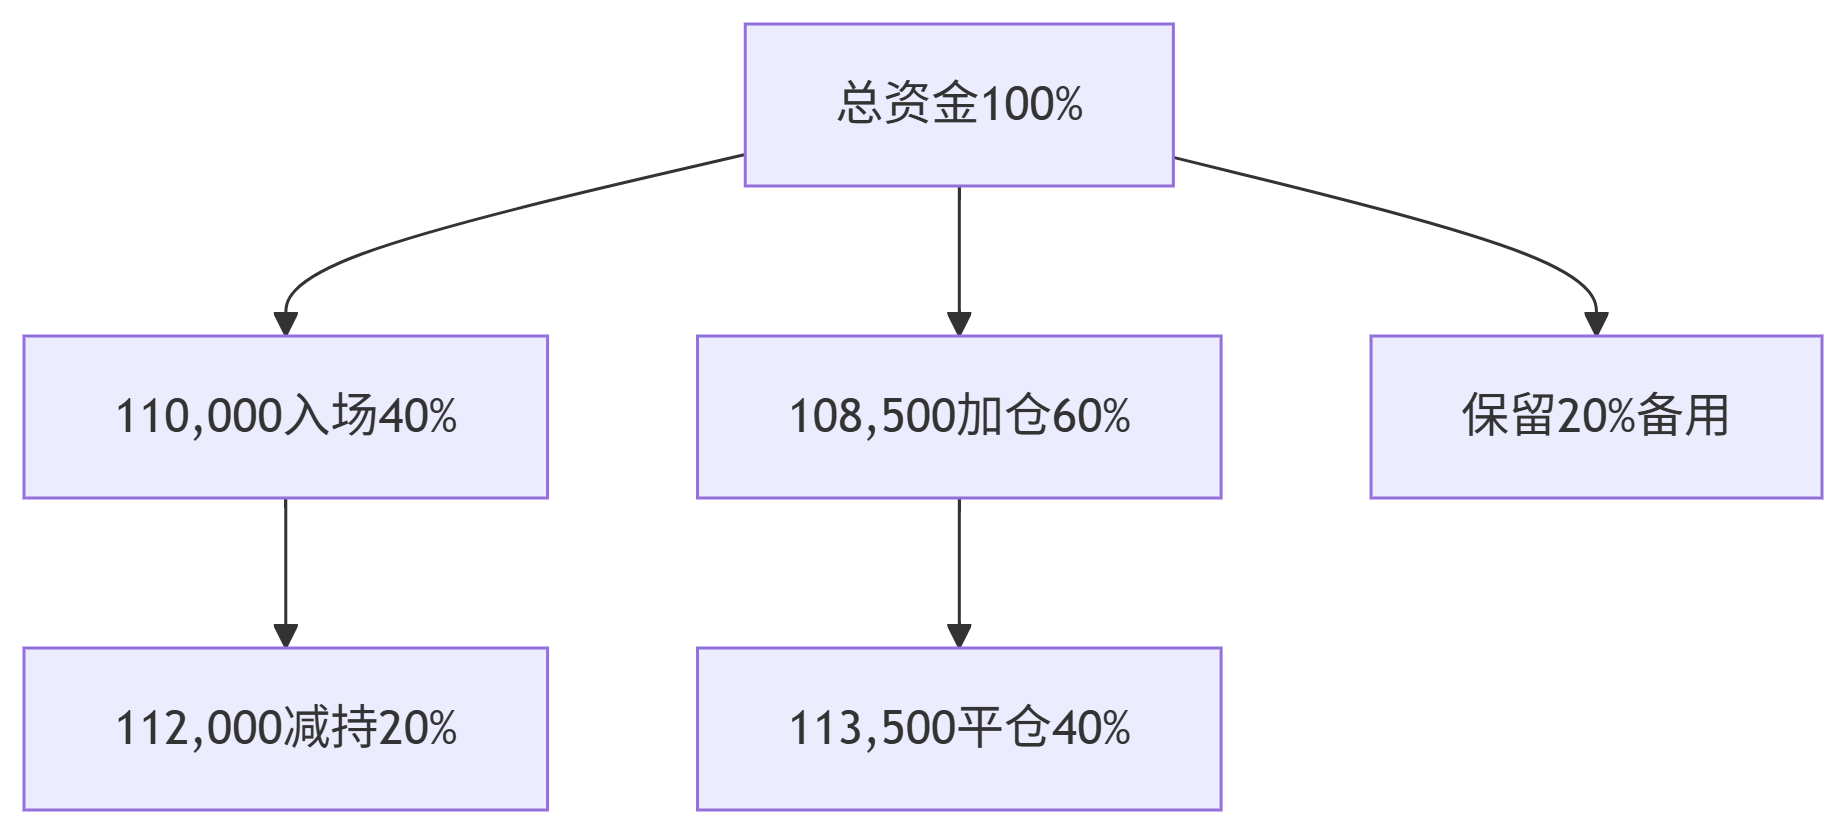
- Position Management Plan
Key Technical Level Analysis
Support at 108,500: Low point after the sharp drop on September 5, has historical reference value
Resistance at 112,000: Integer level + recent oscillation high point, important psychological resistance level
Strong resistance at 113,500: Near the previous wave high point of 113,384, with strong technical resistance
Risk-Reward Ratio Calculation
Long Strategy: Risk of 1,500 points, potential return of 3,500 points, risk-reward ratio of 1:2.33
Short Strategy: Risk of 700 points, potential return of 1,500 points, risk-reward ratio of 1:2.14
Optimization Suggestions
Entry Timing Optimization
Wait for a bullish reversal K-line pattern near 110,000
Observe volume expansion confirmation near 108,500
Use RSI oversold signals as auxiliary judgment
Take Profit Strategy Adjustment
It is recommended to reduce positions by 50% at 112,000
Take all profits on the remaining position at 113,500
Consider using trailing stop losses to protect profits
Alternative Plan Preparation
If it directly breaks through 114,200, consider going long
If it breaks below 107,800, consider lightly shorting
Reserve 20% of funds to deal with unexpected situations
Risk Warning
Main Risk Points
Market sentiment is weak after the sharp drop
The effectiveness of integer level support needs to be verified
Impact from sudden news
Risk Control Measures
Control the risk of a single trade within 2% of total funds
Set both hard stop losses and psychological stop losses as double insurance
Avoid heavy positions before the release of important data
Summary
This trading plan has the following advantages: ✅ Reasonable selection of support and resistance levels ✅ Moderate risk-reward ratio ✅ Clear stop loss settings ✅ Scientific position allocation
Key Execution Recommendations:
Prioritize monitoring the performance of the strong support level at 108,500
Gradually take profits at 112,000 and 113,500
Strictly execute stop loss discipline at 107,800
Maintain a cautious light position for short operations
Final Reminder: The market changes rapidly, please adjust strategies flexibly based on real-time market conditions. It is recommended to pay close attention to changes in trading volume and the impact of major news on technical levels.
Wishing you successful trading!
24/7 Live Broadcast of Real-Time Strategy Explanation
#Tencent Meeting: 919-948-0091
【The above analysis and strategies are for reference only. Please bear the risk. The article review and publication may have delays, and the strategies may not be timely. Specific operations should follow the real-time strategies of the crypto expert】
Join the group chat to discuss and learn professional knowledge in the crypto space, so as not to be the chives under the sickle (you can receive a position allocation guide, teaching you how to make money in a bull market and earn coins in a bear market)
——Crypto Expert Community, a community focused on technical analysis. Anyone with questions about operations or trends can communicate and learn with me! Let's share and profit together! Remember the crypto expert, available 24/7, follow the crypto expert to avoid getting lost!

Scan the QR code with WeChat to follow my public account
免责声明:本文章仅代表作者个人观点,不代表本平台的立场和观点。本文章仅供信息分享,不构成对任何人的任何投资建议。用户与作者之间的任何争议,与本平台无关。如网页中刊载的文章或图片涉及侵权,请提供相关的权利证明和身份证明发送邮件到support@aicoin.com,本平台相关工作人员将会进行核查。


