Crypto News
September 8 Highlights:
1. The SEC announced the establishment of a cross-border special task force to combat cross-border trading fraud that harms U.S. investors.
2. Paxos, Frax, and Agora are competing for Hyperliquid's USDH stablecoin contract, with more bidders expected to join.
3. White House National Economic Council Director Hassett stated that the independence of the Federal Reserve is in question, and he currently has no plans to reform the Fed.
4. Cathie Wood: The current unemployment rate is higher than the peak levels of previous cycles before 2008-2009, reiterating the call for interest rate cuts.
5. Michael Saylor released Bitcoin Tracker information again, possibly hinting at another BTC accumulation.
Trading Insights
Sharing 4 hidden K-line signals from market makers to help you avoid 50% of the pitfalls!
False Breakout: A "previous high trap" set by market makers
① Characteristics: Price quickly falls back after reaching a previous high, with trading volume shrinking compared to the average of the previous 3 days (rather than increasing), akin to "hanging a false light" to lure buyers.
② Key Distinction: A true breakout requires volume and price to move in sync, with volume at least 1.5 times the average of the previous 3 days; a false breakout only "touches" the previous high, with weak volume.Yin-Yang "Washing Pin": Market makers' emotional manipulation
Core observation: At support levels (like MA60), the appearance of a "Yin pin + Yang pin" signals a washout test of panic selling by market makers; at resistance levels (like previous highs), a "Yang pin + Yin pin" with increased volume on the Yin pin (like 2 times) indicates a lure for selling.Long-term Consolidation: Market makers' "hawk waiting" accumulation technique
① Misconception: Consolidation is not a lack of movement but a method for market makers to wear down retail investors' patience, with direction often revealed at the end of consolidation.
② Technique: If consolidation lasts over 15 days, the breakout is usually stronger; a true breakout requires simultaneous increase in volume and price, while a false breakout sees price rise with shrinking volume (market makers "drawing a door").Sharp Top vs. Round Bottom: Signals of "selling" and "accumulation" from market makers
① Sharp Top (Selling): A rapid rise followed by a sharp drop forms a "sharp knife" shape, often accompanied by massive volume (trading volume exceeding 3 times the usual), leaving little time to exit.
② Round Bottom (Accumulation): A slow grind up forms a "round pot" shape, requiring low volume (trading volume reduced to below 50% of the average of the previous 3 months).
Final reminder: K-lines are the "footprints" of market makers. While these patterns are not 100% accurate, mastering them can help avoid at least half of unnecessary losses. Now, by opening the K-line chart for comparison, you can discover signals you may have missed. The crypto market is a game of hunters and prey; understanding the "subtext" can help you avoid being harvested and take more control.
LIFE IS LIKE
A JOURNEY ▲
Below are the real trading group orders from the Big White Community this week. Congratulations to those who followed along; if your trades are not going well, you can come and test the waters.
Data is real, and each order has a screenshot from the time it was issued.
**Search for the public account: *Big White Talks Coins*
BTC
Analysis
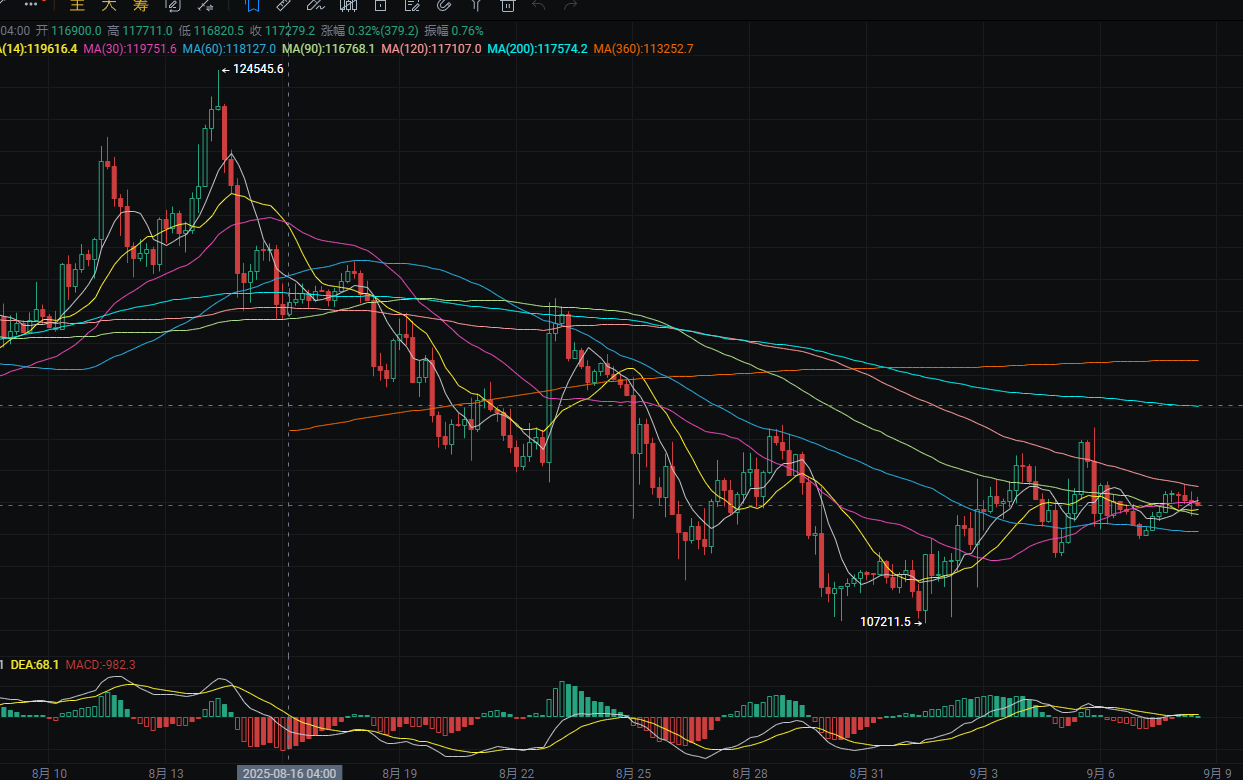
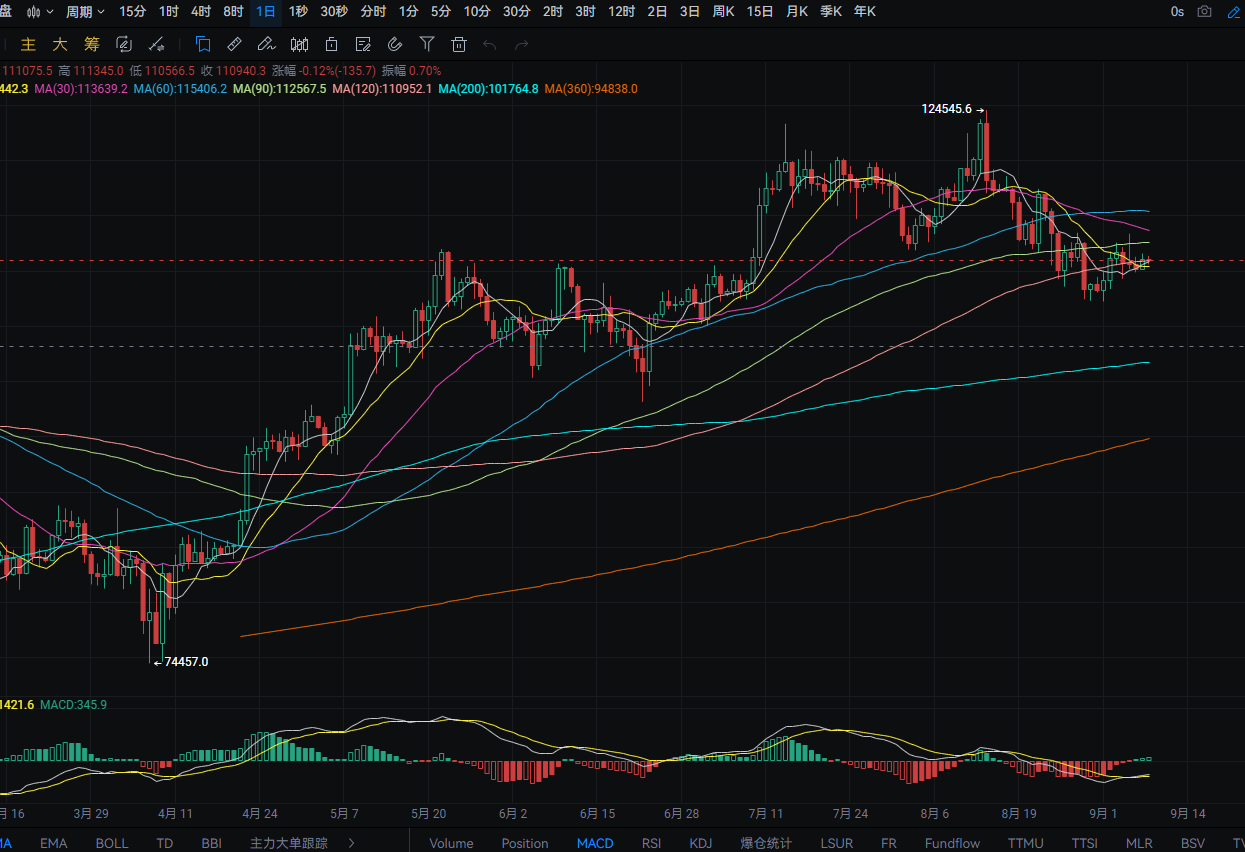
Bitcoin's daily line rose from a low of around 110,100 to a high of around 111,550 yesterday, closing around 111,100. The support level is around 109,250; if it breaks, it could drop to around 107,450. A pullback can be bought near this level. The resistance level is around MA90; if it breaks, it could rise to around 114,400. A rebound near this level can be sold short. MACD shows bullish momentum. The four-hour support level is around MA60; if it breaks, it could drop to around 108,700. A pullback can be bought near this level. The resistance level is around 111,700; if it breaks, it could rise to around 112,550. A rebound near this level can be sold short. MACD is stabilizing with dual lines converging.
ETH
Analysis
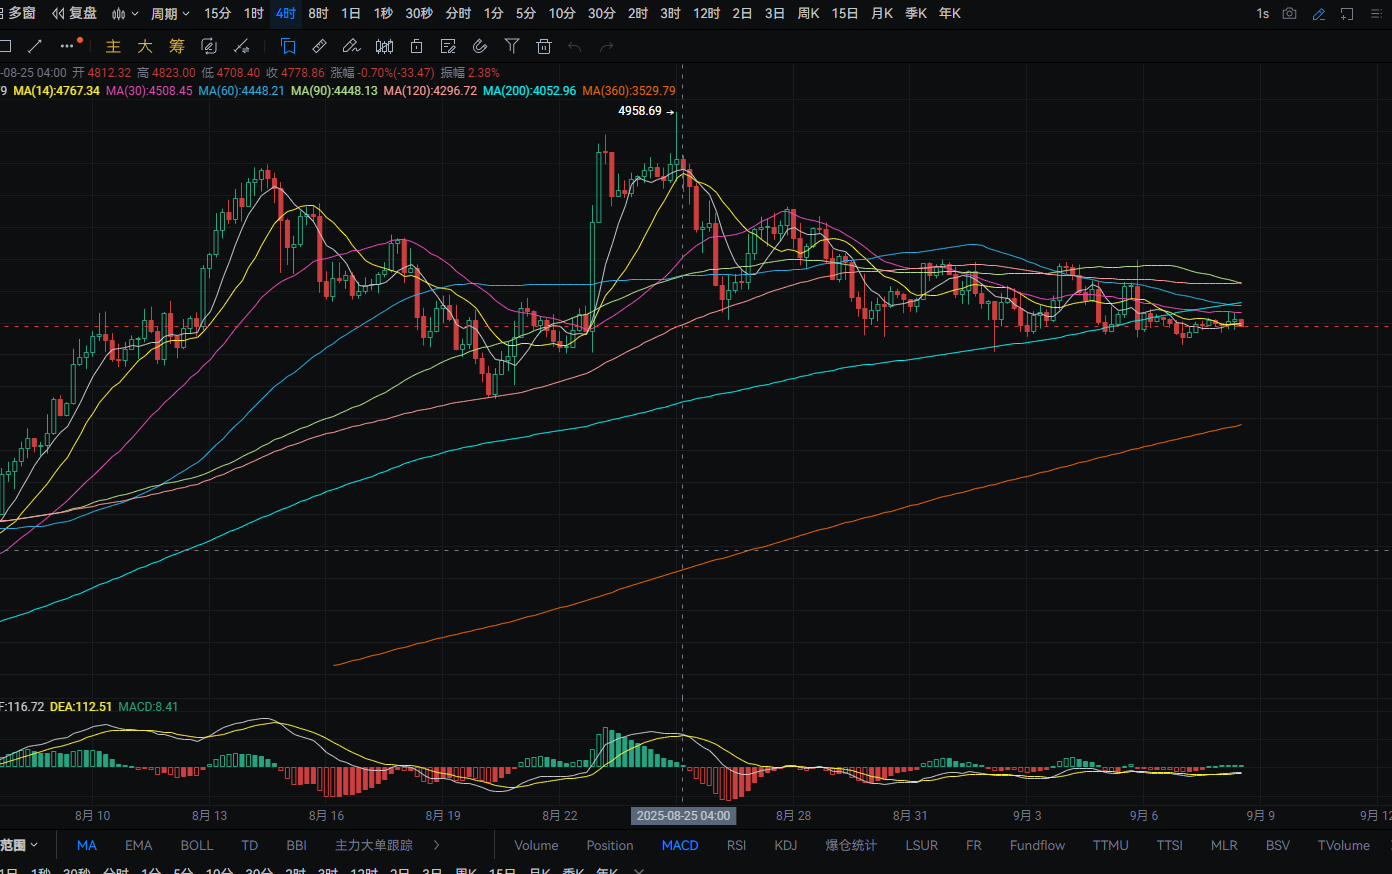
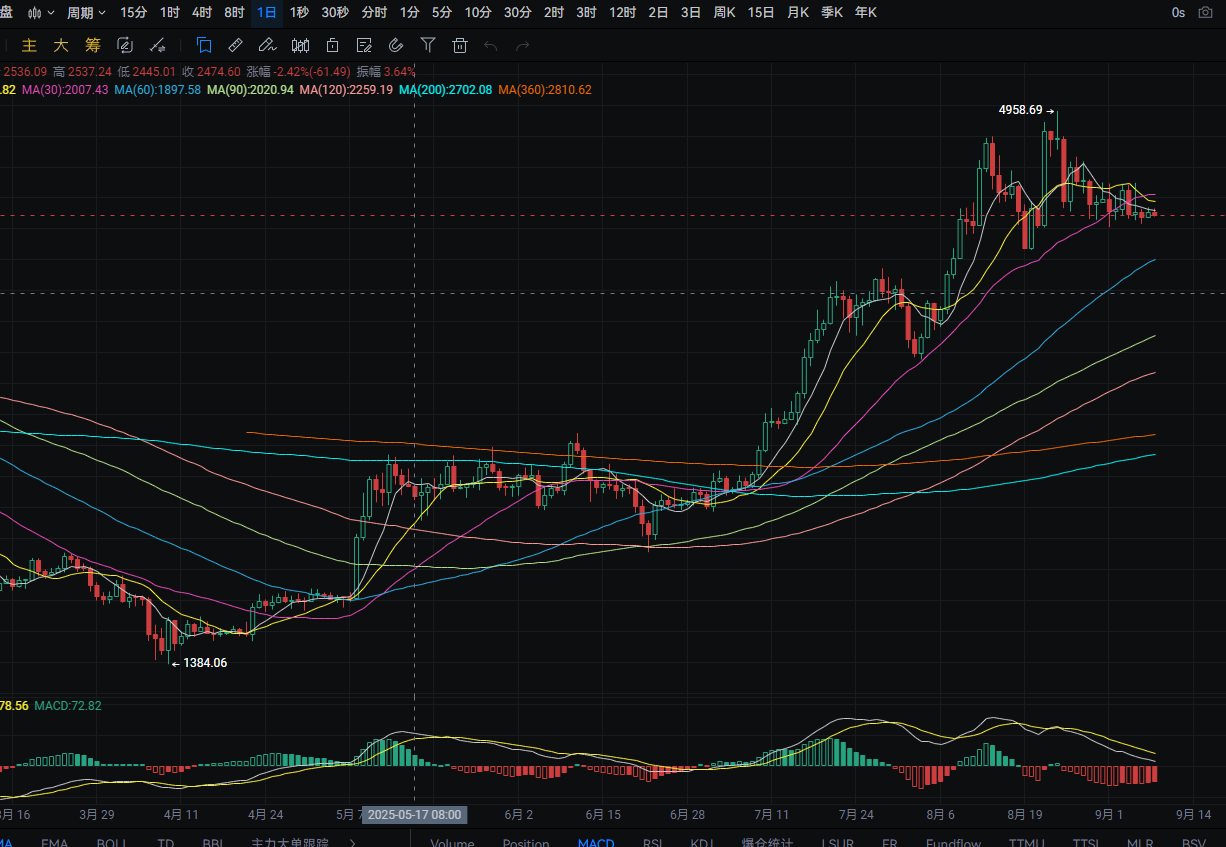
Ethereum's daily line rose from a low of around 4,270 to a high of around 4,435 yesterday, closing around 4,305. The support level is around 4,220; if it breaks, it could drop to around 4,015. A pullback can be bought near this level. The resistance level is around MA14; if it breaks, it could rise to around 4,500. A rebound near this level can be bought. MACD shows bearish momentum decreasing. The four-hour support level is around 4,250; if it breaks, it could drop to around 4,135. A pullback can be bought near this level. The resistance level is around MA200; if it breaks, it could rise to around MA120. A rebound near this level can be sold short. MACD is stabilizing with dual lines converging.
Disclaimer: The above content is personal opinion and for reference only! It does not constitute specific trading advice and does not bear legal responsibility. Market conditions change rapidly, and the article has a certain lag. If you have any questions, feel free to consult.
免责声明:本文章仅代表作者个人观点,不代表本平台的立场和观点。本文章仅供信息分享,不构成对任何人的任何投资建议。用户与作者之间的任何争议,与本平台无关。如网页中刊载的文章或图片涉及侵权,请提供相关的权利证明和身份证明发送邮件到support@aicoin.com,本平台相关工作人员将会进行核查。


