The information, opinions, and judgments regarding the market, projects, cryptocurrencies, etc., mentioned in this report are for reference only and do not constitute any investment advice.
Author: 0xBrooker
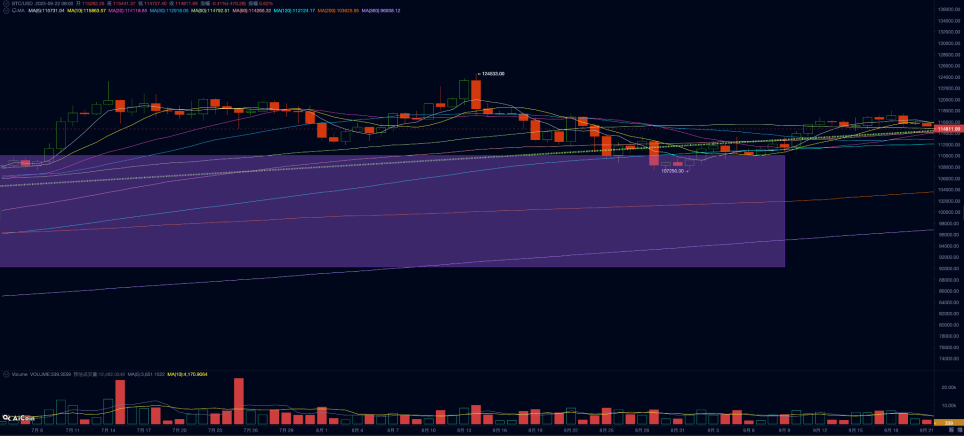
BTC Daily Chart
Policy, Macroeconomic Finance, and Economic Data
On September 17, Eastern Time, at the highly anticipated FOMC meeting, the Federal Reserve officially restarted the interest rate cut cycle, lowering rates by 25 basis points to 4.00%~4.25%, with the discount rate also reduced to 4.25%, while continuing to shrink the balance sheet (QT) at the established pace.
Federal Reserve Chairman Powell stated: "Economic growth slowed in the first half of the year, job growth weakened, the unemployment rate rose, inflation rebounded and remains elevated." This rate cut is primarily aimed at managing the "risk of weakening employment," balancing between high inflation and a softening labor market. Future actions will depend on data and will be assessed incrementally. This means that, in its dual mandate, the Federal Reserve has officially shifted its focus to "employment."
The dot plot shows that the median for the end of 2025 has decreased by 75 basis points compared to the last meeting, indicating that most committee members agree on starting the rate cut cycle, with differences lying in the pace and extent of the cuts, while a minority support faster cuts.
Although the market had previously priced in a few rate cuts within the year, this pricing increased further after the meeting. This led to greater volatility in the dollar index throughout the week, which ultimately fell initially before rising, closing at 97.665. There was a slight increase in long-term U.S. Treasury bond selling, with yields rising by 1.35%. The U.S. stock market saw the Nasdaq, S&P 500, and Dow Jones rise by 2.21%, 1.22%, and 1.05%, respectively, all reaching new historical highs.
Currently, the rise in U.S. stocks is benefiting from the increased risk appetite following the opening of the rate cut cycle and AI-driven earnings growth. The market trend is expected to continue, but it is also constrained by inflation data. Gold rose by 1.05% over the week.
Cryptocurrency Market
Due to early pricing completion and insufficient follow-up funds, BTC underperformed the Nasdaq this week, slightly falling by 0.03%.
This week, BTC opened at $115,314.12, closed at $115,282.27, reached a high of $117,998.17, and a low of $114,395.84, with a weekly decline of 0.03% and trading volume remaining flat, showing a narrow fluctuation trend of rising first and then falling.
Technically, BTC closed above the first bullish ascending trend line, supported by the 60-day moving average.
In terms of holding structure, after increasing positions last week, long-term holders initiated a sell-off of 25,149 coins this week, bringing significant upward pressure to the market.
In terms of profit from spending, the average for long-term holders is over 2 times, indicating that their sell-off has yielded substantial profits, while short-term holders are around 1, showing that this group has not incurred losses from selling.
The unrealized profit for long-term holders is 3.16%, still holding a significant unrealized profit, while the unrealized profit for short-term holders is 1.04%, which does not exert pressure on the market.
Due to forward trading reasons, the funds flowing into the cryptocurrency market this week saw a significant decrease compared to last week. A total of $7.107 billion flowed in this week, down from $9.539 billion last week, including $889 million from the BTC Spot ETF channel, $129 million from the BTC DATs channel, $550 million from the ETH Spot ETF channel, $366 million from the ETH DATs channel, $2.544 billion from the SOL DATs channel, and $2.589 billion from stablecoins.
Another factor creating psychological pressure on the market is the cyclical rate. Entering the period from September to December has historically been a peak time for BTC price cycles, which may also explain the continuous sell-off by long-term BTC holders, especially those holding for over 7 years.
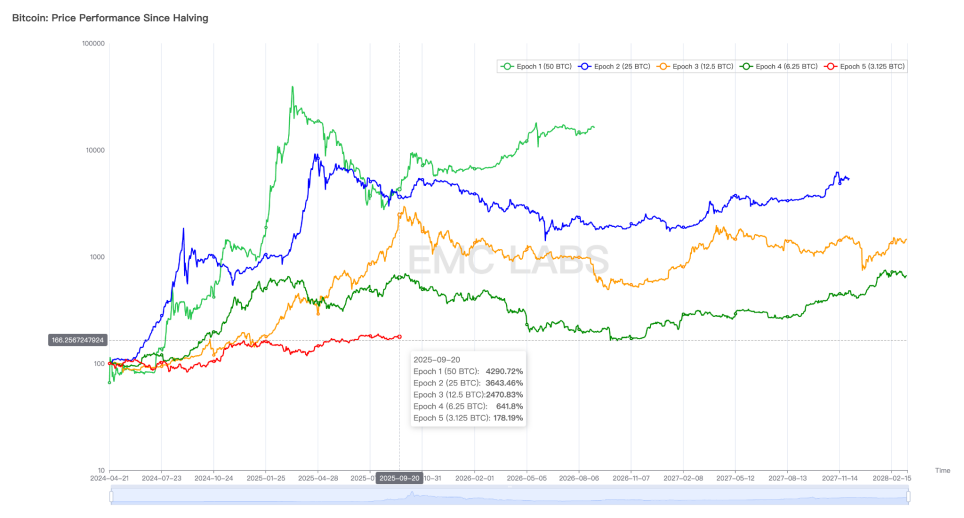
Comparison of BTC Price Trends After Each Halving
From the perspective of industrial policy, capital inflow, and macroeconomic cycles, it is currently the best expansion period for crypto assets. However, whether BTC and the entire crypto market can break free from the constraints of cyclical rates and form new market rules and cycles remains uncertain.
As the U.S. interest rate cut cycle restarts, whether BTC and crypto assets can rise to the next level depends on whether sellers can fully absorb the current selling pressure. The market will provide answers in the coming months.
Cycle Indicators
According to eMerge Engine, the EMC BTC Cycle Metrics indicator is at 0.25, indicating an upward continuation phase.
免责声明:本文章仅代表作者个人观点,不代表本平台的立场和观点。本文章仅供信息分享,不构成对任何人的任何投资建议。用户与作者之间的任何争议,与本平台无关。如网页中刊载的文章或图片涉及侵权,请提供相关的权利证明和身份证明发送邮件到support@aicoin.com,本平台相关工作人员将会进行核查。


