Source: On-Chain Mind
Translation: Shaw Jinse Finance
To be honest, most Bitcoin price predictions resemble horoscope forecasts rather than rigorous analysis. Bold predictions and "sky-high" targets may be entertaining, but in reality, they are merely guesses.
They often overlook the fundamental mechanisms of the Bitcoin network: transfers, the actions of long-term holders, and the valuation dynamics that drive actual cycles.
Here, we will take a different approach: delving into 6 on-chain indicators that have consistently signaled during the peaks of all previous cycles.
Key Points Overview
On-Chain Crystal Ball: From Factored terminal price to Delta peak, 6 time-tested indicators have historically shown accuracy in predicting Bitcoin frenzy peaks.
Convergence is Key: These indicators may diverge in volatile markets but tend to converge during parabolic uptrends, forming a dynamic range for potential tops rather than a fixed value.
Power of Averages: The composite line formed by integrating all 6 lines, adjusted for cyclical decay, currently hovers around $180,000, serving as a reference for actual exit planning.
Focus on Trends, Not Numbers: A true top is not solely determined by price levels but stems from market behavior, the movements of long-term holders, and the frenzy at the end of cycles.
Why Most Price Predictions Fail
Before diving into the indicators, we first need to understand why traditional prediction methods rarely work. Charts with unclear trend lines are essentially subjective and often lack contextual information. They do not consider underlying network activity, the behavior of long-term holders, or cumulative value flows. Essentially, they rely on speculation rather than observable data.
To truly predict Bitcoin's top, we need indicators based on network fundamentals—data that reflects real-world usage, accumulation, and distribution. This is the value of on-chain analysis.
6 Selected Indicators
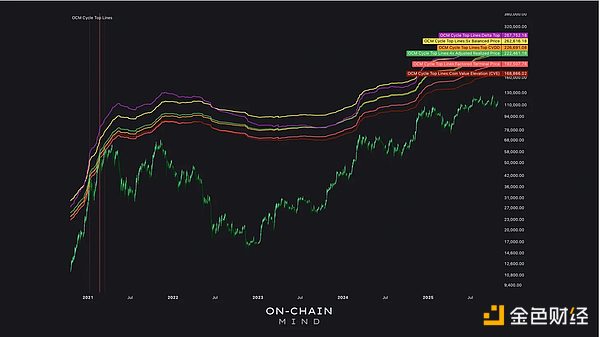
In the chart below, 6 lines of different colors represent various on-chain or market-derived estimates of potential cycle tops.

The predicted range is between $168,000 and $267,000, with a larger range due to the current market consolidation phase. Such volatility is normal during the mid-cycle lull; in the later stages of the cycle, indicators tend to converge.
Here are detailed explanations of each indicator and their significance:
1. Factored Terminal Price (Light Red)
The Factored terminal price is a classic indicator in on-chain analysis. It represents the theoretical upper limit of Bitcoin based on cumulative network value transfer and coin age. Historically, reaching this level indicates extreme market overheating. It provides a mature upper limit, serving as a benchmark for assessing price trends at the end of cycles.
2. Token Value Enhancement (Dark Red)
Token Value Enhancement (CVE) is a custom indicator that tracks long-term price ceilings by combining Bitcoin's holding time and changes in long-term positions. Essentially, it measures the degree of speculative frenzy and can dynamically adapt to longer cycles. It often provides early warnings for later frenzies driven by FOMO (fear of missing out).
3. 5x Balanced Price (Yellow)
This indicator combines realized price (average cost for investors) and terminal price, merging historical network valuations with current market sentiment. Multiplying by 5 yields a speculative top prediction that encompasses both network fundamentals and short-term market optimism.
4. 4x Adjusted Realized Price (Green)
This indicator is an improvement on the standard realized price multiple, taking into account the Spent Output Profit Ratio (SOPR) and trading volume. By multiplying the adjusted realized price by 4, it serves as a network heat indicator, highlighting when a large number of tokens are sold at high prices.
5. 4.5x Token Value Destruction Days (Orange)
This indicator focuses on the liquidation of long-held tokens. When idle tokens are finally transferred, this indicator spikes. Multiplying it by 4.5 shows a high correlation with historical peaks, especially when long-term holders sell during a frenzied uptrend.
6. Delta Top (Purple)
The Delta top is calculated based on the difference between the actual price and the time-adjusted average market cap, multiplied by 7. It often coincides with psychological blow-off tops. These are irrational surges where Bitcoin is pushed far beyond its reasonable value, marking the final frenzy phase of a bull market.
Current Signals
Currently, these six indicators suggest that the potential price top may range from $168,000 (CVE) to $267,000 (Delta top). In the current phase of market oscillation or volatility, such price fluctuations are normal.
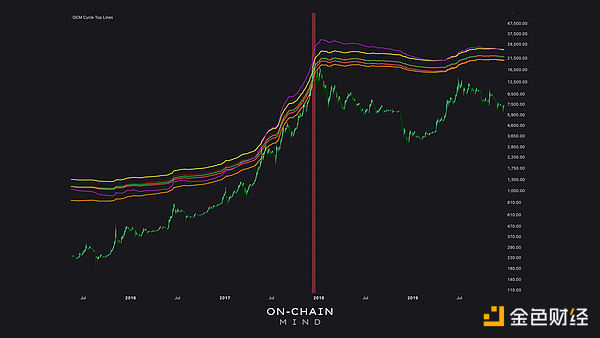
However, this discrepancy does not imply inaccuracy. It reflects that Bitcoin has not yet entered the frenzied parabolic uptrend phase. Historical analysis shows that before the cycle top arrives, these indicators will closely converge, just like in 2017:

These 6 indicators have begun to align, matching the prices at each previous cycle peak.
Value of Composite Indicators
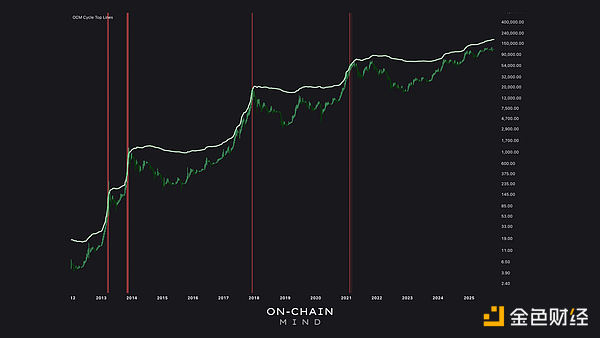
Relying on a single indicator can be misleading. To address conflicting signals, I created a composite average line that integrates all 6 indicators and incorporates a decay factor to account for cyclical diminishing returns.
This line currently sits around $180,000 and has reliably captured cycle peaks. Let's take a look:

In 2021, the average price of Bitcoin approached $64,000. In 2017, amidst a frenzy, Bitcoin's price reached $20,000. Even during the volatile period of 2013 to 2014, it touched related price levels before its correction. These are not coincidences but reflect recurring behavioral patterns among investors.
Why Indicators Alone Are Not Enough
It is essential to remember that reaching indicator targets does not equate to price peaks. Market behavior, the speed of price fluctuations, and other typical signs of late-cycle frenzy are equally important. Divergence in prices is normal during the early to mid-cycle. Once Bitcoin enters the final vertical uptrend phase, indicators will quickly converge.
When prices begin to closely follow the average line during a rapid rise, my confidence in a macro top increases.
Ultimately, these models do not provide precise numbers but offer a convergence range that allows us to act based on evidence rather than emotion.
Navigating the Remaining Stages of This Cycle
The key to this analysis is that the best prediction is not about guessing a specific number but identifying patterns and behaviors that have repeatedly appeared in past cycles. By combining various on-chain and market indicators, we can gain a clearer understanding of potential peak areas rather than blindly pursuing a single target.
It is important to note: the entire analysis is based on the premise that a frenzy phase will occur at the end of the Bitcoin cycle. While every previous Bitcoin cycle has experienced this phase, it does not guarantee that it will happen this time. Nevertheless, considering the persistence of market behavior, recurring patterns, and the invariance of investor psychology, my fundamental judgment is that we are likely to witness this phase again.
In the later stages of the Bitcoin cycle, even seasoned Bitcoin holders may be swept up in the frenzy of rising prices, making it crucial to utilize data-driven indicators for advance planning. While Bitcoin may be maturing, its peak magnitude may be less intense than in previous cycles, but even considering the decay factors I apply, existing evidence suggests that we have not yet reached a typical cycle top.
Depending on the development of price trends, if this consolidation lasts longer, the composite average price may rise above $200,000; if macroeconomic-driven uptrends accelerate faster than expected, it may decline.
In this cycle, my plan is to remain patient, avoid being swept away by market frenzy, and approach the peak in a more rational rather than impulsive manner. Observing data and the behaviors behind it is far more valuable than guessing raw numbers.
Conclusion
Multi-Indicator Approach: Relying on a single indicator carries the risk of missing opportunities; utilizing 6 indicators provides robust and historically validated signals for cycle peaks.
Dynamic Range Over Static Targets: The average line of $180,000 will change with market phases, providing us with a flexible exit range rather than a fixed target.
Contextual Frenzy: Tops are reflected in the behavior of holders and parabolic trends, not just prices. Prepare rationally to avoid falling into emotional traps.
Evidence Over Speculation: Using on-chain data allows decisions to be based on observable trends rather than hype or intuition.
免责声明:本文章仅代表作者个人观点,不代表本平台的立场和观点。本文章仅供信息分享,不构成对任何人的任何投资建议。用户与作者之间的任何争议,与本平台无关。如网页中刊载的文章或图片涉及侵权,请提供相关的权利证明和身份证明发送邮件到support@aicoin.com,本平台相关工作人员将会进行核查。


