Recently, I have been receiving private messages from people asking, "How should I navigate the trading path?" To be honest, when I see this question, I instantly empathize—years ago, I often found myself staring blankly at candlestick charts, either panicking from chasing highs and lows or staying up late holding onto losing positions, even doubting whether I was cut out for trading at all. Today, I don't want to discuss obscure theories; instead, I want to share my heartfelt journey of how I gradually found my direction, hoping to provide some reference for friends who are still feeling lost.
Let me first share a big pitfall I fell into early on: when I first started, I was always looking for "shortcuts." Back then, I scoured various "expert strategies," such as "bottom fishing and top selling rules" and "winning indicators for swings," bought them, and followed them blindly. What was the result? Either I made a small profit a few times and then lost it all, or I found myself stuck despite the signals being right due to sudden market changes. Later, I realized that there is no "one trick to eat all." As the theory of market efficiency reveals, the market is dynamically changing; a technical indicator or strategy that is effective today may not be applicable tomorrow. What truly matters is a deep understanding of the market, not relying on "ready-made answers" provided by others.
I gradually adjusted my mindset and began to put in "hard work," which made the path feel much smoother. For example, I started spending one hour each day reviewing trades—not just looking at gains and losses, but analyzing each trade: Why did this trade profit? Was it due to accurate market judgment or just luck? Why did this trade lose? Was it due to improper stop-loss settings or entering too early? Initially, it felt tedious, but after six months of persistence, I found my sensitivity to market movements significantly improved. For instance, when I see a certain candlestick pattern, I can immediately recall, "I've encountered a similar situation before, and this is how I responded," which reduces the probability of making mistakes.
Another crucial point: never view trading as "gambling," and learn to "control risk." I had a painful experience before: in an attempt to recover previous losses, I heavily invested in a trade, only for the market to turn against me, resulting in a loss of more than half my capital. During that time, I seriously considered giving up. Gradually, I understood that the key to trading is not "who makes the most money," but "who can survive in the market for the long term." Now, before making a trade, I always calculate my stop-loss: how much can I afford to lose on this trade? If I hit that number, regardless of how the market moves afterward, I will exit decisively. Even if sometimes the market rebounds after I stop-loss, I don't regret it—because I know that preserving my capital gives me the opportunity to profit next time.
Perhaps some might say, "I understand the theory, but the actual operation doesn't go as planned." In fact, I have also gone through such phases. Later, I discovered that trading is not only a technical skill but also a mental game. For example, even though I set a stop-loss, I hesitate because I think, "Maybe if I wait a bit, it will rebound," resulting in even greater losses; or I panic after making a small profit and quickly close my position, missing out on a larger market movement. These issues ultimately stem from an unstable mindset. Now, before making a trade, I take a deep breath and remind myself, "Stick to the plan, don't let emotions lead you," and gradually, this "emotional trading" has decreased significantly.
Finally, I want to say that the trading path is indeed difficult; no one has a smooth journey. But as long as you don't always look for shortcuts, are willing to put in hard work, learn to control risks, and gradually adjust your mindset, you will definitely see changes. Perhaps today you are still facing losses, but as long as the direction is correct, every loss is laying the foundation for future profits. I also want to ask everyone: what confusions have you encountered on your trading journey? Do you have any personal tips? Feel free to share in the comments, and let's learn from each other to make this path smoother together.
【Technical Sharing—Analyzing Market Trends through Candlestick Patterns】
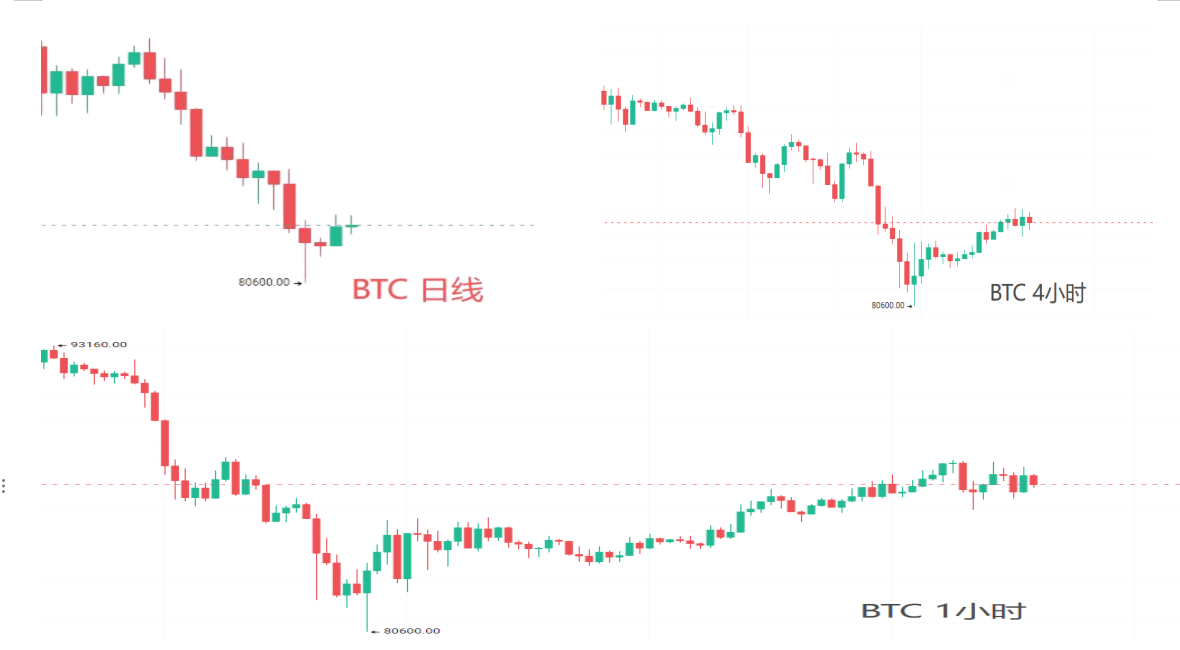
 BTC Daily: From the daily candlestick pattern combination, the recent price has stabilized above the key support level. The candlestick pattern shows a downward oscillation structure, while the candlestick presents a golden needle bottoming pattern, forming a hammer signal for an upward trend, with short-term bullish momentum gradually strengthening. From the downward candlestick structure, the market has not yet truly formed a heartbreaking breakout; the price is under pressure at the candlestick's continued downward momentum point. After the golden needle bottoming, the candlestick moves upward in a doji star structure, breaking above the vertical line high point, forming a hope star structure (weak), with sufficient support momentum. The next step is to pay attention to whether the price can break upward with a large candlestick.
BTC 4-Hour: From the 4-hour candlestick pattern, after completing the golden needle bottoming, the price has consecutively closed three bullish candles, showing a gradual increase in volume and an upward attack trend. The short-term moving average system has turned from crossing below to turning upward, forming a preliminary bullish arrangement. In the candlestick structure, the current price has broken through the previous rebound high point and formed a "rising three methods" bullish combination on the 4-hour chart, indicating an increase in the bulls' control. Although there is still pressure from the previous dense trading area above, the bullish momentum continues to expand. If it can stabilize at this key level, a new wave of upward trend may begin. At this time, one must be cautious of emotional interference and not easily shake established strategies due to short-term fluctuations.
BTC 1-Hour: From the 1-hour candlestick pattern, after completing a short-term adjustment, the price has once again surged with increasing volume, breaking through the parallel range pressure position. The bullish momentum continues to be released, and the candlestick shows slight acceleration. The current hourly chart has formed a "three consecutive bullish" attack pattern, accompanied by a moderate increase in trading volume, indicating an enhanced market buying interest. From the state of the candlestick combination, the current bullish trend structure is complete, and the short-term pullback has not broken the key support level, leaving further upward potential in the future. It is essential to focus on whether the subsequent candlesticks can maintain oscillation and accumulation at high levels. If they can effectively hold the current support area and continue to accompany trading volume, there is hope to test the previous high point pressure area upward. Conversely, if there is a significant increase in volume with stagnation or long upper shadows indicating a top signal, one must be wary of short-term pullback risks.
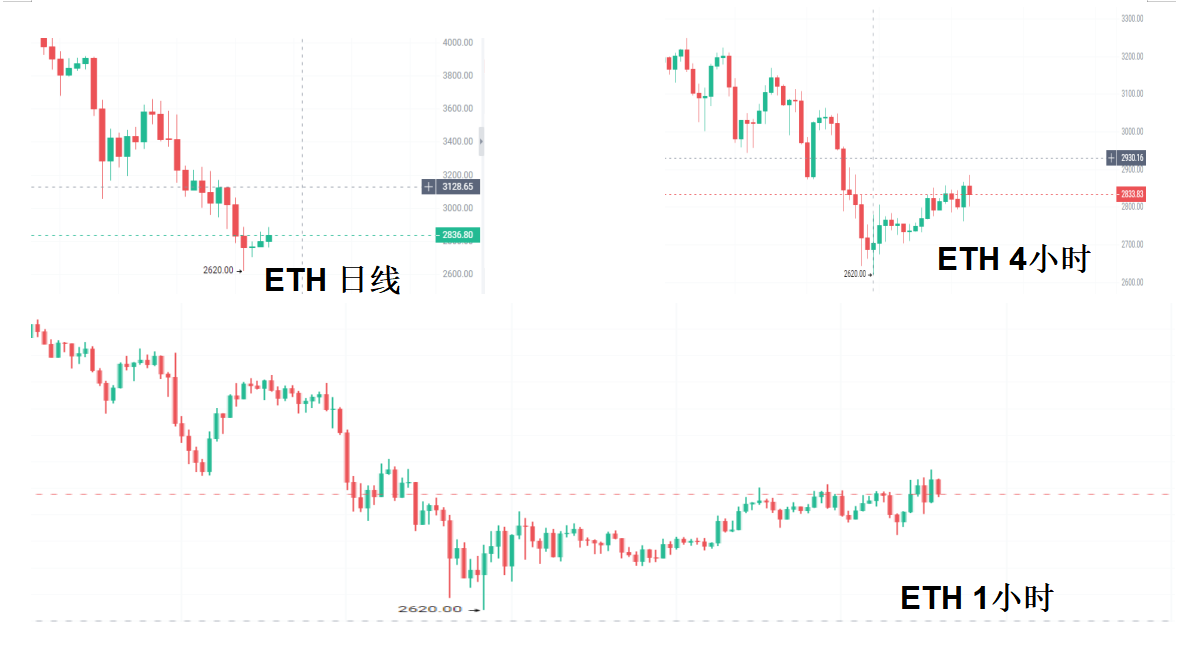
 ETH Daily: The ETH daily level is in the rebound correction phase of a downtrend, with the price stabilizing and rebounding after testing previous low support. The candlestick pattern forms a "morning star" combination, releasing initial bottoming signals. Although the overall bearish trend has not completely reversed, short-term bullish momentum has increased, with consecutive bullish candles breaking through the descending trend line pressure, indicating a gradual warming of market sentiment. Attention should be paid to whether the price can effectively accumulate in the current area and further break through the previous high pressure level. If accompanied by a continuous increase in trading volume, a phase of rebound may begin. Conversely, if it faces pressure and falls back, breaking key support, it may return to the downward channel.
ETH 4-Hour: After completing a bottom divergence structure in the 4-hour cycle, ETH quickly descended, forming a long lower shadow to complete a bearish trap washout, followed by four consecutive bullish candles achieving a reversal. In the candlestick structure, a "red three soldiers" bullish combination is formed, showing a clear bullish offensive trend. The current price is under pressure from the previous candlestick's continued downward point, in a state of oscillation and accumulation, constructing a range-bound consolidation, waiting for directional choice. The current short-term dynamic range upper edge resonates with the previous high, while the lower edge corresponds to the recent volume-increasing bullish candle's starting point. The longer the range-bound oscillation occurs with reduced volume, the more sufficient the accumulation. Once it breaks through the upper resistance with increased volume, it will open up space above, challenging higher resistance areas; if it breaks below the lower support, it may retest previous low points for confirmation.
ETH 1-Hour: After breaking through the previous high, the price retests to confirm support, forming a bullish engulfing pattern after a "head-and-shoulders" formation. The short-term candlestick shows a stepwise upward oscillation, with the candlestick structure showing a synchronous rise in high and low points in a bullish arrangement. Currently, from the left-side trading perspective, the candlestick belongs to the bearish continuation and bullish conversion time window, at a critical turning point, intensifying the battle between bulls and bears. If the subsequent candlesticks can stabilize in the current support area and launch an upward attack, it will confirm the bulls' dominant position, and the upper pressure level is expected to be broken through step by step; conversely, if it loses key support, one must be wary of a bearish counterattack. The market is at a critical moment of directional choice, and the outcome of the bull-bear battle may be determined in this round. Currently, both sides are engaged in a tug-of-war at key price levels, and changes in volume will become the core to break the deadlock.
Key Insights:
【BTC】
Key Resistance Levels: 88500----93000----105000
Key Support Levels: 83500----80000----76500
【ETH】
Key Resistance Levels: 2850----3050----3250
Key Support Levels: 2720----2620----2420
If the recent market has worn you out a bit and you want someone to chat with, but don’t want to be misled or pushed into trades, you can join our veteran QQ group. The group consists of people who have been beaten by the market but are still persevering; no one pretends, no one deceives, just a real atmosphere of mutual support and wake-up calls. In the QQ group, we have prepared learning documents on cryptocurrency cognitive thinking courses and other materials to enhance understanding, which can be accessed in the QQ group files.

QQ Group Number: 1005079324 Scan below to join the group chat

Disclaimer: The above content represents the author's personal views and aims to assist investors in understanding information related to the capital market. It does not constitute any investment advice and does not represent the stance or views of AiCoin. The market has risks, and investment should be cautious.
免责声明:本文章仅代表作者个人观点,不代表本平台的立场和观点。本文章仅供信息分享,不构成对任何人的任何投资建议。用户与作者之间的任何争议,与本平台无关。如网页中刊载的文章或图片涉及侵权,请提供相关的权利证明和身份证明发送邮件到support@aicoin.com,本平台相关工作人员将会进行核查。


