Author: Jianwei Zhizhu Zatan
Last night, I read JPM's latest metal weekly report, which mainly explained the competition between "risk-off selling" and "supply shock" faced by major metals against the backdrop of shipping interruptions in the Strait of Hormuz.
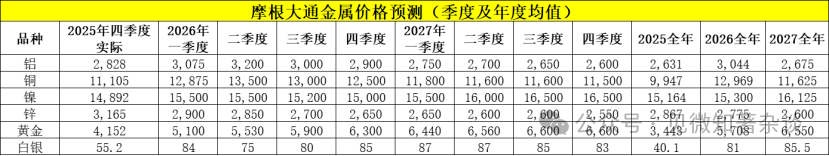
Core conclusion:
1. Gold: Short-term "misjudged," long-term bull market
Core contradiction: Safe-haven properties vs liquidity crisis
Under short-term pressure ("sell everything" mode): The recent decline in gold prices is not due to a failure of the safe-haven, but during market panic (VIX index soaring), investors sell all assets indiscriminately (including gold) to raise margin and cash. Data shows that when VIX > 30 and rising, the weekly probability of gold rising is only 45%, with an average return being negative.
Tactical buy point: Historical data shows that this panic selling usually lasts about 10-15 days. Starting from the third day after the sell-off, gold prices often begin a rebound lasting about a week, with an average increase of more than 2%.
Long-term logic (bullish turn): If the energy disruption continues, the high inflation combined with recession risks (stagflation) will force the Fed to turn towards loose policies to protect employment. This "stagflation + interest rate cuts" combination will become an "extremely bullish" macro backdrop for gold.
2. Aluminum: The most steadfast buying choice
Core logic: Supply-driven super bull market
Supply chain fragility: Aluminum smelters in the Middle East heavily rely on imported alumina (raw material) and exporting finished products. The closure of the Strait of Hormuz has cut off the two-way channel of "material in, finished goods out."
Production cuts inevitability: Even if some manufacturers (like Qatalum) temporarily maintain 60% capacity, their raw material inventory can only support 30-50 days. If shipping does not resume, there will be large-scale production cut announcements in the coming weeks.
Price target: Supply interruptions will push aluminum prices rapidly towards $4,000/ton or higher.
3. Copper and Nickel: High risk but different buffer periods
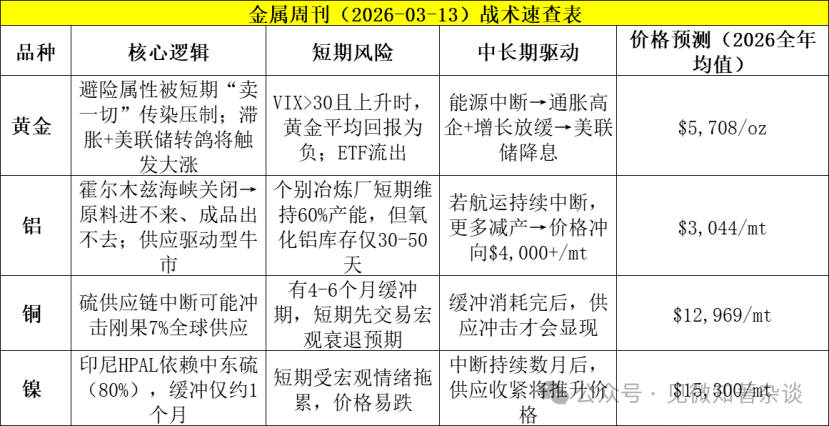
Common risk point: Sulphur supply chain disruption.
The Middle East supplies 50% of the world's marine sulphur, which is a key raw material for the production of sulphuric acid; sulphuric acid is crucial for solvent extraction (SX-EW) and high-pressure acid leaching (HPAL) nickel.
· Copper (biased towards pessimism):
Risk: Production in places like the Democratic Republic of Congo (DRC) may be affected, impacting about 7% of global supply.
Buffer: Stock + transportation chain has a 4-6 month buffer period. The market will trade on macro recession expectations before a real supply shortage occurs, potentially leading to an initial drop in copper prices.
· Nickel (neutral to bearish):
Risk: 80% of sulphur required for Indonesian HPAL projects relies on imports from the Middle East, with a buffer of only about 1 month.
Positioning: Its impact level is between aluminum (most bullish) and copper (bearish). Although costs may soar, the current main risk remains the sell-off caused by macro sentiment.
I. Gold and market pressure—The infectious risk before the rise
Entering the second week of the Iran conflict, aluminum remains our most favored basic metal bullish variety, as we believe that as long as shipping through the Strait of Hormuz continues to be disrupted, this metal is approaching a very bullish, supply-driven event critical point.
Copper's supply also faces risks from the disruption of the sulphur supply chain, which could ultimately affect about 1.8 million tons of cathode copper production in the Democratic Republic of the Congo (DRC), accounting for about 7% of global supply. Although the volume of supply at risk is large, considering the relatively long supply chain from sulphur to Congo, we believe that before supply disruption becomes the primary issue, the first layer of risk still leans towards a sharp price drop under the reassessment of macroeconomic outlook.
Nickel also has supply vulnerabilities related to sulphur; approximately 460,000 tons of nickel produced using HPAL in Indonesia, accounting for 12% of global nickel supply, relies on sulphur imported from the Middle East.
Although the buffer for nickel may be smaller than that of copper, we view the misalignment and disruption of aluminum as the most important supply risk currently.
The gold price has dropped about 6% since the start of the war, raising questions about its safe-haven status. The rebound of the dollar and the cooling of market expectations for Fed rate cuts (along with rising inflation pressure due to energy price increases) is one reason, but most sell-offs occurred last week, stemming from a widespread de-risking contagion among investors.
During times of market pressure, gold will initially get caught up in "sell everything" trades. We will explore this initial contagion risk in more detail below, as well as gold’s historical performance before and after these events, serving as tactical references during high volatility periods.
While gold may still be susceptible to this contagion risk in the short term, we believe that the longer the energy disruption lasts, the greater the impacts on inflation and even economic growth will be, and the backdrop for gold is likely to shift rapidly to significantly bullish, especially when the Fed turns to loose policies due to its dual mandate on employment.
II. Base metals—Different supply chain buffers due to long-term closure of the Strait of Hormuz lead to differentiated first-round impacts
Aluminum remains our most favored basic metal bullish.
Qatalum was the first Gulf aluminum smelter to announce production cuts on March 3. This week, it adjusted its plans, stating it would maintain its capacity at 60% (about 650,000 tons/year) if it receives sufficient natural gas supply.
Although this slightly reduces potential current supply losses, the plant still cannot ship through the Strait of Hormuz and relies on imported alumina. Assuming it has a 20-30 day alumina inventory at full production, reducing to 60% utilization means that inventory can be extended to 30-50 days, but a further decision to halt production must be made weeks before the alumina inventory is exhausted.
Overall, we believe that this does not fundamentally change the fact that aluminum is approaching a supply-driven bull market under the ongoing effective closure of the Strait of Hormuz. If shipping restrictions do not ease in the coming weeks, we expect more production cut announcements, leading the market misalignment to evolve into a more severe and prolonged supply disruption, with aluminum prices potentially rising rapidly above $4,000 per ton before demand-driven adjustments.
Copper also faces supply chain issues, but the buffer before the disruption might be larger.
Against a backdrop of declining risk appetite and a strengthening dollar, copper prices have shown significant resilience to date. One supporting factor may be the supply risks posed by the sulphur supply chain disruption—50% of global marine sulphur comes from the Middle East.
Sulphur and its downstream product, sulphuric acid, are critical to solvent extraction—electrowinning (SX/EW) copper production, which annually produces about 5 million tons of copper, accounting for 18% of global refined copper production. Chile mainly imports sulphur from Canada, the United States, and Turkey, while last year, exports from South Africa and the Democratic Republic of the Congo relied almost entirely on imports from the Middle East.
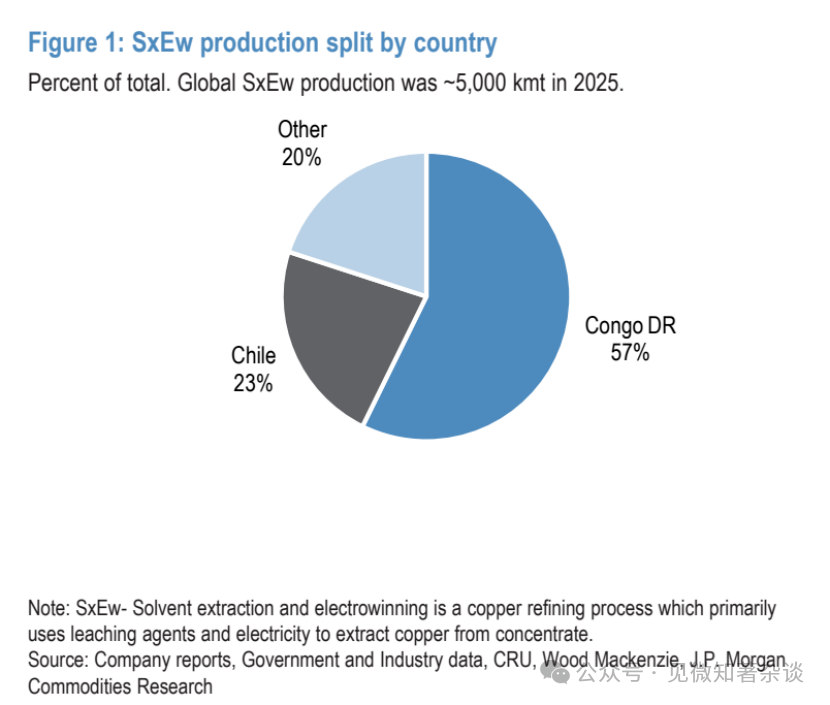
Figure 1: Proportion of solvent extraction—electrowinning (SX/EW) copper production by country
According to CRU data, last year, nearly 3.6 million tons (60%) of sulphuric acid demand in the DRC was met by burning imported sulphur. Based on the SX/EW acid intensity of about 1.93 tons of acid required to produce 1 ton of cathode copper, this could impact SX/EW copper production in the DRC to the tune of 1.8 million tons, representing 7% of global refined copper supply.
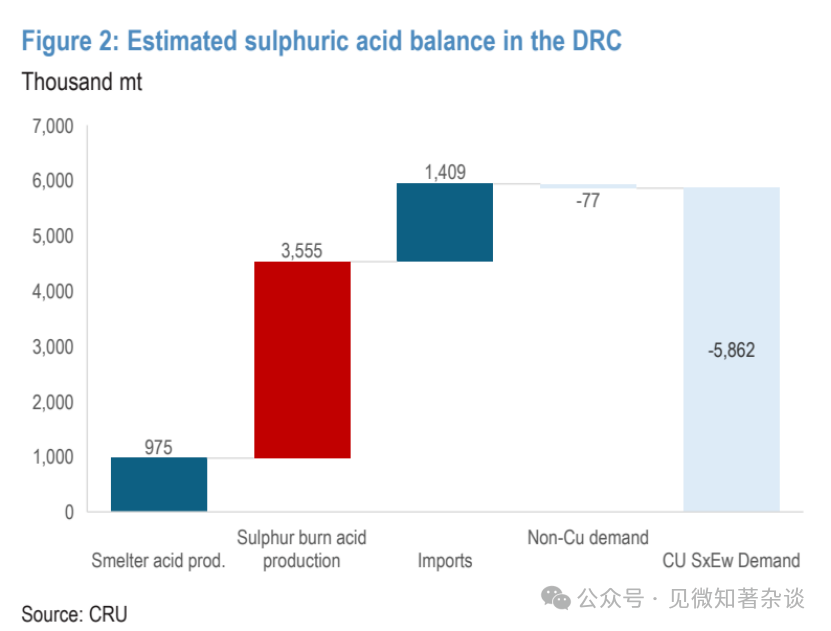
Figure 2: Estimated sulphuric acid supply and demand balance in the Democratic Republic of the Congo
However, the buffer period before the disruption may be quite long. CRU estimates that there is about 2-3 months of elemental sulphur inventory in the region, plus a transport cycle of 1-3 months from the Middle East, thus there may be a 4-6 month inventory buffer period before significantly affecting downstream copper production.
Moreover, through adjustments in ore processing sequences and leaching conditions, the net acid intensity can be reduced to partially offset copper's impact in the future. Therefore, for a substantial disruption in DRC SX/EW copper supply, the closure of the Strait of Hormuz would need to be long-term, but this would also bring severe macroeconomic and demand consequences.
In summary, for copper, this is more a question of timing. Although the volume of supply at risk is significant, given the relatively long buffer period of its sulphur supply chain, we believe that before supply disruption becomes critical, the first layer of risk still trends towards a sharp price drop under the reassessment of the macroeconomic outlook.
Indonesian nickel HPAL production also faces risks.
Once transformed into sulphuric acid, sulphur is also an important input for high-pressure acid leaching (HPAL) nickel production. Indonesia faces the greatest production risk for several reasons: 1) nearly 80% of its sulphur demand relies on imports from the Middle East; 2) its supply chain buffer may be smaller than that for copper, with a transport time of about 1 month from the Middle East.
Last year, Indonesian producers' HPAL output was about 460,000 tons, accounting for 12% of global nickel supply. Although costs are also a factor, chemical inputs (including acid) account for nearly 60% of Indonesian HPAL costs, but these operations are typically low-cost (under $8,000/ton), so complete disruptions remain the primary bullish supply risk.
In our view, in the first-round impacts of the long-term closure of the Strait of Hormuz, nickel’s positioning is between aluminum (bullish) and copper (bearish). Major HPAL producers have been reported to halt offering long-term contracts, highlighting that significant production has begun to be pressured due to supply chain issues.
However, to truly create a supply shock, the strait's closure may need to last for several months. Like copper, this will initially trigger widespread nickel price declines under demand/macroeconomic concerns, followed by supply rebalancing.
III. Gold—Caution against a sharp de-risking drop before stronger catalytic factors emerge
In the past two weeks, we have repeatedly been asked about gold: why it has not performed like a safe-haven asset (showing a noticeable pullback at the beginning of last week and facing pressure again this weekend)? How should we strategically respond next?
As we pointed out in our initial reaction report, the risk premium for gold during conflicts is often short-lived, exhibiting characteristics of "buy the rumor, sell the news."
Additionally, the initial rebound of the dollar, combined with rising energy prices bringing inflation pressures that elevated interest rate expectations while weakening the Fed's interest rate cut expectations, has continued to exert new pressure.
We believe there is another dynamic factor worth exploring—during times of rising stock market volatility, widespread de-risking among investors may trigger contagion effects, which could lead to outflows from gold ETFs and last week's sharp reversal in gold prices.
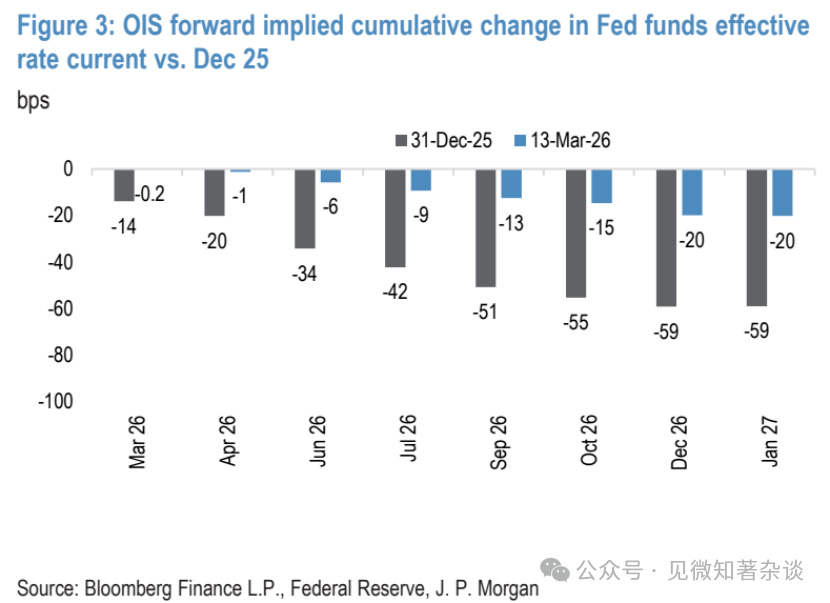
Figure 3: Cumulative change in implied effective federal funds rate (current vs December 2025)
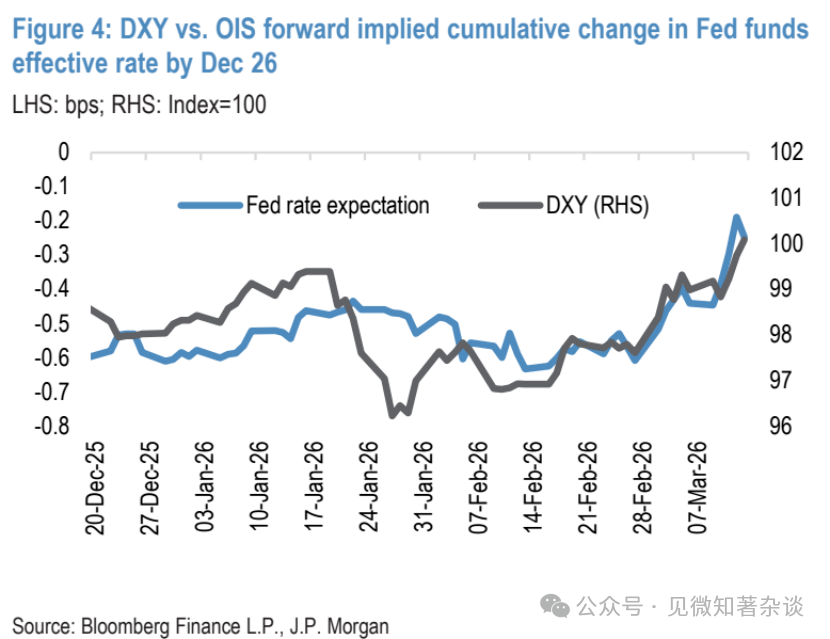
Figure 4: Comparison of the U.S. Dollar Index (DXY) and the cumulative change in implied effective federal funds rate until December 2026
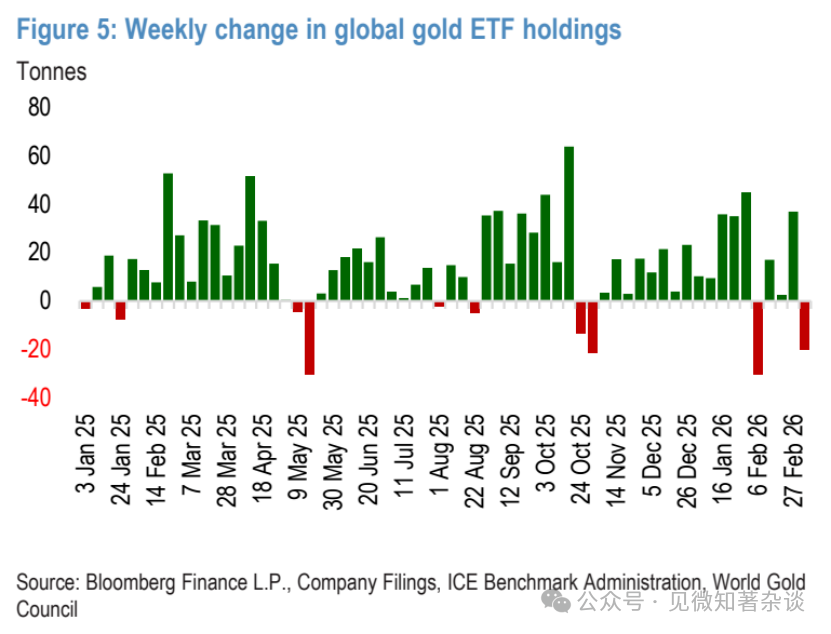
Figure 5: Weekly change in global gold ETF holdings
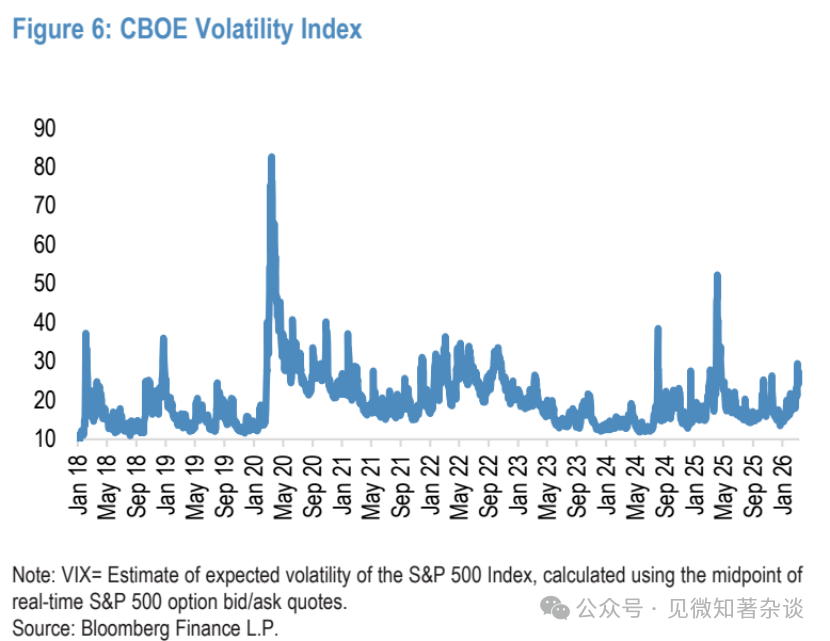
Figure 6: CBOE Volatility Index (VIX)
Gold is not immune to the shock of "sell everything"
When the VIX index is high and rising, gold will initially get caught up in "sell everything" trades.
From a tactical perspective, as the closure of the Strait of Hormuz disrupts energy flows and global supply chains, the longer the disruption lasts, the higher stock market volatility may become. This initial contagion risk is an important structural dynamic for gold.
Generally, during market/stock market pressure periods, this selling dynamic of gold arises from investors' needs to increase portfolio liquidity and raise cash, compounded by additional margin pressure, portfolio rebalancing, and value-at-risk (VaR) shocks, leading to comprehensive de-risking.
The data supports this: Filtering gold's weekly returns across different VIX ranges shows that when VIX is above 30 and rising, gold faces greater resistance during significant contractions in the stock market. In this range, the positive return ratio for gold drops to only 45%, with average weekly returns turning negative, being the only group to experience this.
In the silver market, this risk-off contagion effect is even more pronounced, with silver prices declining about 61% of the time in a high and rising VIX environment, with average weekly declines exceeding 2%. Similarly, in this dynamic, the initial strengthening of the dollar may also play a role, as in the high and rising VIX range, the DXY dollar index has strong asymmetric buying pressure.
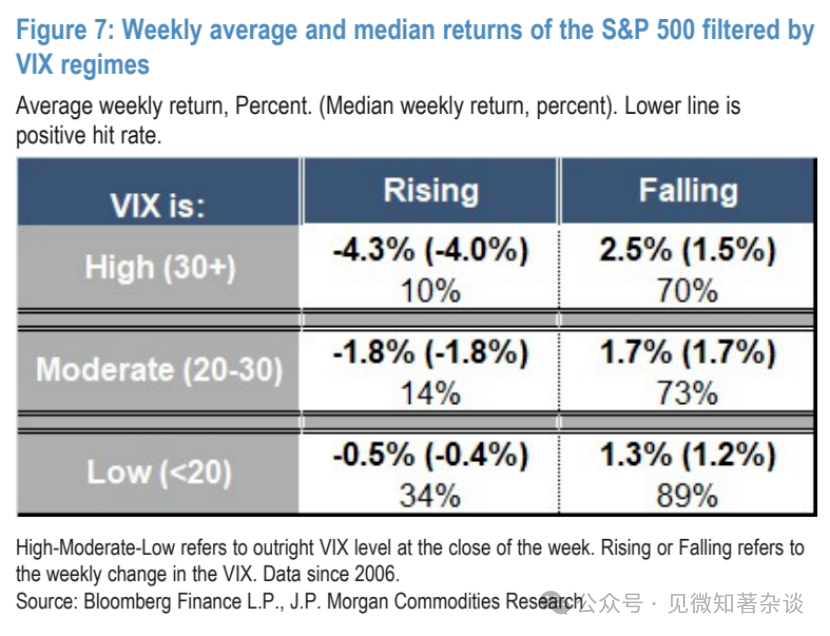
Figure 7: Weekly average and median returns of the S&P 500 index by VIX range
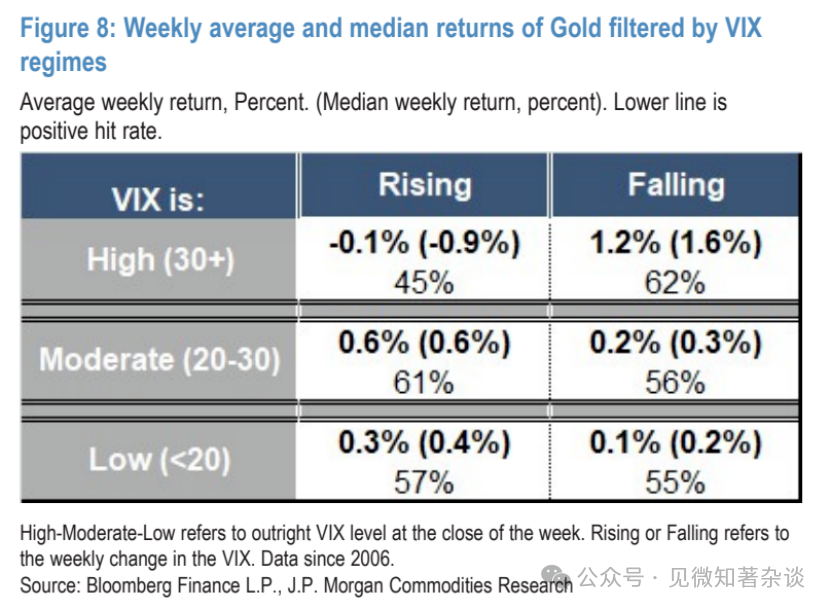
Figure 8: Weekly average and median returns of gold by VIX range
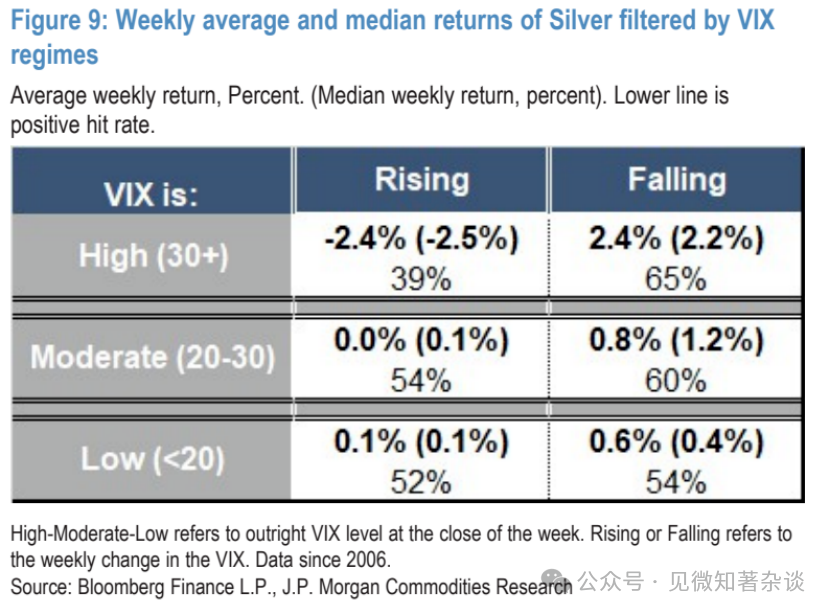
Figure 9: Weekly average and median returns of silver by VIX range
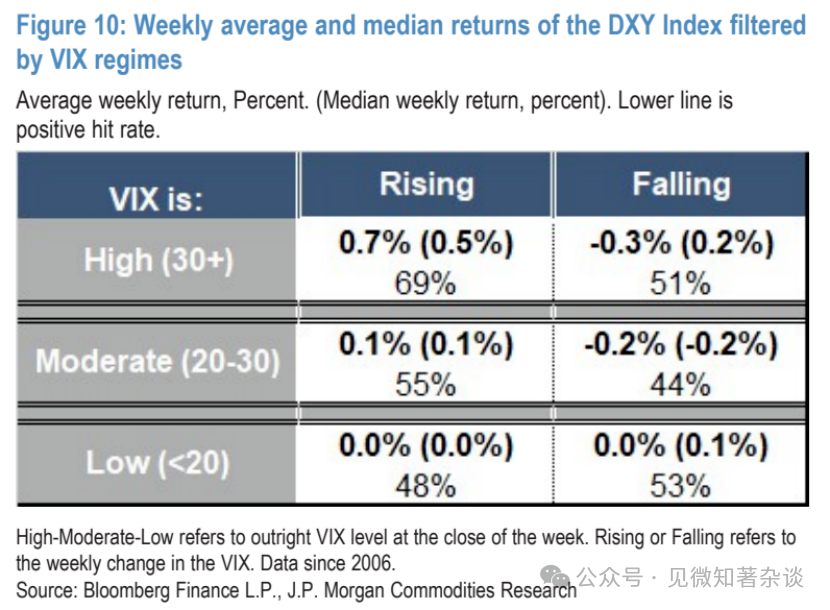
Figure 10: Weekly average and median returns of the dollar index (DXY) by VIX range
Besides the absolute level of VIX, trends are also crucial—gold will switch from the most bearish range to the most bullish range in a high and declining VIX environment.
To study this sequence in more detail, we looked at 25 discrete cases since 2006 when VIX broke into that high range. In the vast majority of cases (excluding the 2008 global financial crisis, 2011, and the 2020 COVID-19 pandemic), VIX rapidly falls below 30 within 10-15 trading days.
Observing the average price trajectory of gold during these phases, typically, during the first few days after VIX breaks 30, selling pressure on gold is the most intense (with an average cumulative decline of about 0.5%), and a rapid and sustained rebound begins on the third day, lasting on average for over a week. In this rebounding process, gold typically recovers pre-break levels on the fourth day and achieves over a 2% peak-to-trough increase by around the tenth trading day.
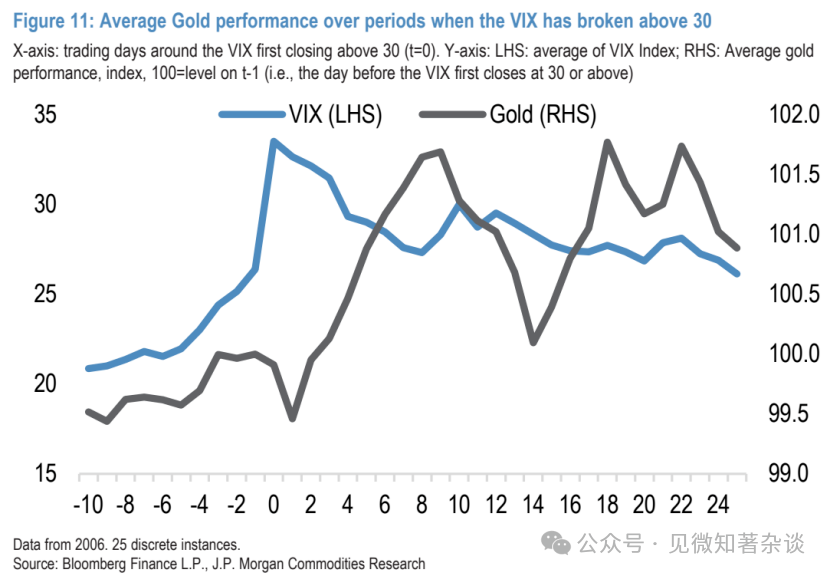
Figure 11: Average performance of gold during VIX breaks 30
Silver's path is similar, but due to higher volatility, initial declines are larger (average -2.5%), and in the rebound window, it typically only recovers to—not exceeds—pre-break levels. Over the longer term, silver is also likely to exhibit a double-bottom pattern, but it tends to be steeper and more persistent compared to gold, especially during the downturns in 2008 and 2020.
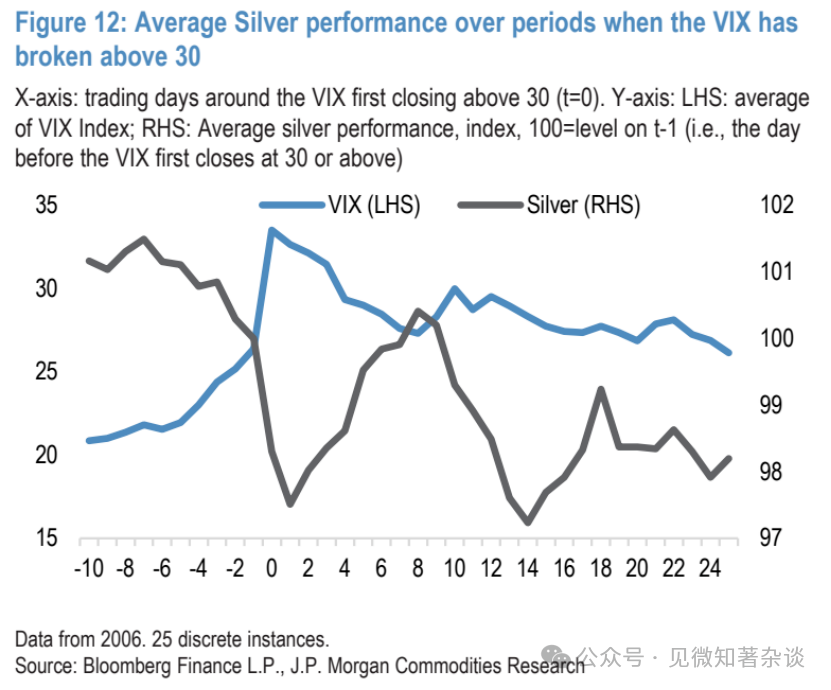
Figure 12: Average performance of silver during VIX breaks 30
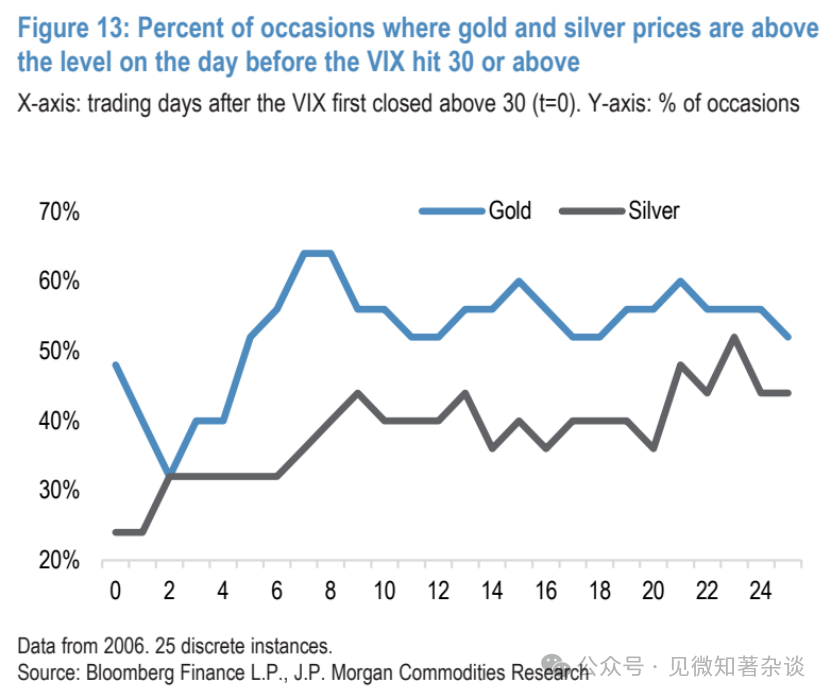
Figure 13: Ratio of gold and silver prices above the level from the day before the VIX first reached or exceeded 30
The higher and longer oil prices rise, the more likely the Fed's response function will turn dovish
Looking ahead beyond short-term tactics, although rising oil prices and climbing inflation expectations/temperate interest rate cut expectations may exacerbate some declines in gold recently, we ultimately believe that in the scenario of a long-term closure of the Strait of Hormuz, gold will rise significantly.
First is inflation—although commodity indices track inflation more closely on a month-to-month basis, gold has remained a relatively stable hedging tool during recent rapid and sustained inflation rises, given the current inflation dynamics under oil price risks.
Since 2000, the U.S. CPI has seen five relatively sustained and significant rises exceeding 2.5 percentage points year-on-year. In four of those cases (excluding the most recent inflation spike after the COVID pandemic), gold recorded double-digit increases. Particularly in an environment where oil price shocks evolve into stagflation, gold remains a key hedging tool.
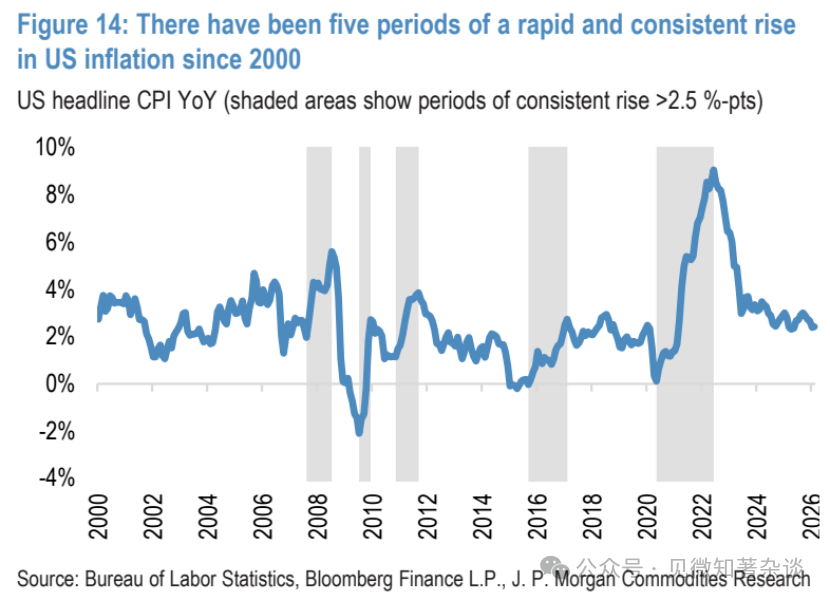
Figure 14: Five periods of rapid and sustained inflation in the U.S. since 2000
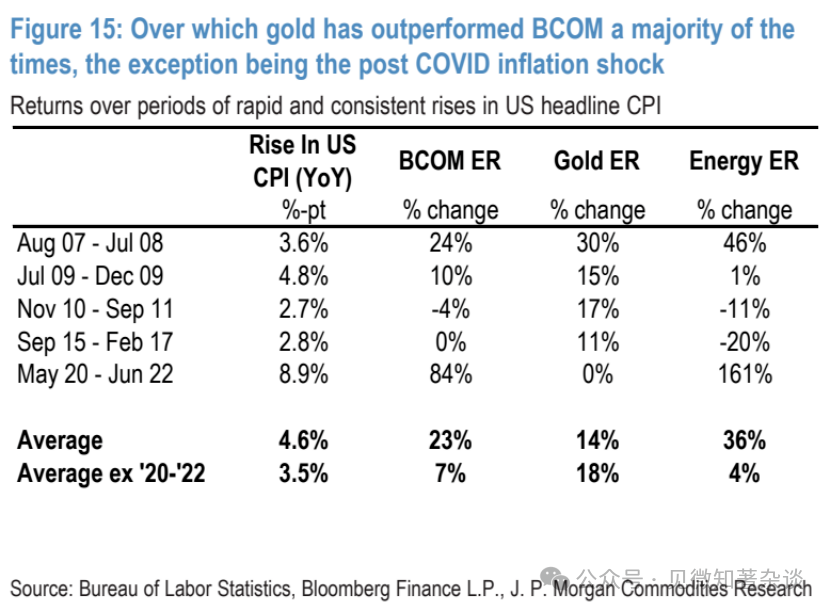
Figure 15: During these periods, gold has outperformed the Bloomberg Commodity Index (BCOM) most of the time, with the only exception being the inflation shock after the COVID pandemic.
Second is the Fed's response function—before next week’s meeting, our economists believe that a moderate rise in oil prices (as currently observed) will prompt the Fed to remain cautious, but if oil prices experience a larger and more sustained increase, they will shift dovish. The higher and longer oil prices remain, the greater the potential nonlinear downside pressure on growth, thereby increasing the drag on employment.
Although this could also lead to greater overall inflation spikes, the transmission to core inflation seems limited. Thus, if oil prices surge to $120 per barrel or higher due to continued actual and expected supply reductions, our economists expect the Fed to lean towards easing, as the risks to economic activity become more pronounced.
IV. Conclusion
Although the de-risking in the past two weeks has somewhat impacted gold, in the short term, gold may still be affected by broader de-risking events, especially if the stock market suddenly incorporates significant and lasting negative shocks to the global economy, leading to liquidity concerns.
Furthermore, as the interest rate market continues to rule out the remaining expectations for Fed rate cuts, gold prices may face further near-term pressure. While we must remain cautious of this potential further sharp drop, if the duration of the disruption extends, and the impacts on inflation and economic growth become larger, we still believe the backdrop for gold will quickly shift to significantly bullish, further amplified by the Fed's rapid shift towards easing.
免责声明:本文章仅代表作者个人观点,不代表本平台的立场和观点。本文章仅供信息分享,不构成对任何人的任何投资建议。用户与作者之间的任何争议,与本平台无关。如网页中刊载的文章或图片涉及侵权,请提供相关的权利证明和身份证明发送邮件到support@aicoin.com,本平台相关工作人员将会进行核查。


