Dear students, I am Sister Qinglan. Today, we won't engage in any superficial talks, we'll dive straight into the core content. Using my TPV three-point verification trading system, I'll break down the current market situation for you clearly. Hold on tight!
Step 1: Look at the big picture (Multi-timeframe trend overview)
Let's start from the larger timeframe and get a handle on the trends across four timeframes.
Daily level: Bullish arrangement, MA5 at 77648.27, MA10 at 77065.60, MA30 at 73190.43, current price at 77150.33, right between MA5 and MA10. This is a typical consolidation pattern. On-chain data shows that the fear and greed index is only 33, which is in the "fear" zone, indicating that market sentiment is not overly enthusiastic. This actually leaves room for the bulls to exert further strength. The total market cap has dropped 2.3% in 24 hours, suggesting an overall outflow of funds, but the daily line stabilizing indicates strong support below. In the news, Bernstein states that "60,000 dollars is a clear bottom for Bitcoin," which provides the bulls with some reassurance.
4-hour level: Bearish arrangement! MA5 at 77207.41, MA10 at 77767.69, MA30 at 77775.70, price at 77150.33, clearly being pressured by the moving averages. This is the timeframe we need to focus on today, as it determines the short-term pullback pressure. On-chain data shows BTC's dominance at 58.12%, indicating funds are still flowing into Bitcoin, meaning altcoins are struggling, which explains why when the market drops, altcoins collapse severely.
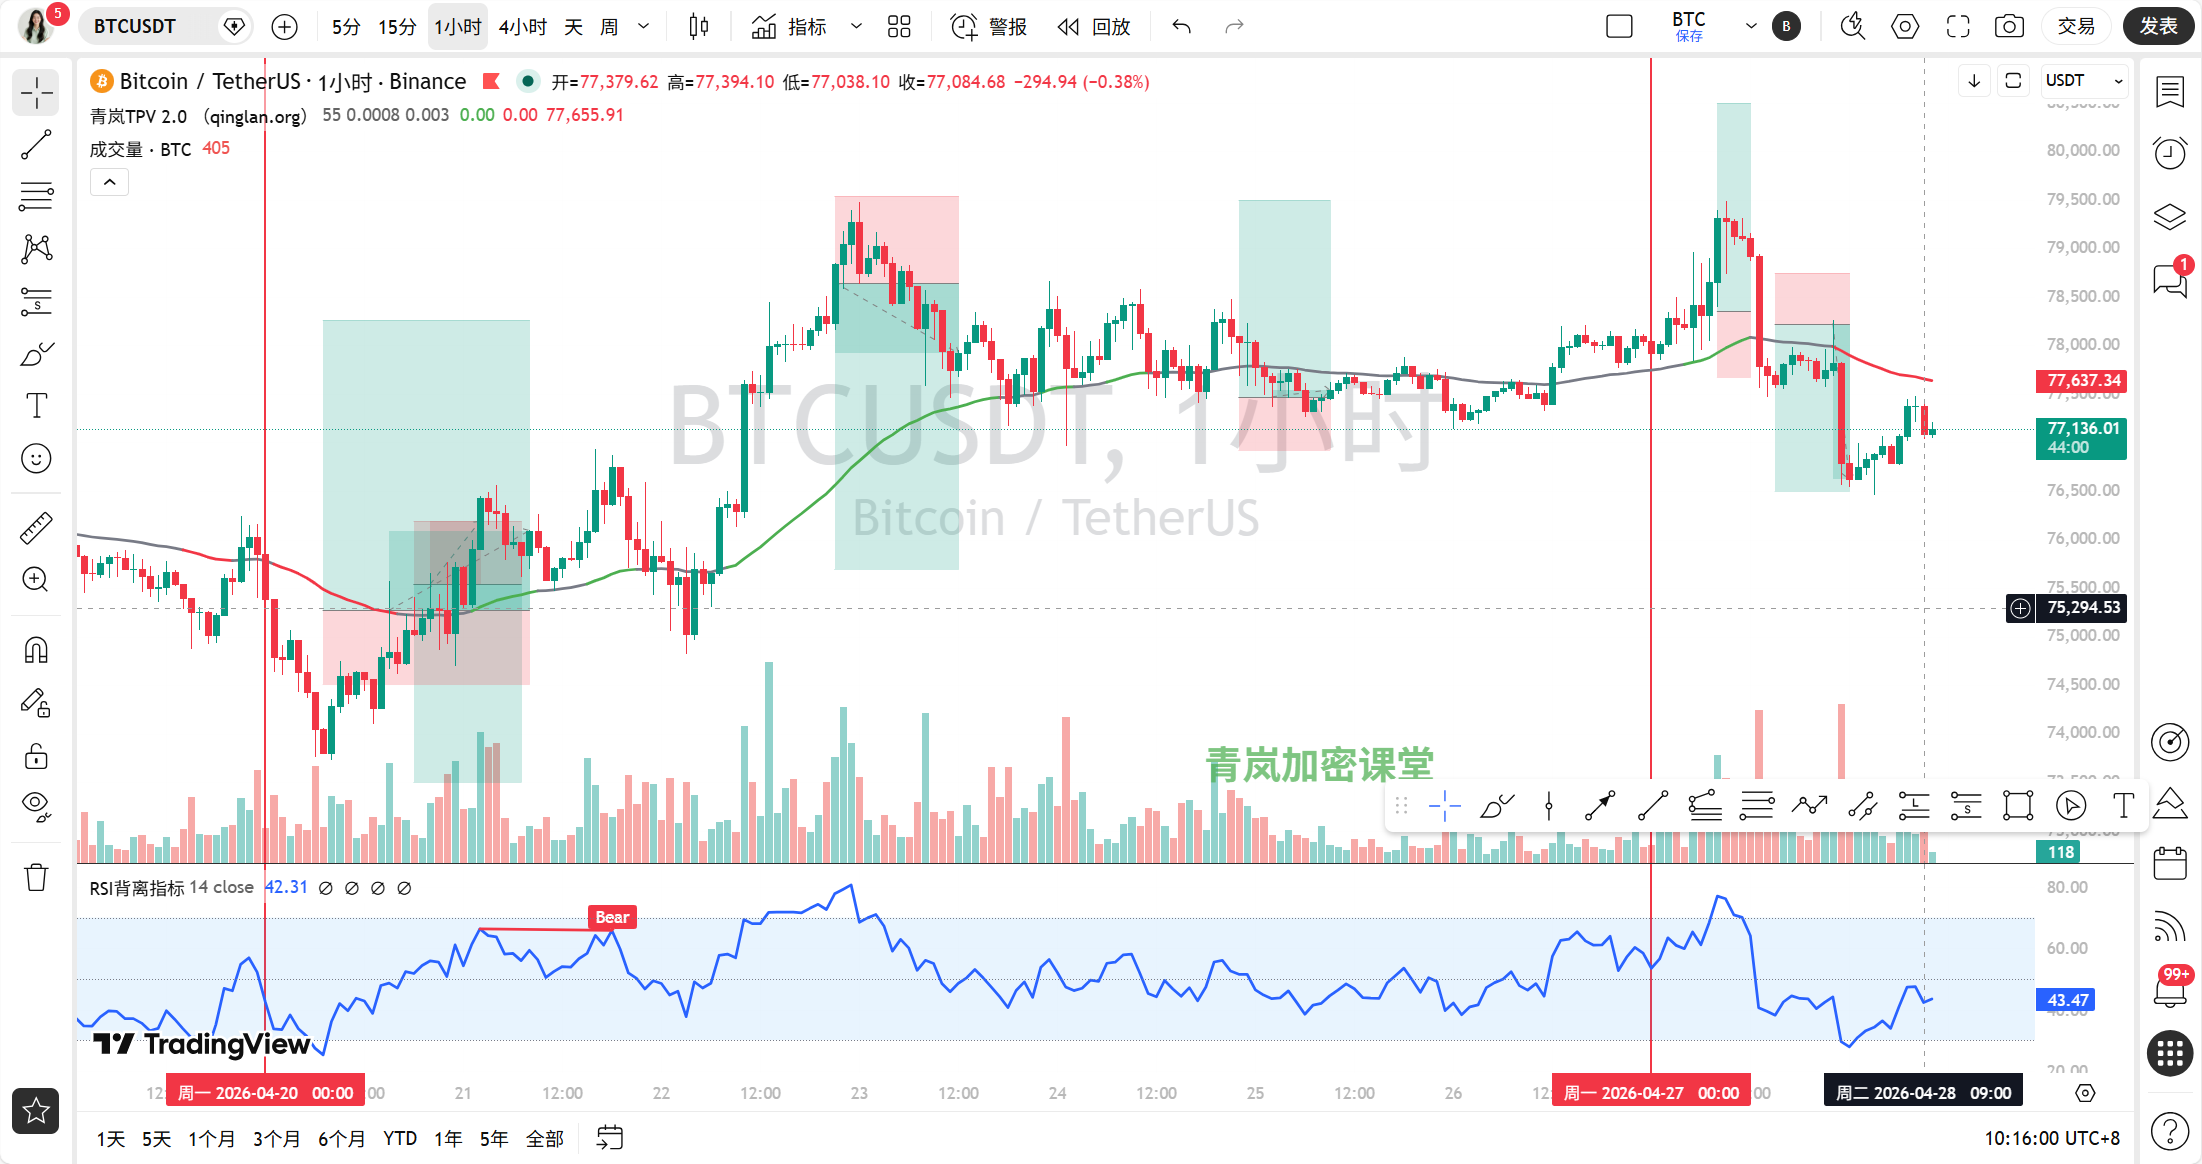
1-hour level: Moving averages intertwined, MA5 at 77210.47, MA10 at 77025.50, MA30 at 77750.91, price at 77150.33, oscillating between MA5 and MA10. Although the MACD is still negative, the bars are shrinking, indicating a depletion of bearish momentum. The RSI is only at 40.81, nearing the oversold area, indicating a short-term rebound is needed. In the news, "BTC whales are closing short positions," indicating that bearish strength is weakening which is good news for the bulls.
15-minute level: Also moving averages intertwined, price swaying around 77150.33, with no clear direction. RSI at 53.94, neutral to strong. This timeframe is used to find precise entry points, and currently, it looks like a consolidation.
Step 2: Find support points, draw key lines (valid highs and lows + trend lines)
Let's find the key support and resistance levels.
Daily: The most important recent valid low is 66010.93 from April 14, confirmed by subsequent rebounds. The valid high is 79485.66 from April 28, confirmed by yesterday's bearish candlestick. Therefore, the key range at the daily level is from 66010.93 to 79485.66. The news "BTC falling below 77,000 triggering long liquidations" coincidently occurred at the beginning of the price retreat from the high, intensifying panic and reinforcing the pressure at 79485.66.
4-hour: The valid low can be seen at 73801.79 from April 24, after which the price rebounded. The valid high is 79485.66 from April 28. From the 4-hour chart, a descending trend line can be drawn connecting the high of 79485.66 on April 28 and the high of 78265.34 on April 29, applying pressure on the price. The valid touches are at least twice.
1-hour: Valid low is at 76564.33 from April 29, formed after a rapid decline. Valid high at 79485.66 from April 28. On the 1-hour chart, we can also draw a descending trend line connecting 79485.66 and 78265.34, similarly restraining the price.
15-minute: Valid low at 76564.33 from April 29, and valid high at 79485.66 from April 28. Short-term support is near 76564.33.
Step 3: Indicators to assist (Technical indicator verification)
Daily: MACD golden cross still intact, DIF at 1941.97, DEA at 1918.76, bars at 23.21, although small, bullish momentum is present. RSI at 60.62, neutral to strong, not yet overbought, indicating there is still room for price increase. The indicators verify the effectiveness of the daily bullish trend.
4-hour: MACD death cross, DIF at -22.96, DEA at 130.37, bars at -153.34, indicating strong bearish momentum. RSI at 48.48, neutral to weak. The indicators verify the effectiveness of the 4-hour bearish arrangement, also indicating significant short-term pullback pressure.
1-hour: Although MACD still shows a death cross, the difference between DIF and DEA is shrinking, with the bars turning from negative to positive at 27.81, indicating depletion of bearish momentum, with a possibility of a golden cross. RSI at 40.81, near oversold, indicating a rebound is needed. The indicators verify that the 1-hour timeframe has rebound momentum.
15-minute: Both MACD and RSI are neutral, with no divergence signals.
Step 4: Bulls vs bears (News + On-chain data)
News:
Positive factors:
“Bernstein: 60,000 dollars is a clear bottom for Bitcoin, structural long bull is expected” — Institutions are bullish, bringing confidence to the market.
“Strategy increased holding by 3,273 BTC last week, average holding price at 75,000 dollars” — Institutions show confidence, buying at real prices.
“BTC whales closing short positions, funds continuously flowing back to repair” — Bearish strength weakened.
“Bitcoin's volatility hits a new low, institutions quietly lay out bullish structures” — Smart money is at work.
Negative factors:
“BTC falling below 77,000 triggering long liquidations, Middle East situation and super central bank week approaching” — Macro uncertainty triggering panic.
“Whales using 40x leverage to short BTC, setting bearish orders down to 70,000 dollars” — Large players are betting on a decline.
“Bitcoin plummets below 77,000 dollars, currently reporting 76911 dollars” — Short-term panic sentiment.
Core factors: In the short term, negative factors (macro risks + liquidations) dominate this wave of decline, but in the medium to long term, positive factors (institutional increase + whale position closing) provide bottom support. The technical and news fronts are diverging in the short term; the technicals indicate a need for rebound while the news is bearish, hence the market is moving uncertainly.On-chain data:
Fear and Greed Index at 33 (Fear): Market sentiment is pessimistic, but often "when others are fearful, I am greedy," which could signal a bottom area, forming a divergence with the daily bullish trend, indicating that the major players may be washing the market.
BTC dominance at 58.12%: Funds are concentrated in Bitcoin, altcoins have poor liquidity and are prone to volatile trading.
Total market cap down 2.3% in 24 hours: Overall funds are flowing out, but Bitcoin's decline is relatively small, indicating some funds are protecting the price.
Technical and on-chain data: The short-term technicals (4-hour bearish) resonate with the on-chain data (fear sentiment), indicating a pullback. However, the medium to long-term technicals (daily bullish) diverge from the on-chain data (fear sentiment), which often signals an upcoming trend shift.
Step 5: The path of least resistance (Trading strategy)
In summary, the current market situation is a bullish outlook on a large timeframe, with a bearish pullback in a consolidation pattern on a small timeframe. The path of least resistance is "down first, then up," or "range-bound consolidation." Our trading mindset is to "sell high, buy low," or wait for a pullback to key support levels to go long.
Key entry area: Wait for the price to pull back to near the support levels at the 4-hour level, such as between the daily MA10 (77065.60) and the low from 4 hours ago (76564.33), that is in the 77000-76500 range. If the price stabilizes here and shows a 15-minute reversal signal (like bottom formation + MACD golden cross), we can take a small position to go long.
Stop-loss consideration: If entering a long position, the stop-loss can be set just below the low of April 29 at 76564.33, for example at 76450. If this position is breached, it suggests a continuation of the short-term bearish trend and the long position should exit.
Target area: The first target is the pressure level of the descending trend line on the 1-hour chart, approximately around 78000-78200. If we break through this, we will look at the pressure level on the 4-hour chart, which is near the previous high of 79485.66.
Step 6: How will today unfold (Market prediction)
Current (within a few hours): Expectation is for oscillation in the small range of 77000-77500, waiting for a directional choice. The 15-minute level may see a slight rebound first, but the strength will not be too strong.
Key for today and the near future: The most important support level today is 76564.33 (the low of April 29). If this is breached, it may test 76000 or lower. The most important resistance level is 78265.34 (1-hour descending trend line). If broken, the short-term bulls may get some relief.
Trading mindset: The best trading direction today is "waiting." Do not chase up and down. If the price can drop to the 77000-76500 range and shows a stop-loss signal, a small position can be taken to go long. If the price rebounces to around 78000-78200 and shows a signal of stagnation, a small position can be taken to go short. However, the overall strategy remains to go long at dips, as the larger timeframe is bullish.
Summary: In short, the current core conflict in the market is between the "bullish trend on a large timeframe" and the "pullback pressure on a small timeframe," with the market waiting for a clear signal to break the deadlock.
Trading golden quote: When the fears of whales turn into short positions, the smart hunter sows the seeds of hope in the soil of panic.
[Qinglan's personal opinion]
Students, the worst thing in trading is to be led by short-term fluctuations. You see this market, it has been declining for a few days, and various panic news arises, such as "whales are shorting 40x," "long positions liquidated." But let's look back at the daily line, has the trend changed? No. Institutions are still buying, and there are still people supporting the bottom. So, don't panic when it drops, and don't chase when it rises. What we need to do is to wait patiently like a hunter for our "three-point verification" signal to appear, and then pull the trigger. Remember, trading is not about who runs faster, but about who lives longer, who has more patience.
This TPV system is something I have honed over the years of monitoring, reviewing, and practically trading. I can’t say it’s 100% accurate, but it at least gives us more confidence at key positions. If you want to be the first to capture the latest entry opportunities based on the TPV system, welcome to visit the Qinglan Crypto Classroom official website at www.qinglan.org, see you in class!
免责声明:本文章仅代表作者个人观点,不代表本平台的立场和观点。本文章仅供信息分享,不构成对任何人的任何投资建议。用户与作者之间的任何争议,与本平台无关。如网页中刊载的文章或图片涉及侵权,请提供相关的权利证明和身份证明发送邮件到support@aicoin.com,本平台相关工作人员将会进行核查。