Title: AICoin
Macro Economic Data and Events:
Last week, the more significant events affecting our cryptocurrency market were the compensation in Mentougou and the series of sell-offs and transfers by the governments of Germany and the United States. This week, we need to continue to pay attention to whether there will be further fermentation and impact. Additionally, the following data and events this week may require our increased attention:

① Monday, July 8th, after the SEC postponed the approval of the ETF last week, it requested the Ethereum ETF issuer to resubmit the S-1 form before July 8th; (There are reports that the spot Ethereum ETF may be launched within two weeks, but it is not yet clear how quickly the SEC will process it.)
② Tuesday, July 9th, Federal Reserve Chairman Powell will deliver semi-annual monetary policy testimony to the Senate Banking Committee;
③ Thursday, July 11th, US CPI for June;
④ Friday, July 12th, US PPI for June and monthly rate.
At that time, we will provide some detailed interpretation and sharing in the DC community member group, and seize the opportunity to discover some potential trading opportunities.
Data Analysis:
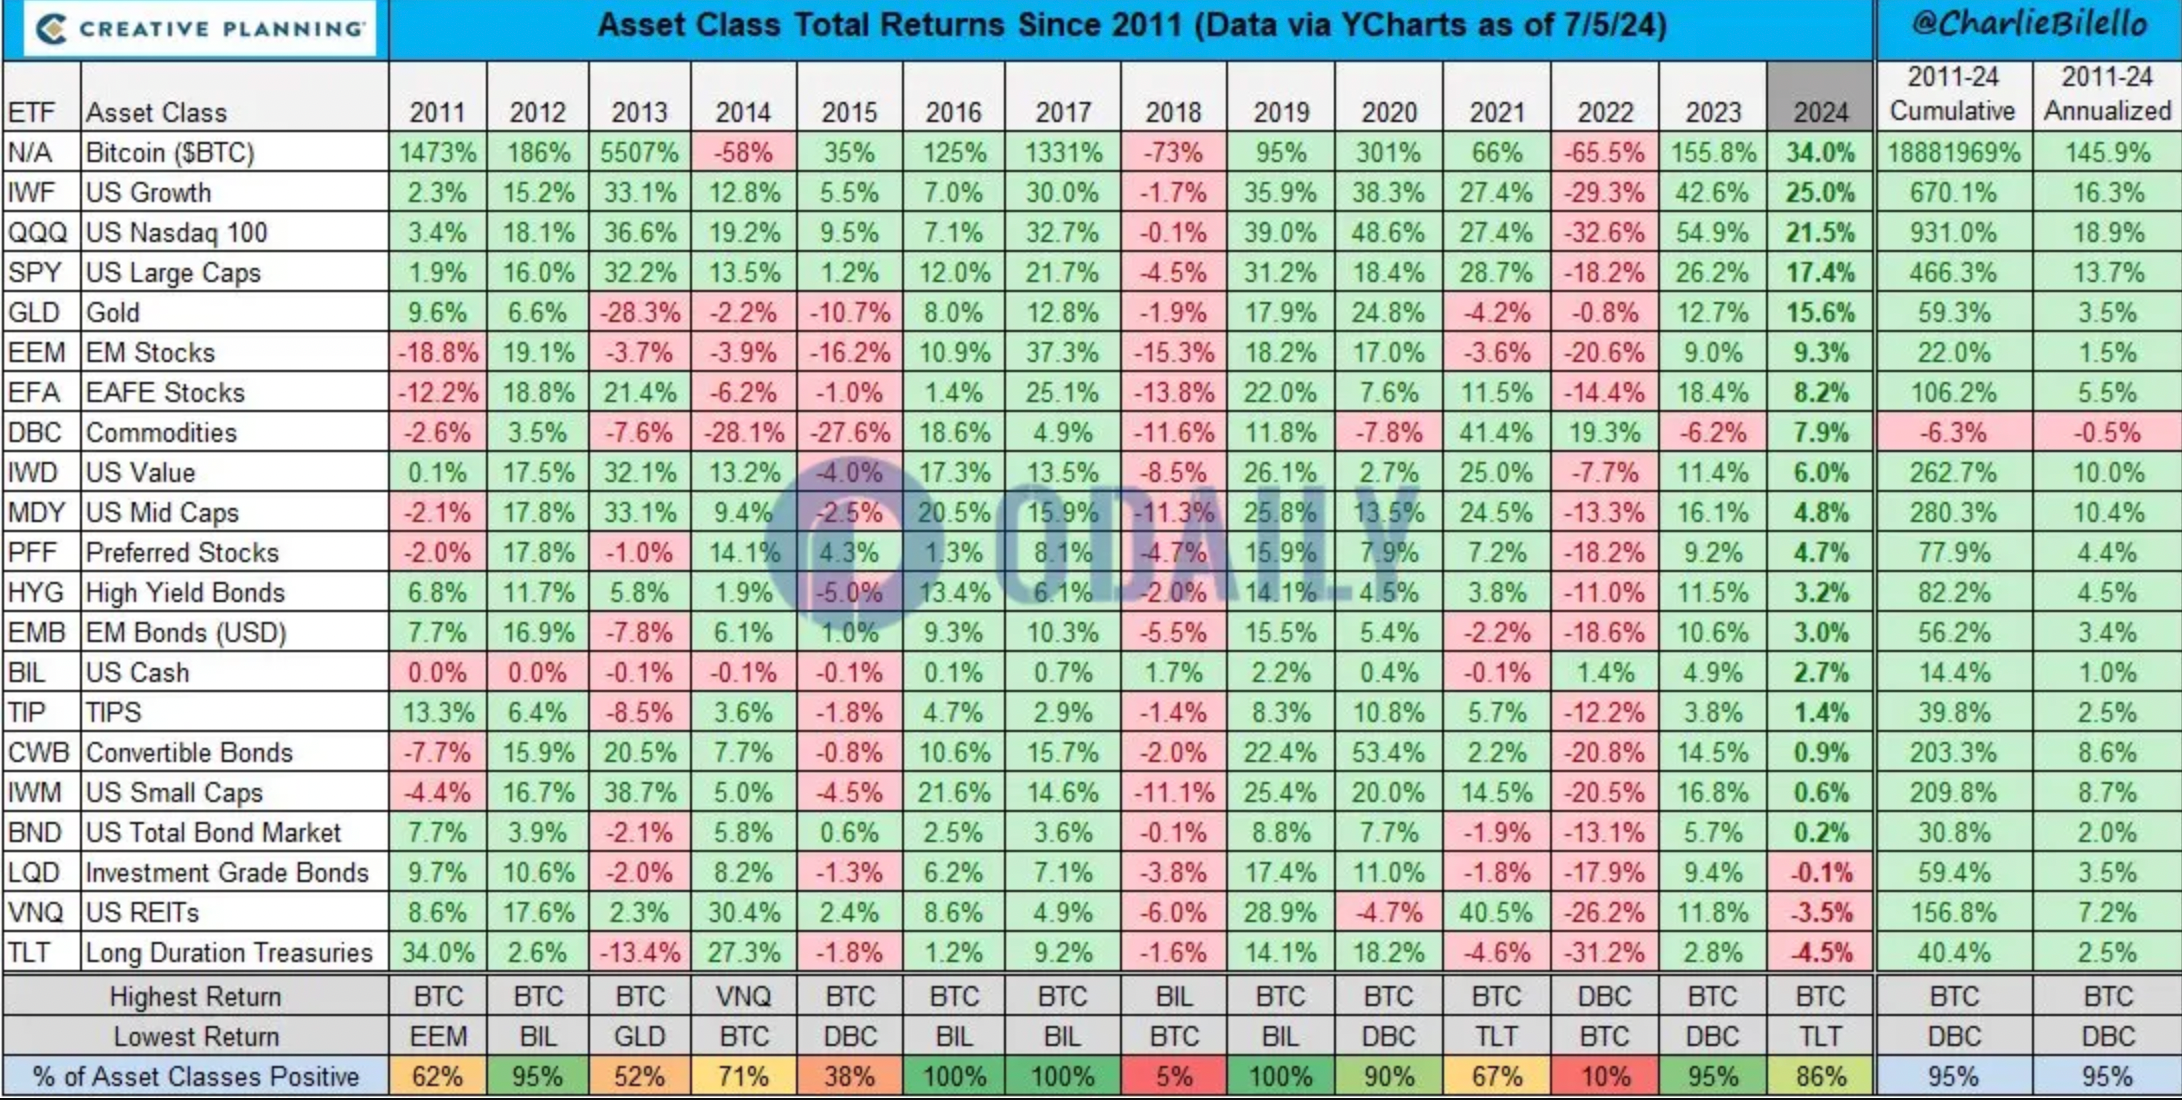
Bitcoin has had an average annual increase of 145.9% since 2011, making it the best-performing asset globally!

① MicroStrategy, the world's largest holder of BTC, its founder Michael Saylor reaffirmed his bullish view on Bitcoin after this recent decline, claiming that BTC is designed to surpass traditional investment products.
② He compared the price performance of various asset categories globally over the past thirteen years, including Bitcoin, US growth, Nasdaq 100 Index, gold, emerging market stocks, commodities, emerging market bonds, convertible bonds, the entire bond market, and long-term government bonds.
③ Bitcoin has remained the best-performing asset since 2011, with a cumulative increase of 18881969% and an average annual increase of 145.9%, ranking first. The average annual increases of other important assets are: US growth stocks (16.3%), Nasdaq 100 Index (18.99%), US large-cap stocks (13.7%), and gold (3.5%).
④ It can be seen that holding BTC for the long term is likely to outperform the popular investable assets in the market; however, there have been years such as 2014, 2018, and 2022 when BTC's annual increase was negative, so long-term holding is not a one-time solution and requires a reasonable position to enter, and selling at relatively high levels to gain the price difference. Therefore, everyone can pay more attention to our DC community member group, where there will also be related content on medium- to long-term layout strategies.
Technical Analysis:
Weekly Chart:

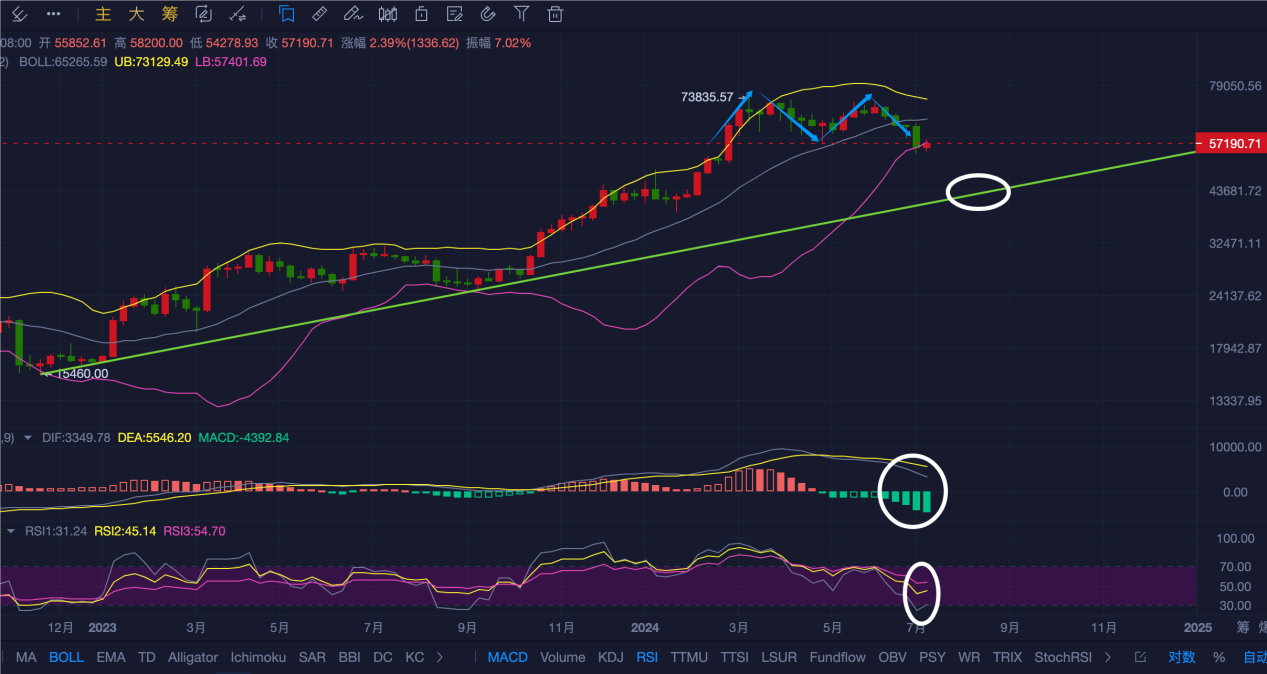
① The weekly candlestick closing price fell below the neckline near $56550, establishing a weekly M-top pattern;
② The future downside targets for the weekly double top are near $48000 and $41000, close to the support of the uptrend line since the end of 2022, around $41500-$44500;
③ The Bollinger Bands are contracting, and the candlestick is near the lower Bollinger Band, providing some support;
④ The RSI indicator's short-term parameters are approaching oversold levels, with all three periods turning upwards, perhaps indicating a possibility of a rebound;
⑤ The MACD indicator maintains a bearish crossover, with the bearish momentum still increasing, and the trading volume is close to the level seen in early January 2022, when a significant rebound occurred;
Daily Chart:

⑥ The lowest point of this decline is near $53485, which is a potential support level near the lower boundary of the wedge-shaped downtrend channel on the daily chart;
⑦ The low point of this phase is also close to the upper edge of the high-volume area around $50500-$53000, which formed a continuation pattern during the uptrend in mid to late February;
⑧ Since the drop from $72000, there have been two rebounds above $53000, and the potential resistance above is the Fibonacci 38.2% level near $60560, which is also an important area of the previous oscillation range of $59000-$60800 and resonant resistance of the Vegas channel;
⑨ In the short term, the MA200 on the daily chart near $58760 has acted as a resistance, leading to two pullbacks;

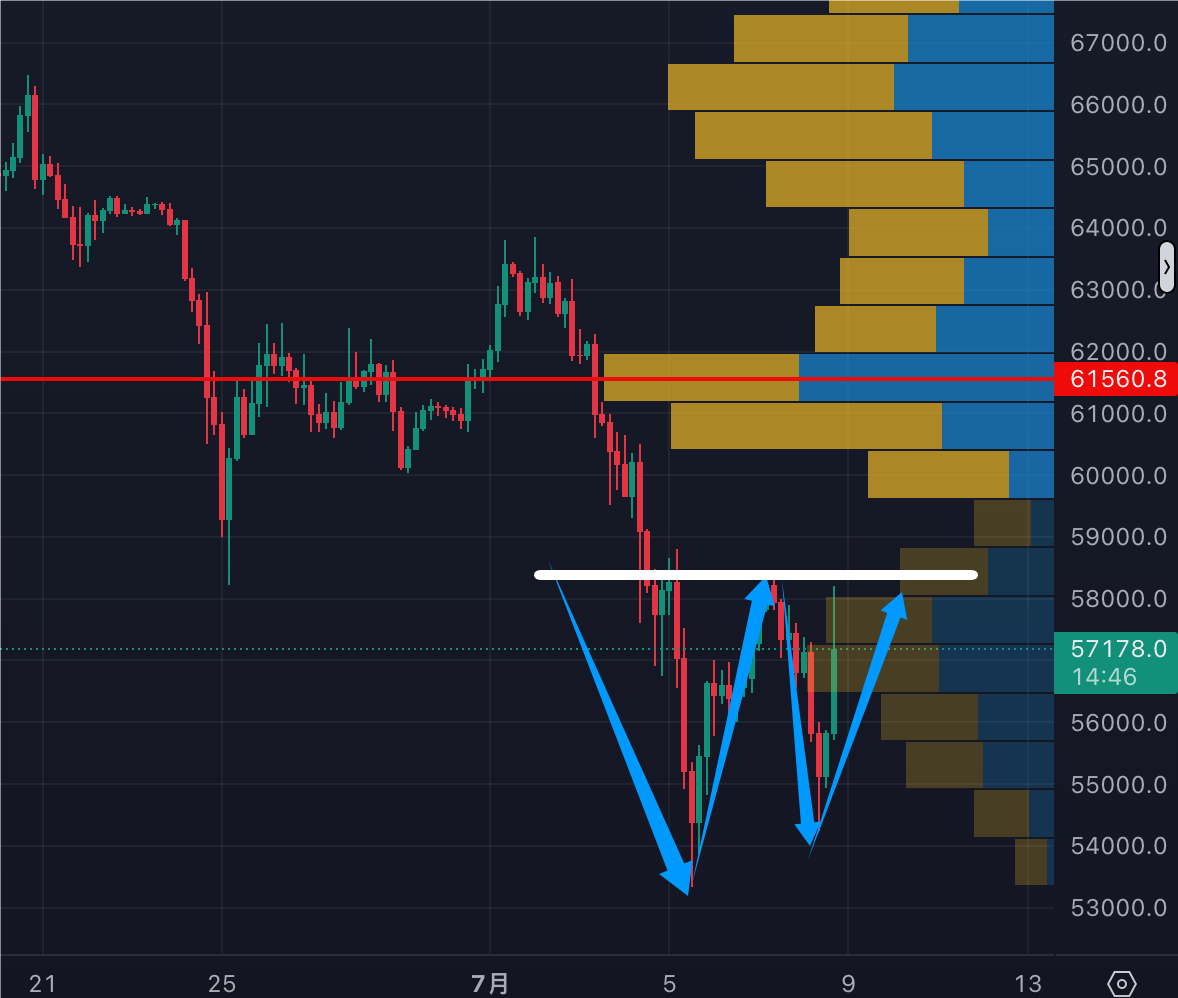
⑩ There is a potential formation of a double bottom pattern on the four-hour chart. If it effectively breaks through the neckline near $58475, a potential W-bottom will be established, leading to a higher rebound.
⑪ Looking at the volume and price distribution on the four-hour chart, the concentrated control point of the chips above is near $61560, which can be considered a resistance level. Due to the recent thin trading orders, there is no obvious short-term support below.
⑫ The Heikin Ashi Fork Line on the four-hour chart shows that the current upper resistance levels are near $59900 and $62400.
⑬ In summary, there is strong resistance to rebounds above, with potential support near the previous high-volume area and technical channel below. The weekly double top pattern indicates a bearish technical outlook. It is advisable to prioritize the strategy of shorting in batches to the resistance level during rebounds. If it reaches the technical level below, it is also possible to attempt speculative buying on the left side, but holding for too long is not advisable.
Follow us: AICoin
免责声明:本文章仅代表作者个人观点,不代表本平台的立场和观点。本文章仅供信息分享,不构成对任何人的任何投资建议。用户与作者之间的任何争议,与本平台无关。如网页中刊载的文章或图片涉及侵权,请提供相关的权利证明和身份证明发送邮件到support@aicoin.com,本平台相关工作人员将会进行核查。


