Macro News Interpretation:
① This week, macroeconomic data is relatively light and not considered major. The only noteworthy events are the release of the US ISM non-manufacturing index for July on Monday evening, the Bank of Japan's summary of the July monetary policy meeting on Thursday, and the initial jobless claims on Thursday. Additionally, there will be intensive speeches by Federal Reserve officials, such as the Chicago Fed President on Monday, the San Francisco Fed President on Tuesday, and the Richmond Fed President on Friday. Recently, there has been much attention on the topic of the US economic recession, so it is important to pay attention to the statements made by Federal Reserve officials regarding this and monetary policy, as it will also affect the global market.
② The reason for the recent market decline can be attributed to breaking the upward trend line since the US Federal Reserve interest rate decision last week, as well as the panic about the US economic recession and the peak of the US stock market. This was amplified after the release of the non-farm payroll and unemployment rate data on Friday evening. I have been repeatedly warning about the peak of the US stock market in the community since mid to late July, and the US stock market and the cryptocurrency market have been almost identical in their major highs and lows since 2020. This can also serve as a leading indicator, allowing for early exit from the peak.
③ The continued decline this morning is also attributed to geopolitical factors, including a series of military movements in Iran, Lebanon, and Israel, as well as the global decline in risk assets triggered by Japan's interest rate hike. After the Japanese stock market triggered a circuit breaker following its early opening, the Australian stock market experienced its largest single-day decline in two years. The concept of US stocks and cryptocurrencies experienced an expanded decline in the night market, and the cryptocurrency market also saw a general decline.
Data Analysis:
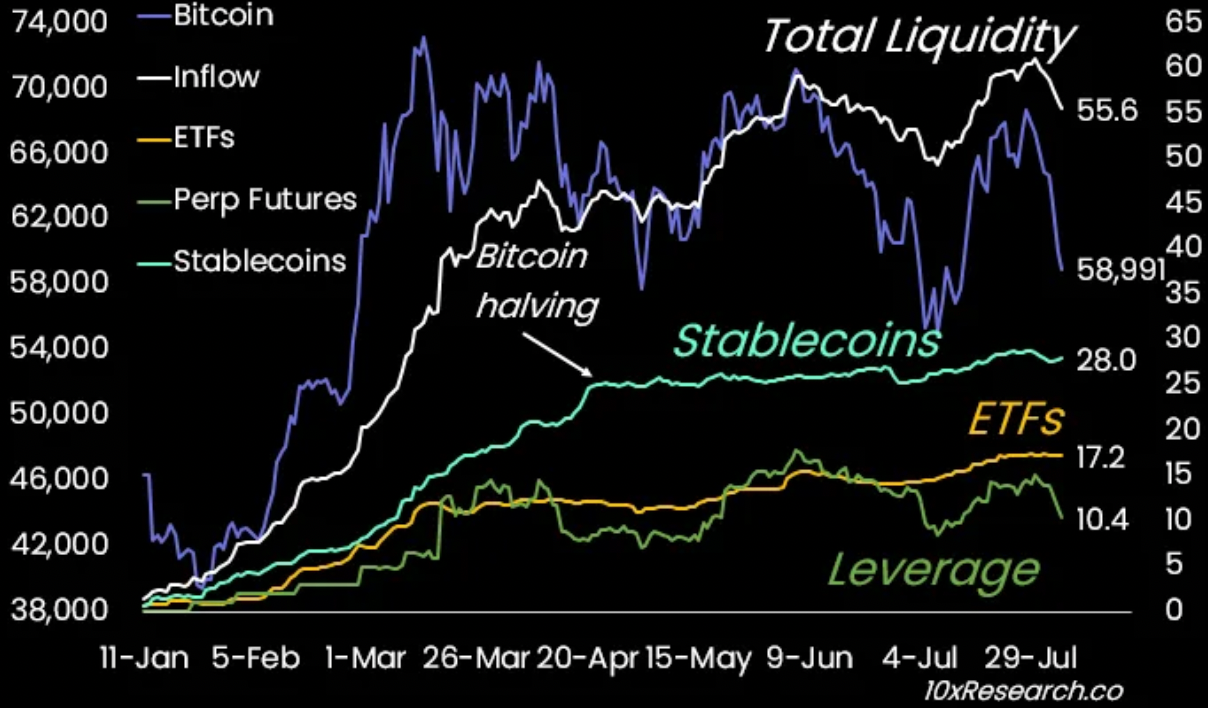
10x Research Report: Predicts the high point of the Bitcoin cycle to be $62,000 based on the stock-to-flow model.
① Here, I will briefly introduce the S2F model, which was released by PlanB as a Bitcoin valuation model. S2F is a price prediction based on the scarcity of BTC over time, and there is a power-law relationship between S2F and the price of Bitcoin. The specific formula is BTC price = 0.4 * S2F^3 (where S2F = 1/inflation rate).
② The latest report from 10x Research sets the target price for Bitcoin in 2024 at $70,000 and anticipates a fluctuation range of $60,000 to $70,000 based on its S2F model. At the same time, it predicts that the long-term return rate based on its S2F model will gradually decrease, with the expected cycle high point at around $62,000.
③ The report also mentions macro factors. Although institutional investors are showing increased interest in Bitcoin ETFs, and the market is experiencing price stability when facing events such as the return of a large amount of Bitcoin from Mt. Gox, the weaker-than-expected US economy, the weakness of the ISM index, and the pressure on risk assets are difficult for the Federal Reserve to reverse, despite hinting at a rate cut in the fall.
④ The report mentions that if the US economy continues to deteriorate, leading to expectations of a market recession, this will cause significant declines in the stock market over the next few quarters. In this scenario, the price of Bitcoin may face selling pressure, with the possibility of falling below $50,000 or even lower.
Technical Analysis:
BTC Technical Analysis
Weekly Level:
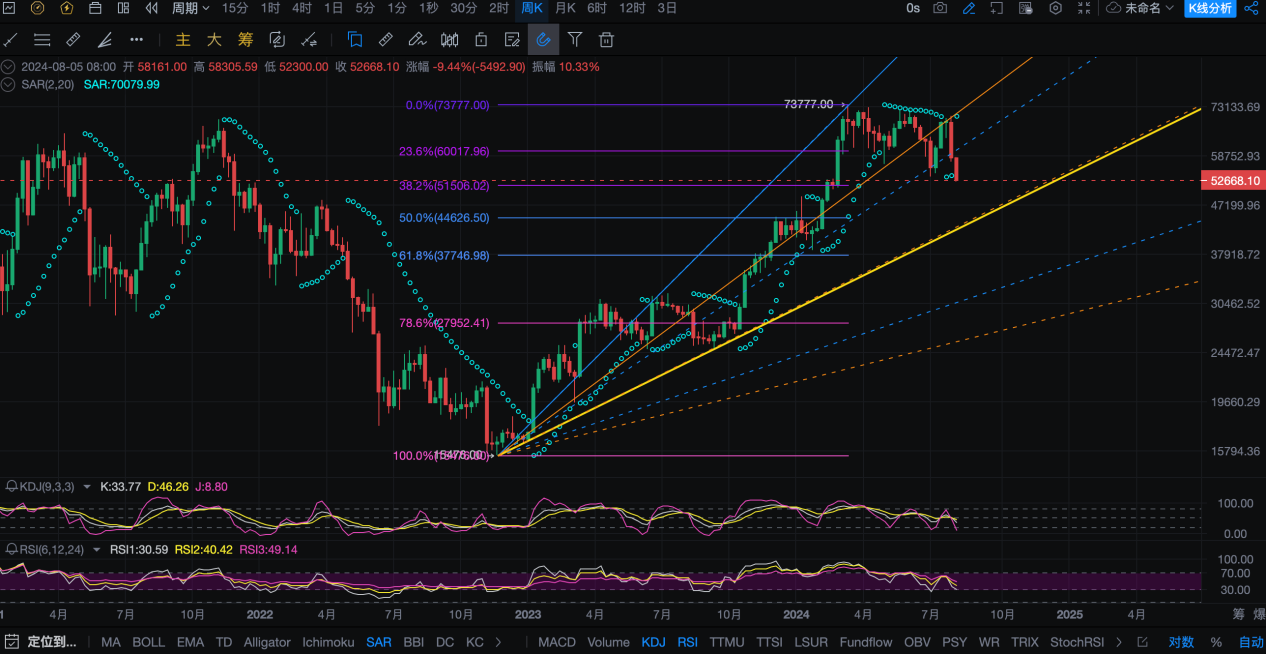
This week, the weekly BTC K-line fell below the previous low of $53,500 in July, marking a significant decline to a new low since mid to late February. The bearish momentum is strong, and we will analyze the key support levels below by combining indicators and trend lines.
After the weekly closing, the SAR indicator has once again turned into a bearish trend this week, with the reversal position currently showing near the high point of this round at $70,079. As long as the SAR indicator continues to move downward without breaking through the previous high, the bearish trend will be maintained.
From the Fibonacci sequence perspective, this round of decline has fallen below the 38.2% retracement support level near $51,500, which was the support level during the previous bull market. The major support levels below are around 50% and 61.8%, near $44,625 and $37,747, respectively.
Drawing the speed resistance line on a logarithmic scale, after reaching the first resistance line (blue dashed line) in early July and rebounding, the price has now fallen below it this week. It may test the second wave of speed resistance line (orange dashed line) below.
This also coincides with the upward trend line since the low point of the previous bull market at $15,476 (yellow solid line), currently near $42,500 to $45,000. This is also a Fibonacci resonance support level.
The KDJ indicator shows that the J value is rapidly declining, indicating a risk of further downward probing in the short term. It has already fallen into the oversold zone, but when combined with the RSI indicator, it has not yet reached the oversold area. Using both indicators together will provide a more accurate judgment.
Daily Level:
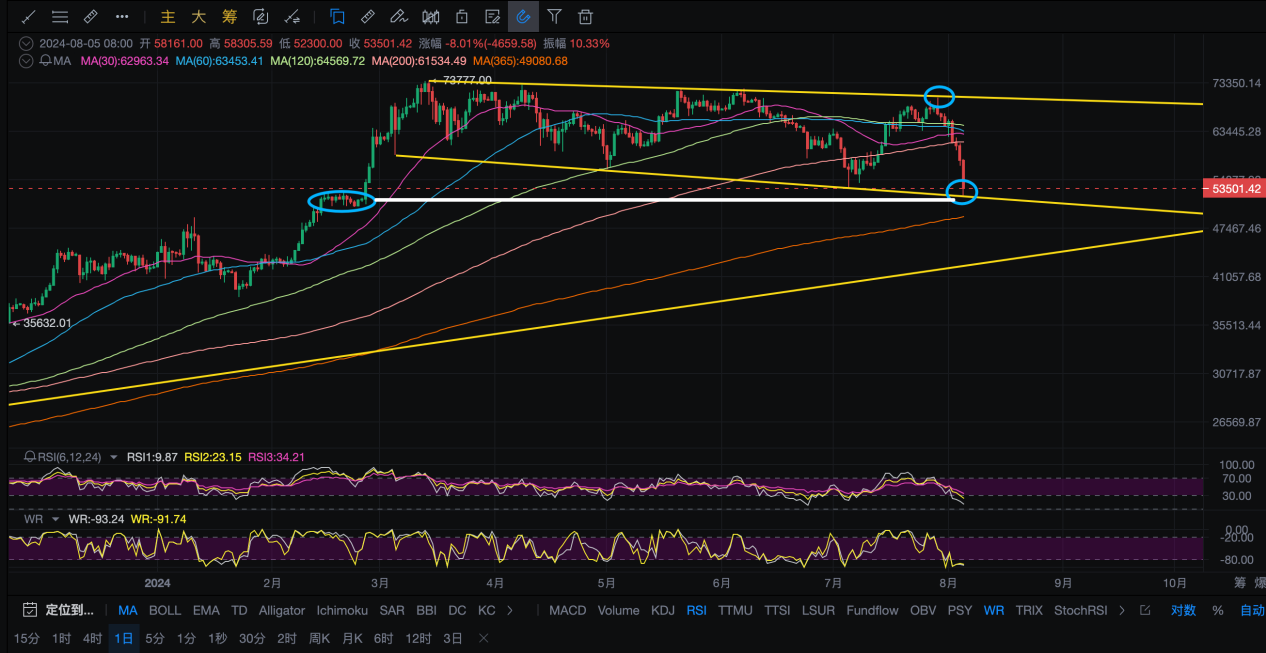
Looking at the daily chart, the price is still within the channel. After reaching the upper resistance of $70,000 in this round, it has fallen to the lower support near $52,000. This area is also close to the lower edge of the candlestick trading volume cluster around $50,500 to $53,000, which was the mid-February continuation adjustment.
The daily chart has consecutively fallen below the MA30/60/120/200 moving averages, especially the MA120 and MA200, which were important bull-bear dividing lines in the past. After breaking through these levels, the market sentiment will become relatively more fearful. The next support level is the annual line support, currently near the MA365 at around $49,080.
The fear and greed index is currently around 26, which is the second lowest point since January this year. Previously, around the low point of 25 in January, there was a strong rebound in the market.
The RSI fast line and the midline have entered the oversold zone, and the slow line is gradually approaching oversold. In addition, the Williams %R indicator has entered the oversold zone. After a short-term adjustment, there may be a demand for a rebound, but the strength of the rebound needs to closely monitor changes in market sentiment and news.
The short-term resistance above is around $56,500, which is the low point of the May decline and the starting point before the Trump assassination attempt. The strong resistance is around the rebound high of $62,200 over the weekend and the breach point of the current upward trend near $65,660. Shorting on the rebound is the priority.
Four-Hour Level:
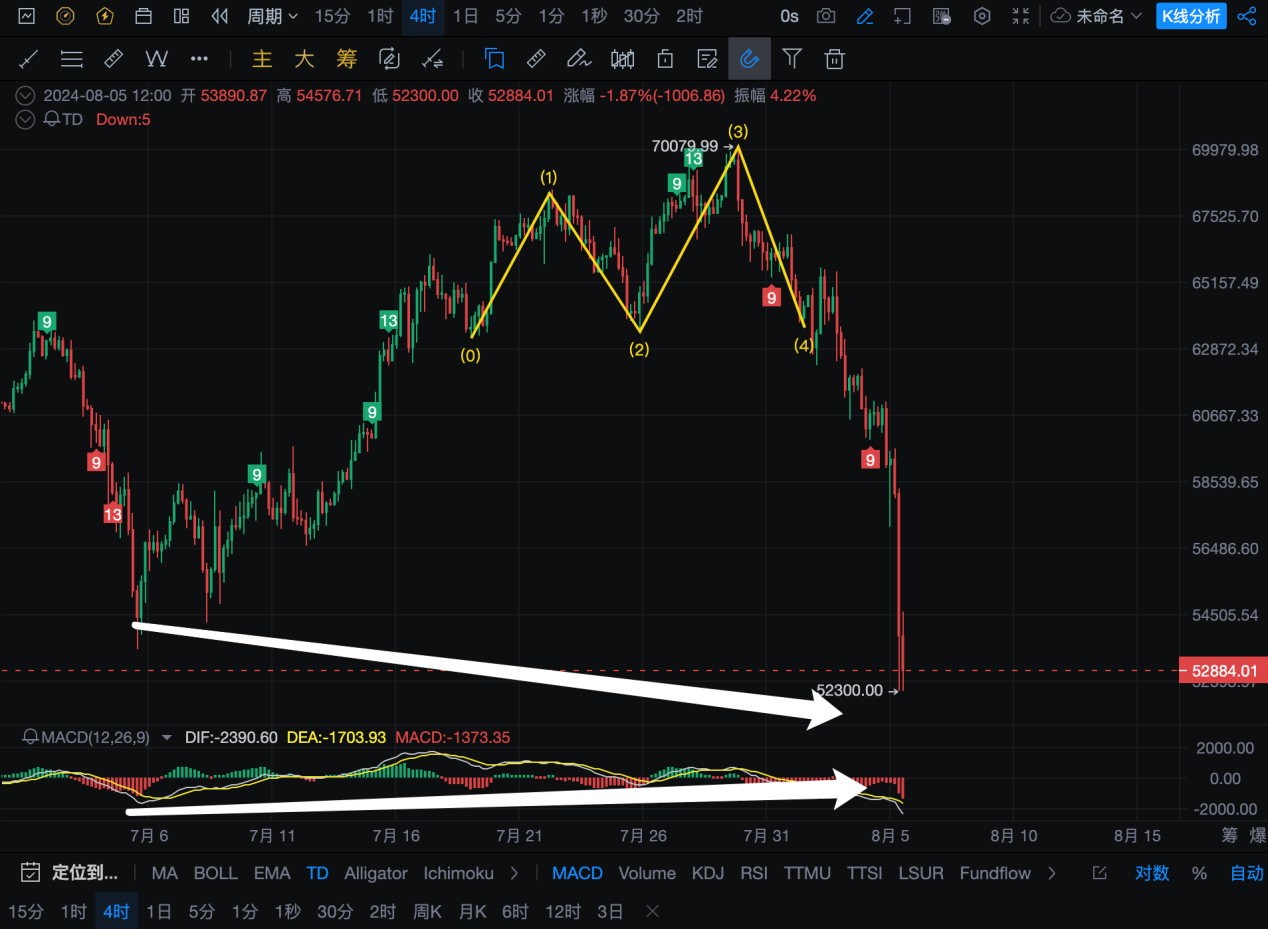
Looking at the four-hour chart, after breaking the neckline of the 2B top pattern near $63,450 last week, there has been a continuous rapid decline, with almost no pause in between, more influenced by external market factors.
In this round of decline, when the TD sequence consecutively showed two 9-turn signals without stopping the decline, and the rebound was small, the probability of a rebound will increase when the 13-turn or the third 9-turn signal appears. At that time, we will seek opportunities to buy on the left side.
The short-term resistance above is around $55,200, the morning rebound high, and the previous platform near $56,500. The medium-term resistance is around the neckline of the 2B top pattern and the Vegas channel near $63,450.
The MACD has shown signs of bullish divergence. It is expected that after the repair and the formation of a golden cross, there will be a certain degree of rebound in the later period.
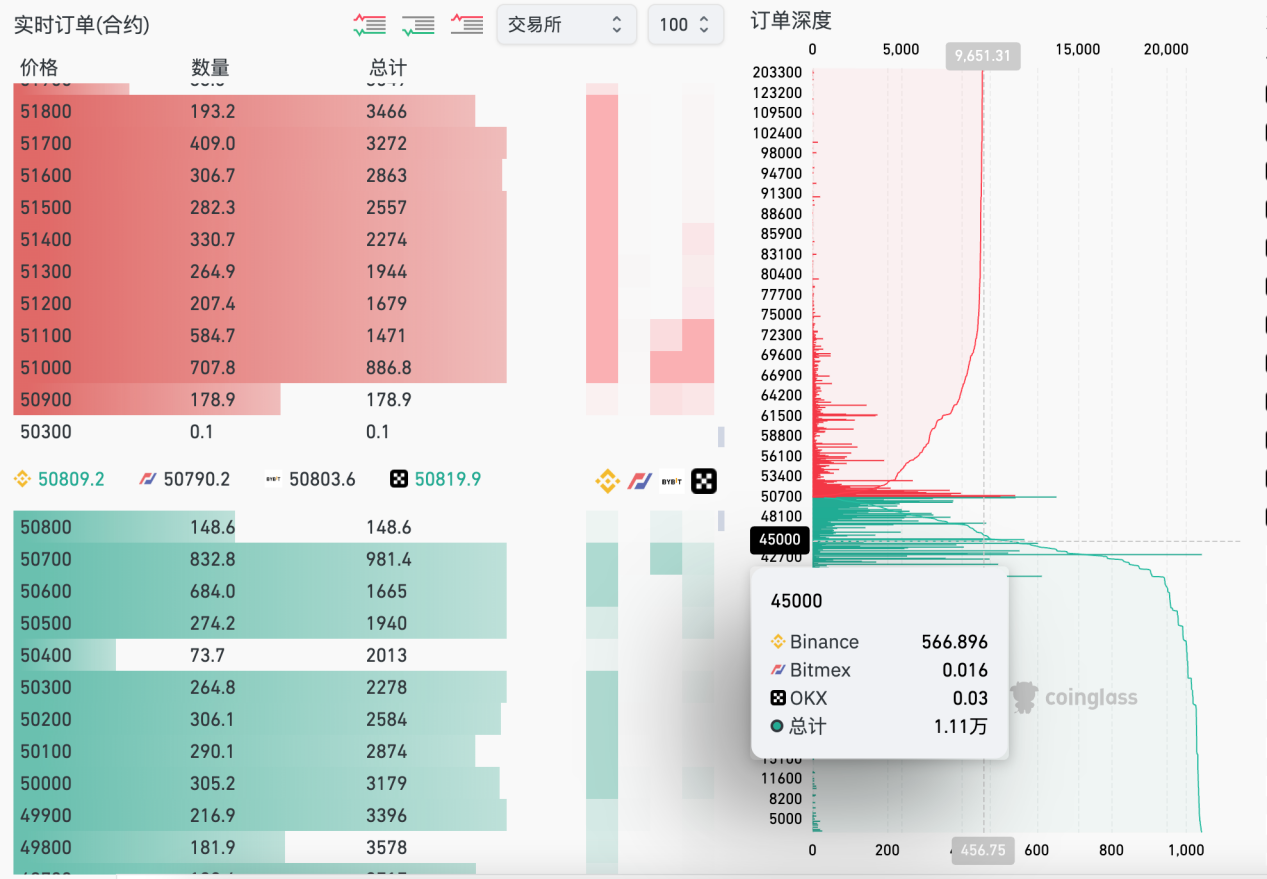
- The support below is based on the large single order data of the BTC contract. The short-term dense area below is around $48,500 and $47,400, and the surpassing selling pressure is around $45,000, with the peak around $43,300.
Follow Us:
Lao Li Mortar
免责声明:本文章仅代表作者个人观点,不代表本平台的立场和观点。本文章仅供信息分享,不构成对任何人的任何投资建议。用户与作者之间的任何争议,与本平台无关。如网页中刊载的文章或图片涉及侵权,请提供相关的权利证明和身份证明发送邮件到support@aicoin.com,本平台相关工作人员将会进行核查。

