BTC retraced for 30 minutes on the evening of the 13th, dropping to 62000 before breaking upwards with significant volume, showing no divergence in the rise. Yesterday, the major coin established an upward trend with a large bullish candle starting from 62500, and it has successfully broken the previous high of 66498, reaching a maximum of 66500, with the current price at 66150.
In last Wednesday's article "Fourth Buying Opportunity," this account clearly indicated the potential 4-hour level central fifth buying point opportunity for the major coin, and in Saturday's article "Speaking with Charts," it was stated that the daily bottom formation for the major coin was established and would soon break upwards, both of which have been successfully realized. Additionally, the fourth buying opportunity is likely to become the starting point for a breakout to create a new historical high. Several other coins mentioned in Saturday's article also saw significant increases, with ETH rising from 2440 to 2650, TIA surging from 5.3 to a peak of over 6.5, and COTI climbing from 0.099 to a maximum of 1.07.
What is the core of the Chande theory technique: measuring the unmeasurable? Let the facts speak for themselves without further ado! Set aside all greed, caution, ignorance, doubt, and slowness, dispel the two major demons of fear and greed, and focus on structure as the king of indicators. Observing the trend is as clear as reading one's palm, as effortless as watching flowers bloom!
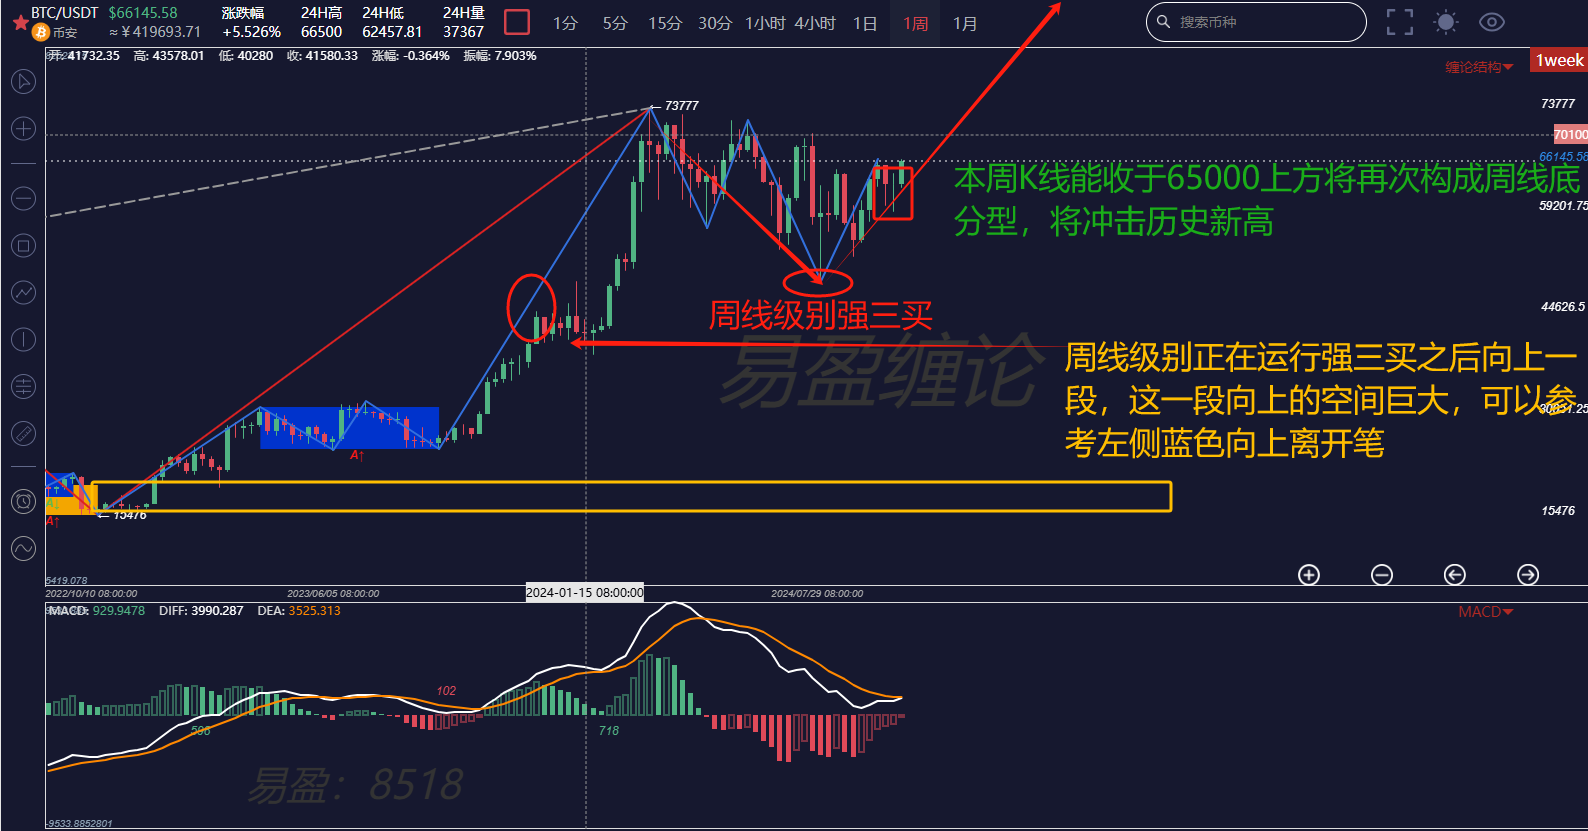
Returning to the current market situation, the major coin is once again attempting to break the 65000 resistance. The strength of this breakout appears very significant. From a broader trend perspective, as long as the price can stabilize above 65000 by the end of this week, it can be confirmed that the trend has been established, with the next target being the 70000 round number and breaking the historical high. Once it breaks through the wide range of fluctuations from 50000 to 70000 that has lasted for over half a year since March, the saying "the longer the horizontal, the higher the vertical" will make 80000 within reach, and 100000 will not be a dream.
The following uses the Chande theory structure to analyze and interpret the major coin from several large cycles:

First, looking at the weekly chart, the weekly level has moved down from the high of 73777 in three downward segments, which can be viewed as a downward segment. The 49000 level is the third buying point at the weekly level, and it is expected to move upward in the weekly level. Currently, a segment has already moved up from 49000, and whether it can extend upwards or even break the historical high will depend on whether the weekly candlestick can successfully stabilize at the 65000 point to form a weekly bottom formation. Once the bottom formation is established, the upward space can refer to the space of the left-side blue upward segment. As for the holding time period, it needs to be calculated in months.

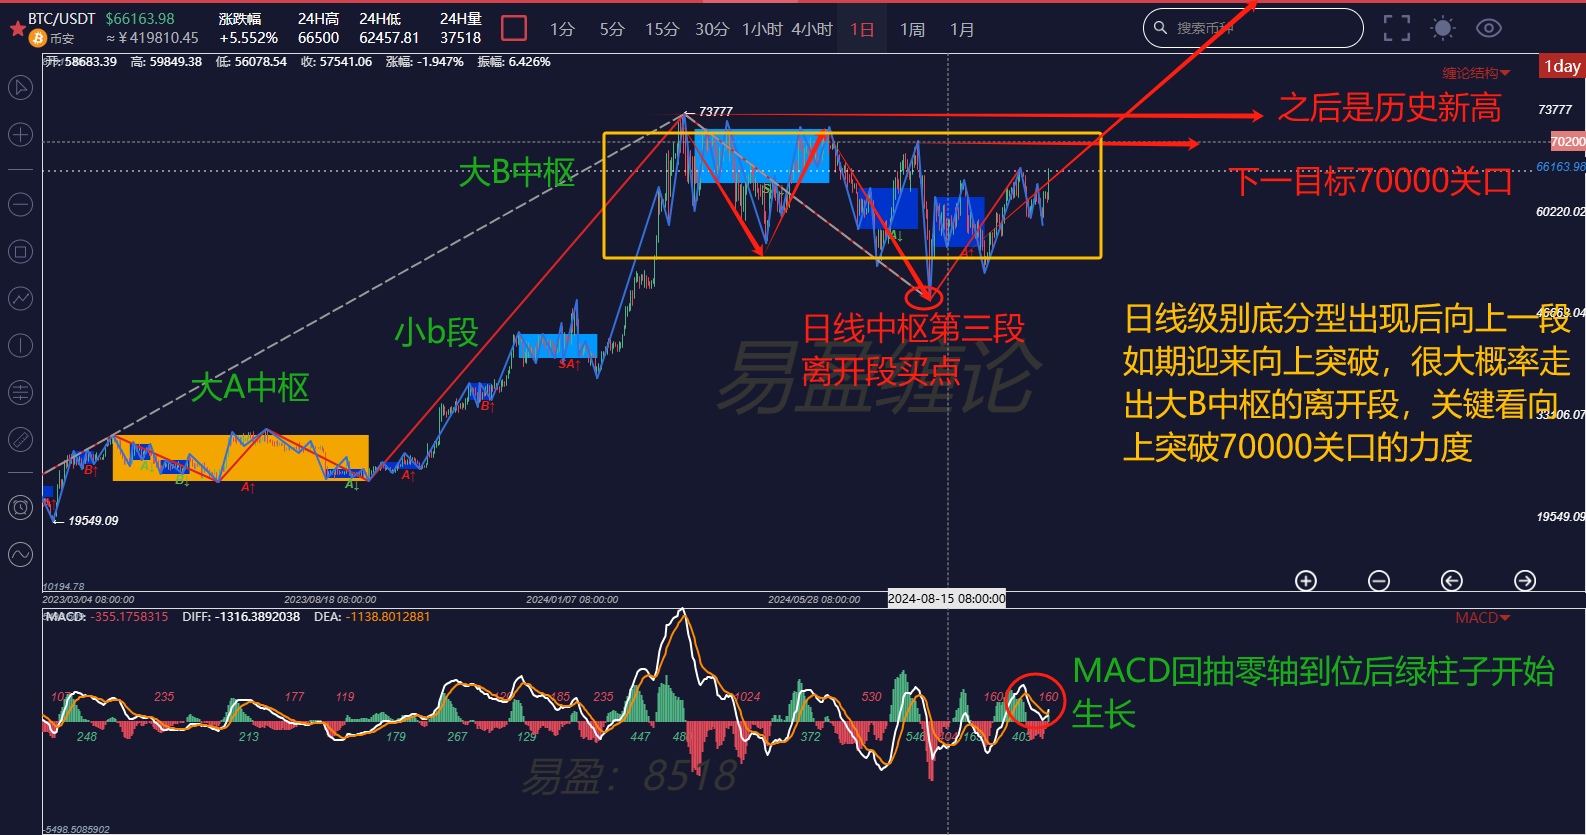
Next, looking at the daily chart, it can be clearly seen that since March of this year, there has been a second central upward trend at the daily level: the major B central oscillation. Currently, it is running in the third segment of the central buying point moving upwards. This account believes that this segment will likely be the upward departure segment of the B central, which is also the segment with the largest profit space. Whether it can successfully move out faces two important targets as shown in the chart, with the most critical being the 70000 round number. If it can break through with volume, the historical high of 73777 will soon be surpassed.

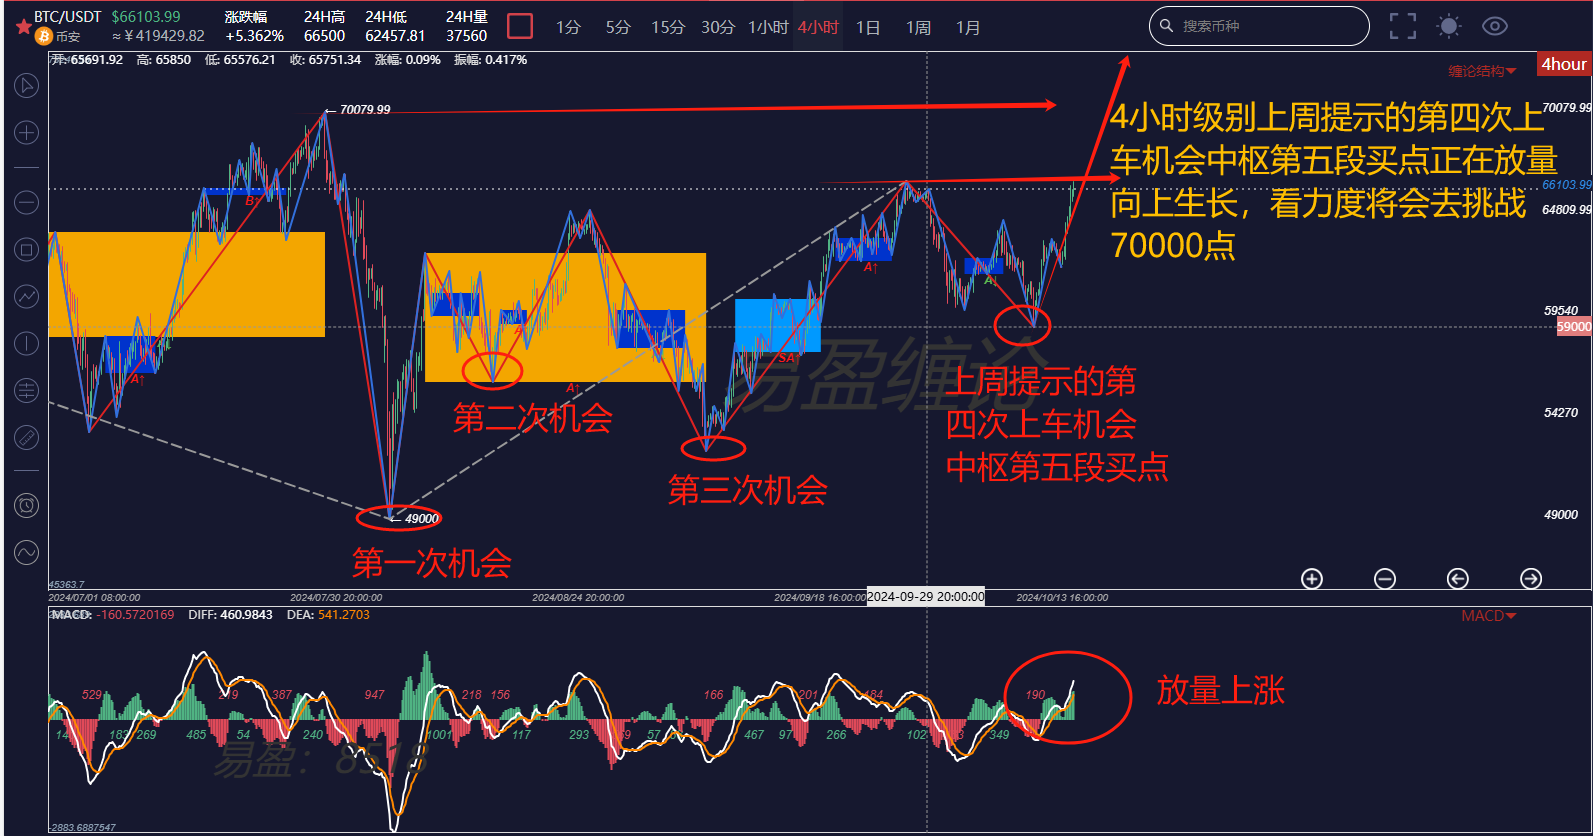
Now looking at the 4-hour chart, starting from the best bottom-fishing opportunity on the day of the crash on August 5, when the community was shouting for a bull market, this account has accurately reminded of the two buying opportunities in advance, except for the second opportunity which was somewhat vague. Each time was predicted through the internal Chande theory structure during the panic selling process.
This wave of the 4-hour central fifth buying point at 62000 appears in the middle of the central, indicating strong bullishness, belonging to a strong second buying type. From the internal structure, it has only moved up in three simple segments, leading to the conclusion: the upward movement will not end until the new pen central corresponding to the secondary 30-minute central appears.
In summary: The current strategy is very simple, primarily holding long positions. The market trend has become clearer, and it is recommended to avoid short trades, as it is easy to miss out. This account has repeatedly mentioned in previous live broadcasts that my long-term large position will not be moved until the major coin breaks the historical high.
The above analysis is for reference only and does not constitute any investment advice!
Friends, if you are interested in the Chande theory and want to obtain Chande theory learning materials for free, watch public live broadcasts, participate in offline training camps, learn the Chande theory to improve your trading skills, build your trading system to achieve stable profit goals, and use Chande theory techniques to escape peaks and bottom-fish in a timely manner. You can scan the QR code to follow the public account for private chat and add this account's WeChat!

免责声明:本文章仅代表作者个人观点,不代表本平台的立场和观点。本文章仅供信息分享,不构成对任何人的任何投资建议。用户与作者之间的任何争议,与本平台无关。如网页中刊载的文章或图片涉及侵权,请提供相关的权利证明和身份证明发送邮件到support@aicoin.com,本平台相关工作人员将会进行核查。


