Since this week, the king of cryptocurrencies, BTC, has made a strong rebound, rising sharply from around 62,000 points to over 68,000, successfully breaking through the strong resistance at 65,000. After a brief consolidation, it is expected to march towards the next target of 70,000.
The strength of BTC highlights the sluggishness of the once-king of altcoins, ETH. While BTC is once again challenging its historical high, being less than 8% away, ETH is still struggling around the relatively low point of 2,600, over 55% away from the high of 4,093 set in March this year. In comparison, holders or believers in ETH may sigh: lamenting its misfortune and angered by its lack of progress!
However, there is no need for despair. The Federal Reserve has just initiated a new round of interest rate cuts and easing. Currently, the liquidity is still relatively tight, and risk appetite is at a preliminary stage, unable to drive both BTC and altcoins like ETH simultaneously. The focus is first on pulling up the benchmark of the crypto circle, BTC, and only after BTC strongly breaks through can we expect the altcoin season to return. Once BTC breaks through its historical high and reaches for the stars, the younger brother will eventually follow in the footsteps of the elder brother, and it will be in a more violent, intense, and swift manner!
Returning to the current ETH market, since the massive drop on August 5, ETH has been oscillating between 2,300 and 2,700 for over two months. This oscillation indicates that the bulls are gathering strength and continuously exhausting the bears. BTC's upward breakthrough has given the ETH bulls enough confidence. From a timing perspective, it has been sufficient; it just awaits a super bullish candle to break through resistance and pierce the sky!
The following is a gradual deduction of ETH's future trend direction from the larger cycle structure:
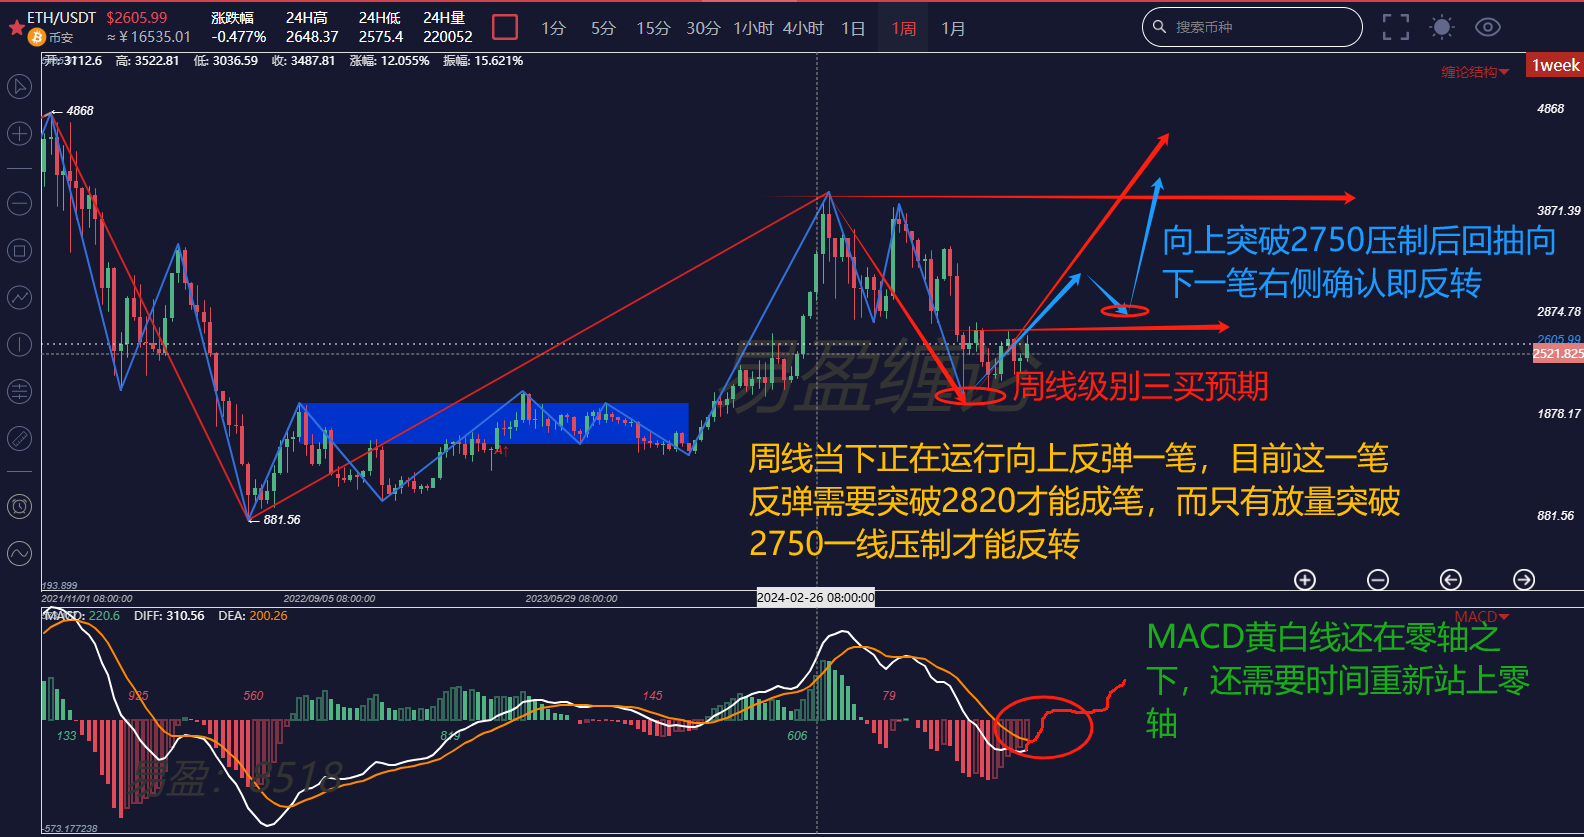
First, looking at the large-scale weekly chart, compared to BTC, ETH is weak because the MACD yellow and white lines are still below the zero axis, which creates pressure on the bulls. However, in other words, the upward space for ETH is much larger than that of BTC. Those who have studied the Chande theory know that a buy signal only appears below the zero axis. Once the yellow and white lines return above the zero axis, the market will have already moved a significant distance, and to capture the big gains, one must lay the groundwork in advance.
At the weekly level, there is an expectation of a third buy signal moving towards the previous segment. From the low of 2,111 to now, it has not yet completed a move, remaining in a sideways oscillation. The saying goes, "the longer the horizontal, the higher the vertical." This account tends to believe that the time for a breakout above the 2,800 resistance will not be too long, and it will truly grow into a significant move.
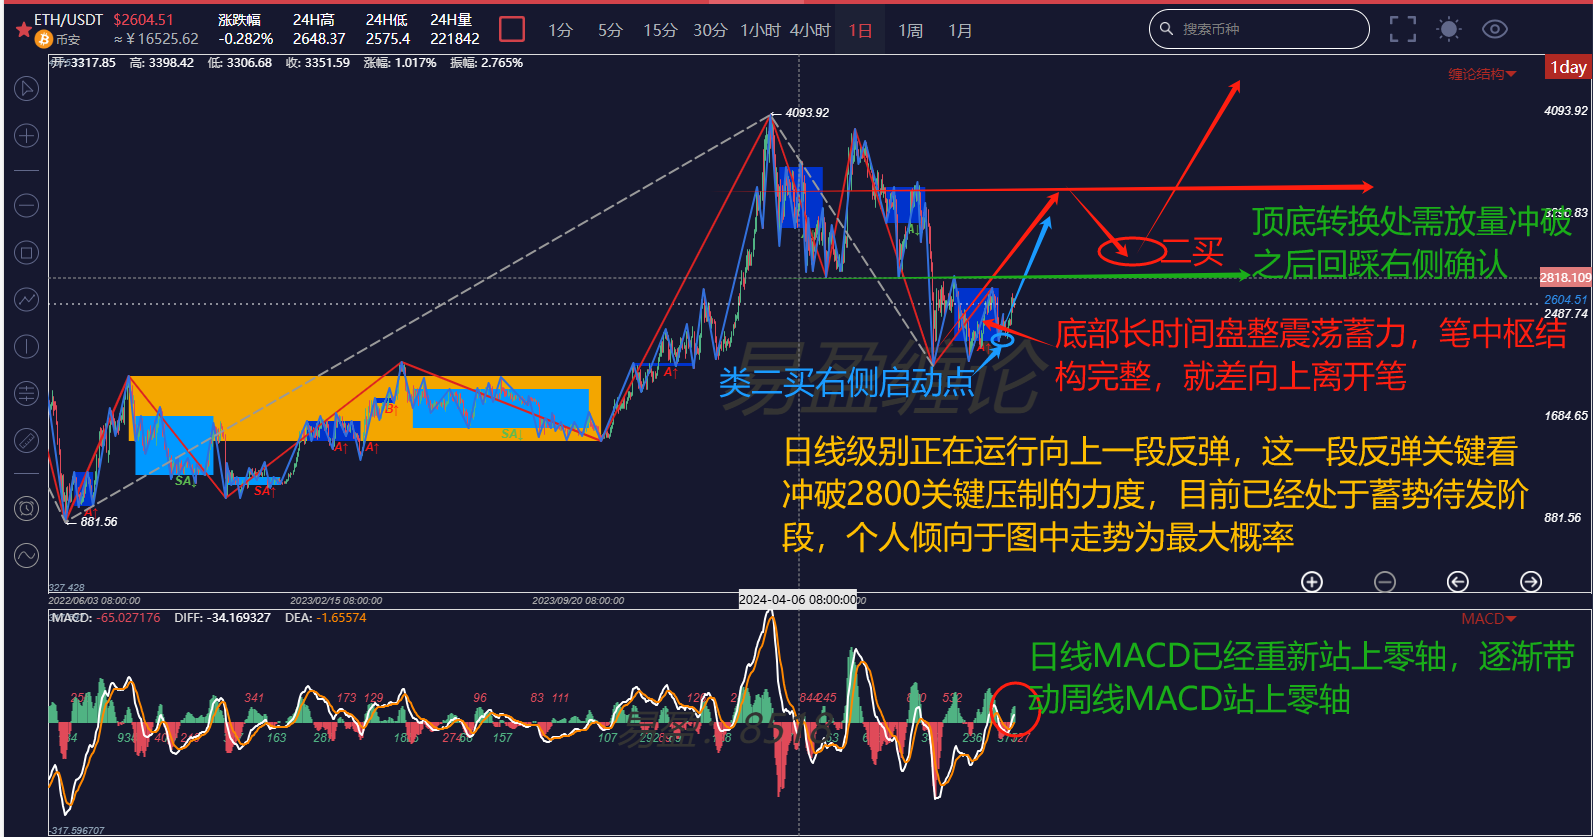
Next, looking at the daily chart, within the downward segment, there have been two instances of a second buy signal that does not create a new low, indicating that the bearish strength has weakened and is insufficient to push the price below the low of 2,111. The right side of the chart shows a potential second buy signal that is likely to become one of the starting points for an upward breakout. It is still uncertain whether this move will successfully break upward or continue to oscillate. The 2,800 point is the turning point of the previous market's top and bottom; it depends on whether this move can break through with volume.
Combining with the MACD, which has re-established itself above the zero axis, as the trend deepens, it is expected to drive the weekly MACD to cross above the zero axis.
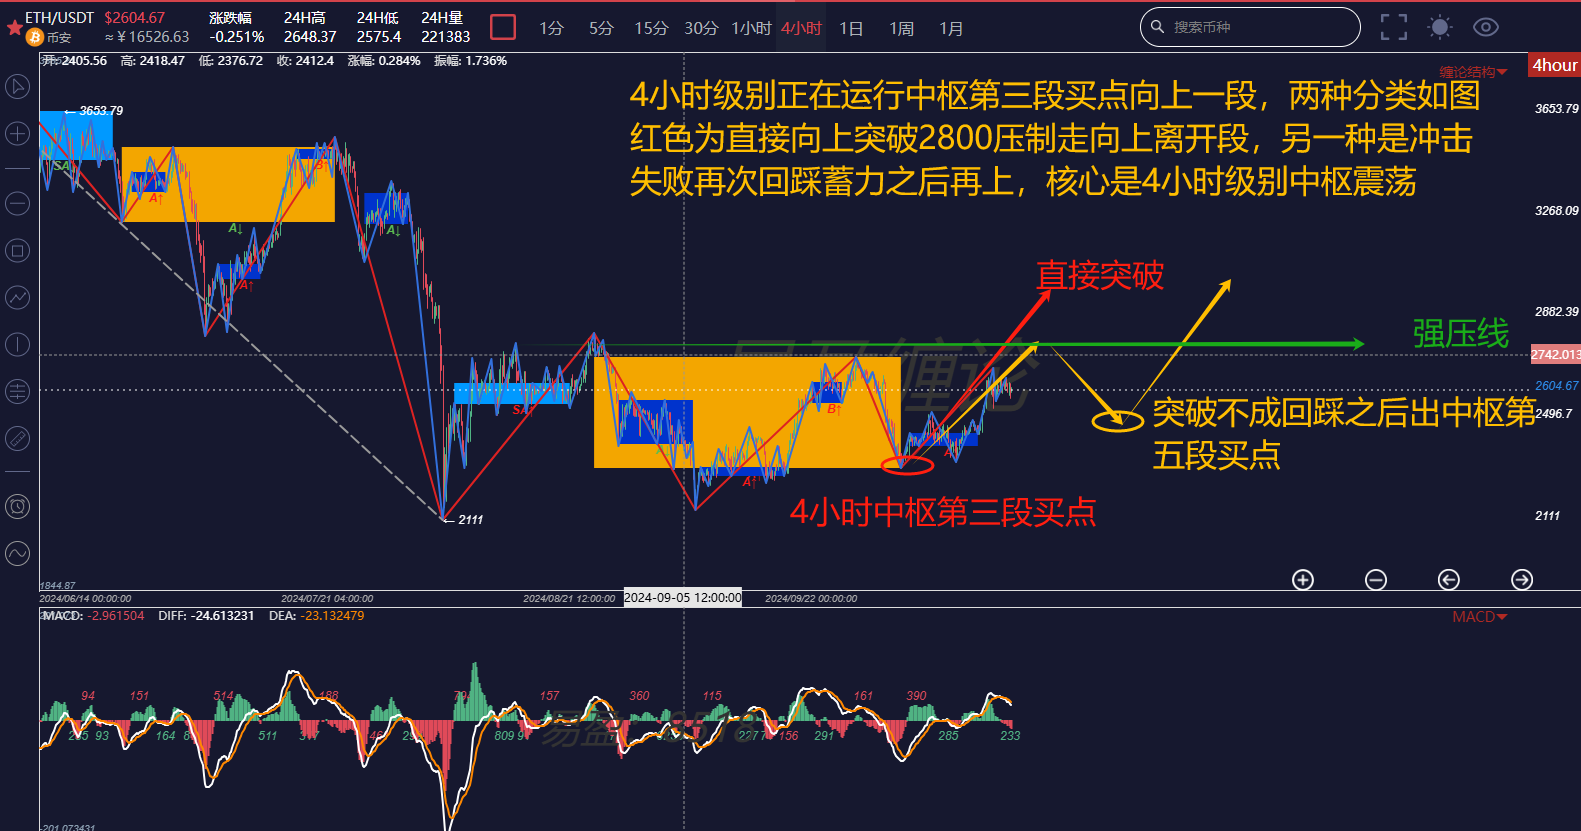
Finally, looking at the 4-hour chart, the corresponding sub-level 4-hour structure for the downward segment at the daily level is very clear. Currently, it is running in the third segment of the central buy point moving upward. This segment shows no divergence, indicating it has not yet completed. As shown in the chart, there are two classifications of movement at this level: red and yellow. Regardless of whether it is red or yellow, one common point is the need to break through the upper edge of the central area and the GG point resistance.
In summary: ETH has been oscillating at the bottom for over two months and is now in a state of readiness to launch. Those optimistic about ETH can directly ignore short-term fluctuations and hold long-term. Fans familiar with this account know that my largest holding in the crypto circle is ETH. Just wait for takeoff, no need for further words!
The above analysis is for reference only and does not constitute any investment advice!
Friends, if you are interested in the Chande theory and want to obtain free learning materials, watch public live broadcasts, participate in offline training camps, improve your trading skills, build your trading system to achieve stable profit goals, and use Chande techniques to escape peaks and bottom out in a timely manner, you can scan the QR code to follow the public account and privately chat to get and add this account's WeChat!

免责声明:本文章仅代表作者个人观点,不代表本平台的立场和观点。本文章仅供信息分享,不构成对任何人的任何投资建议。用户与作者之间的任何争议,与本平台无关。如网页中刊载的文章或图片涉及侵权,请提供相关的权利证明和身份证明发送邮件到support@aicoin.com,本平台相关工作人员将会进行核查。