Charts
DataOn-chain
VIP
Market Cap
API
Rankings
CoinOSNew
CoinClaw🦞
Language
  • 简体中文
  • 繁体中文
  • English
Leader in global market data applications, committed to providing valuable information more efficiently.

Features

  • Real-time Data
  • Special Features
  • AI Grid

Services

  • News
  • Open Data(API)
  • Institutional Services

Downloads

  • Desktop
  • Android
  • iOS

Contact Us

  • Chat Room
  • Business Email
  • Official Email
  • Official Verification

Join Community

  • Telegram
  • Twitter
  • Discord

© Copyright 2013-2026. All rights reserved.

简体繁體English
|Legacy

11.4 BTC five consecutive bearish candles forming an inverted hammer line. Is a major rebound imminent?

CN
趋势思想
Follow
1 year ago
AI summarizes in 5 seconds.
  • Technical Key Points Analysis:

  • BTC:

  • From a daily perspective, the daily chart has recorded five consecutive bearish candles. We can see that since the central upward trend began, the occurrence of five consecutive bearish candles is quite rare; the last time this happened was in June. The intraday movement is particularly crucial, and the previous day closed with a shooting star bearish candle, indicating that the support below is very strong. This type of large bearish candle often leads to a significant oversold rebound. We can see that the early rebound strength is still considerable, so pay attention to the important resistance and support areas during intraday trading.

  • After the high point of 73700, the price fell back to 68800 and then rebounded, forming a second high point for the downward trend at the range of 69800-70000. This is the starting point of the decline and is also a key position for whether it can stabilize above 70000 again. Below, pay close attention to the low point of the spike rebound at 68200 and the strong support at the double bottom low point of 67600 formed in the past two days.

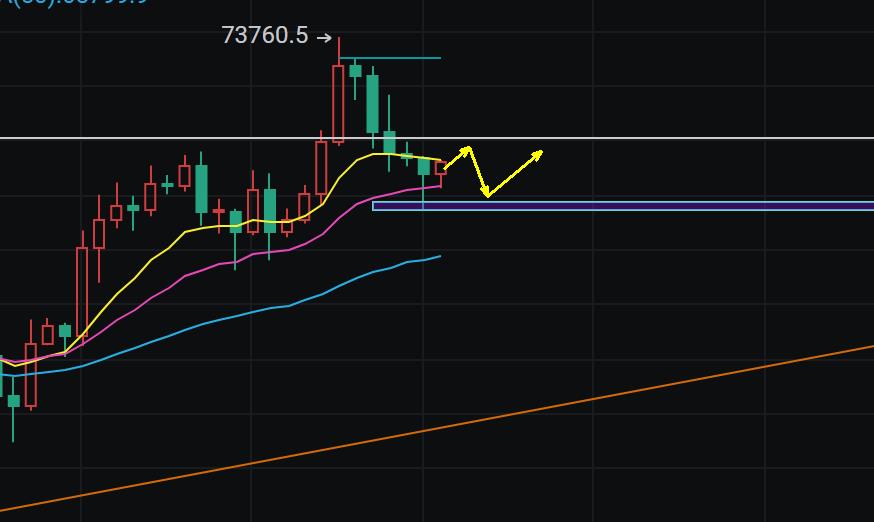
  • Therefore, it is recommended to go short around 69700-70000, with a stop loss at 70500 and a target of 68500-68200;

  • On the downside, look for a bullish move around 68300-68000, with a stop loss at 67600 and a target of 69400-69800;

For more free real-time investment strategies, trading techniques, operational skills, and knowledge about candlestick patterns, you can scan the code to follow (WeChat public account: Trend Thought Notes)

免责声明:本文章仅代表作者个人观点,不代表本平台的立场和观点。本文章仅供信息分享,不构成对任何人的任何投资建议。用户与作者之间的任何争议,与本平台无关。如网页中刊载的文章或图片涉及侵权,请提供相关的权利证明和身份证明发送邮件到support@aicoin.com,本平台相关工作人员将会进行核查。

注册就送10U!新人首笔交易再领70U空投
广告
|
|
APP
Windows
Mac
Share To

X

Telegram

Facebook

Reddit

CopyLink

|
|
APP
Windows
Mac
Share To

X

Telegram

Facebook

Reddit

CopyLink

Selected Articles by 趋势思想

9 months ago
6.11 BTC/ETH daily line five consecutive bullish candles, breaking 110700 aiming for a new high.
9 months ago
After the 6.6 Great Waterfall, the big non-farm payroll report is coming. How to position BTC/ETH?
10 months ago
After the large cross bearish candle on the daily chart of 5.13 BTC, is it a bear attack or a chance for bulls to get on board?
View More

Table of Contents

|
|
APP
Windows
Mac
Share To

X

Telegram

Facebook

Reddit

CopyLink

Related Articles

avatar
avatar交易公子扶苏
34 minutes ago
On March 26, 2017, both Bitcoin and Ethereum broke through, be cautious not to fall back down, the risk for gold in the US has increased.
avatar
avatar幕枫看趋势
35 minutes ago
3.17 Bitcoin/Ethereum Evening Market Analysis and Trading Suggestions
avatar
avatar币海逐浪
1 hour ago
Coin Ocean Surfing: 3.17 Cryptocurrency Market Bitcoin (BTC), Ethereum (ETH) Latest Evening Market Analysis Reference, Information Interpretation
avatar
avatar道说Crypto
4 hours ago
Investment is the most effective way for ordinary people to participate in new opportunities and new tracks.
avatar
avatar财经达人周悦盈
6 hours ago
Yueying: 3.17 Bitcoin Ethereum Today's Market Analysis Rebreaking Previous Highs A Reversal Is Coming? Attached Latest Trend Suggestions
APP
Windows
Mac

X

Telegram

Facebook

Reddit

CopyLink