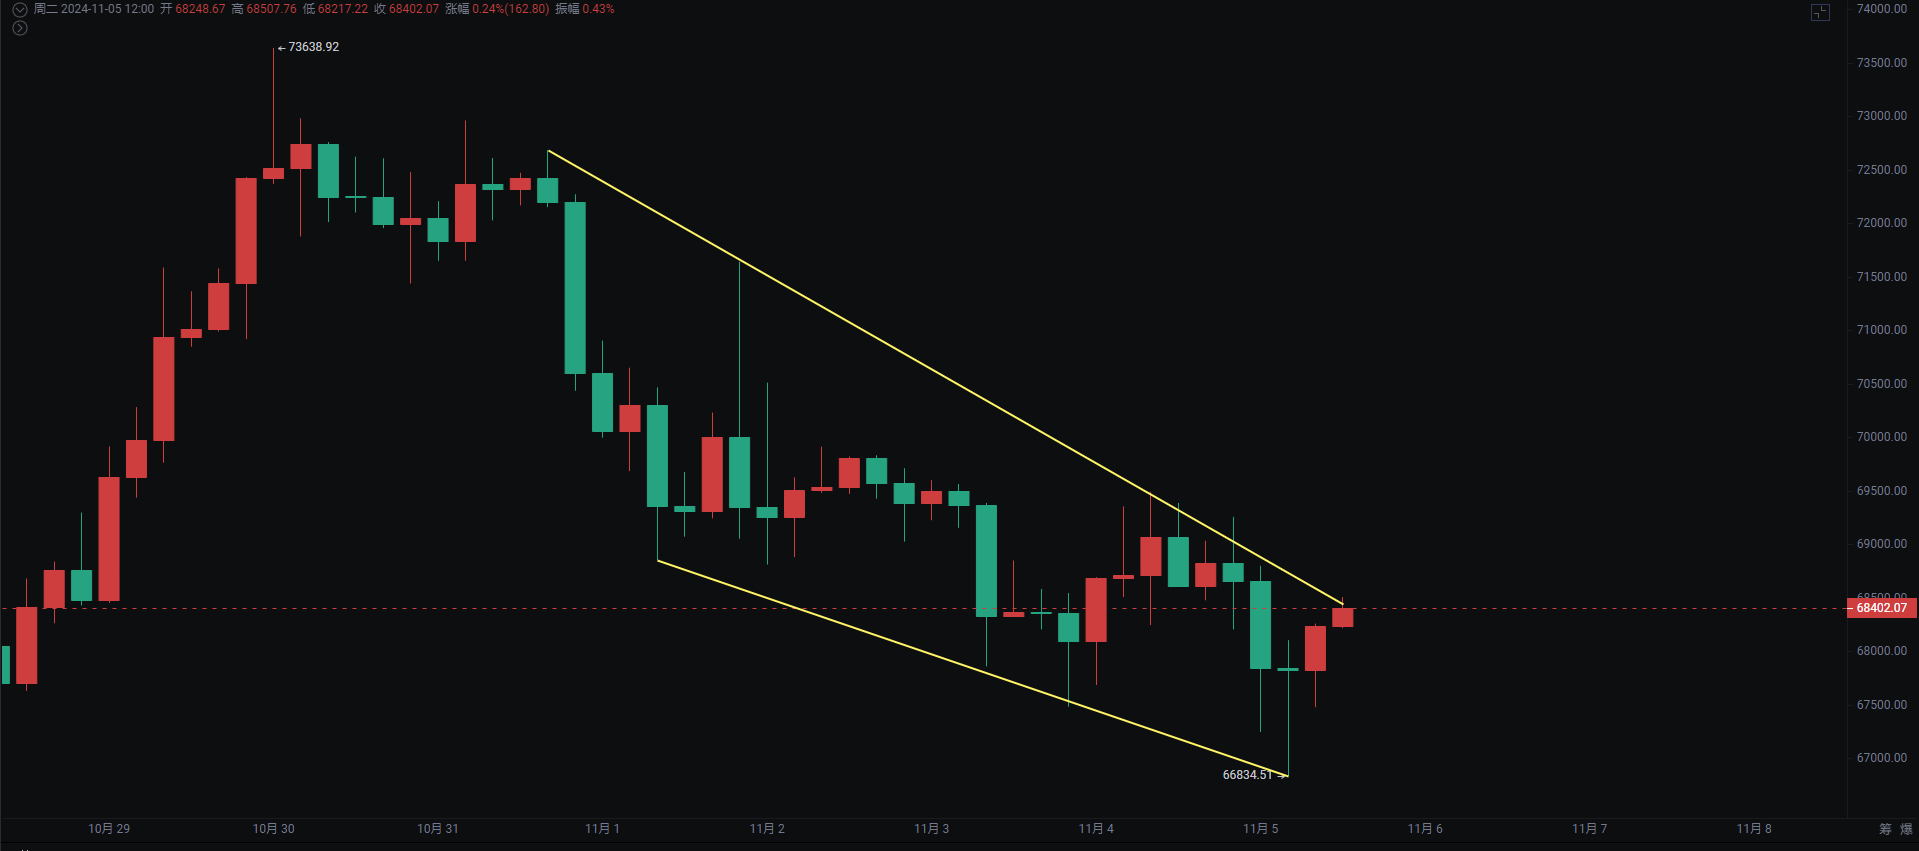
The election has entered a critical moment, and results will be available after 12:00 on the 6th. The moment to witness history has arrived. Bitcoin has once again dropped to around 66,666, finding support for a rebound. The 4-hour chart has formed a descending wedge with a MACD bullish divergence. If it breaks through, there is a chance to reach 70,400—71,600. However, if it still cannot break through 73,620, we need to be cautious of a head and shoulders pattern forming.
The trend remains bullish; we are just waiting for a pullback to see at what price level it will rebound. Regardless of who is elected, it will only accelerate or slow down the upward trend in the crypto market, but the trend itself remains unchanged.
In the A-share market, we warned friends in the crypto space to be cautious of entering after a sharp rise before the National Day holiday, as they would get trapped. Currently, after more than 20 days of adjustment, we are gradually increasing our positions during the decline, also positioning for the medium to long term.
Bitcoin
The daily chart has been oscillating around the MA20 for the past three days, with a low of 66,835 this morning before rebounding. The daily chart has adjusted for a week, but the price line has not broken below the ascending flag and ascending triangle.
The 4-hour chart has formed a descending wedge with a MACD bullish divergence. We need to pay attention to whether the wedge can break through, with the rebound target at 70,400—71,600. If there is significant volatility after the election and it still cannot break the previous high, we need to be cautious of a head and shoulders pattern correction.
Support: Resistance:

Ethereum
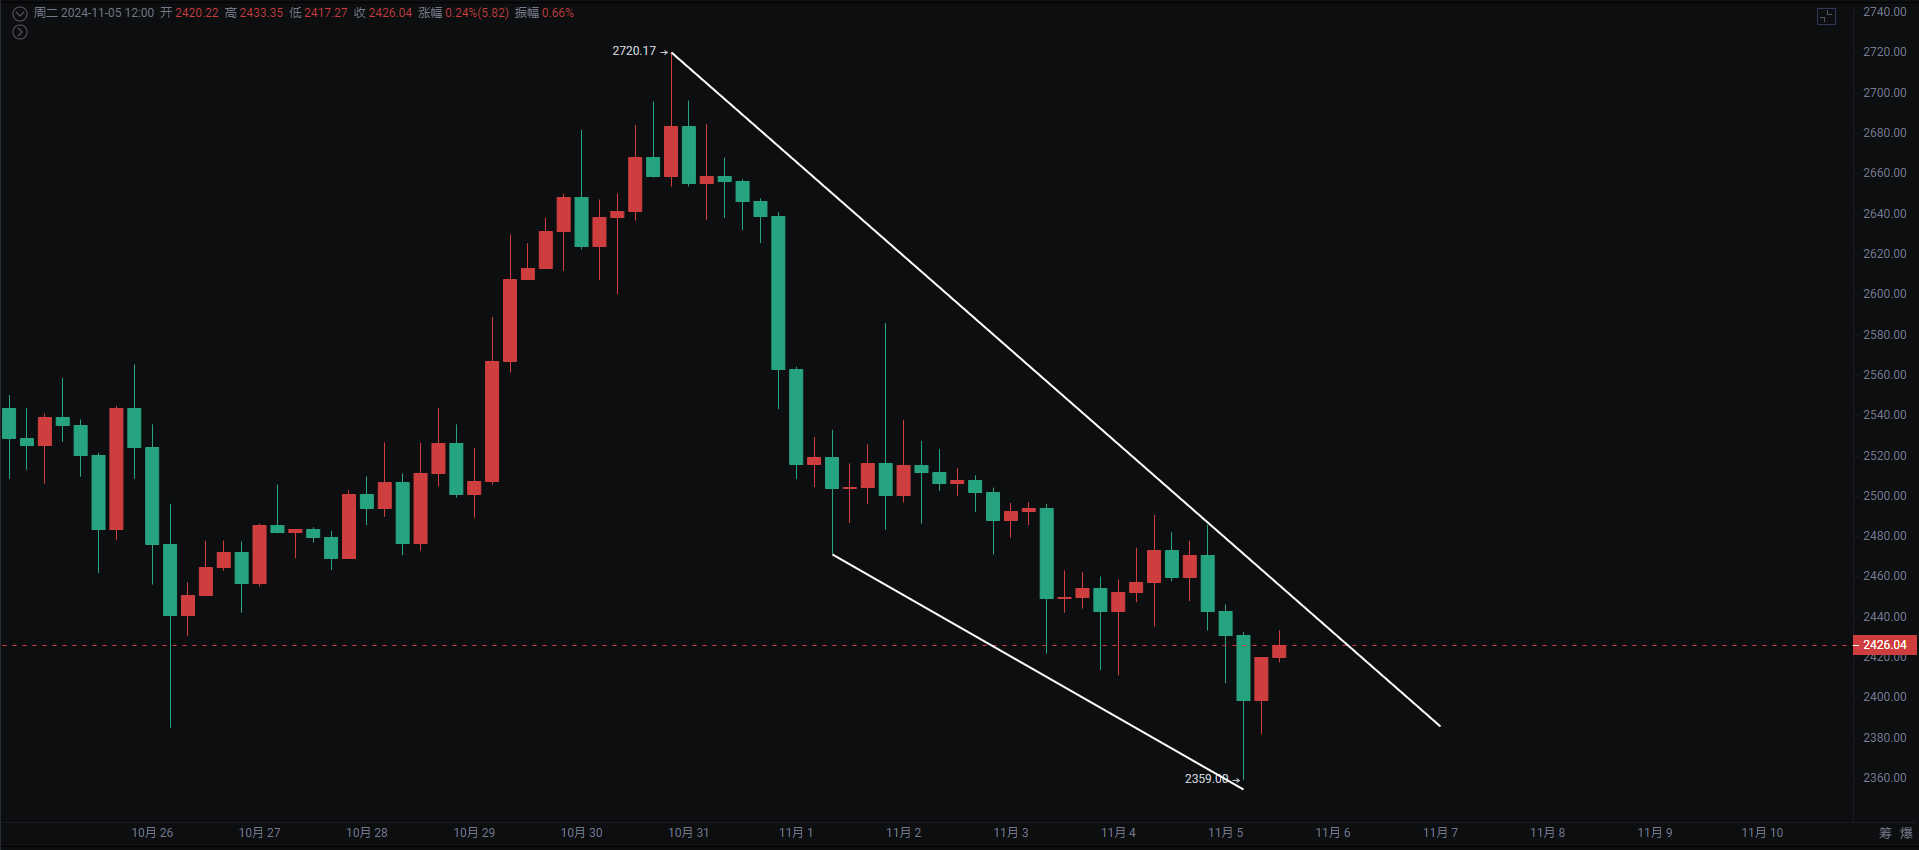
The daily chart continues to create new lows, breaking below 2,380 and reaching a low of 2,357.33. As of the time of writing, it has recovered above 2,380. The daily chart shows a converging triangle at the bottom, and we need to pay attention to whether it can hold this support.
The 4-hour chart also shows a descending wedge and a bullish divergence. We need to pay attention to the resistance above during a rebound, which is at 2,490—2,587.
Support: Resistance:

If you like my views, please like, comment, and share. Let's navigate through the bull and bear markets together!!!
This article is time-sensitive and for reference only; it will be updated in real-time.
Focusing on K-line technical research, sharing global investment opportunities. Public account: Trading Prince Fusu

免责声明:本文章仅代表作者个人观点,不代表本平台的立场和观点。本文章仅供信息分享,不构成对任何人的任何投资建议。用户与作者之间的任何争议,与本平台无关。如网页中刊载的文章或图片涉及侵权,请提供相关的权利证明和身份证明发送邮件到support@aicoin.com,本平台相关工作人员将会进行核查。


