Daily Share
In the recent week of market activity, Bitcoin experienced a wave of fluctuations and a V-shaped recovery, first dropping from the position of 73620 to around 67800, and then, following the U.S. elections and Trump's victory, it rebounded again and broke through the historical high, reaching a maximum of 76850, setting a new historical peak. This is a miracle.
This year's market has been particularly challenging, especially with Bitcoin's high-level fluctuations, while mainstream and altcoins continue to decline. People have lost confidence in the bull market and lack a profit-making effect. In fact, during a bull market, opportunities in altcoins and mainstream coins typically arise in the last 20% of the bull market. So take it slow, there's no need to rush.
Currently, there are still no signs of an end to Bitcoin's daily level rise, so we can only look for trading opportunities in smaller time frames. There is an expectation of a 1-hour level pullback in the short term, but for the 4-hour level, the upward trend does not seem to have ended yet. Therefore, we can only wait for the 1-hour pullback to complete before participating in long positions. For short positions, we can only take short trades with stop-losses. When the market is particularly strong, it may continue to rally without giving a pullback, only to correct after reaching a certain level.
BTC Medium to Long Term
Weekly:
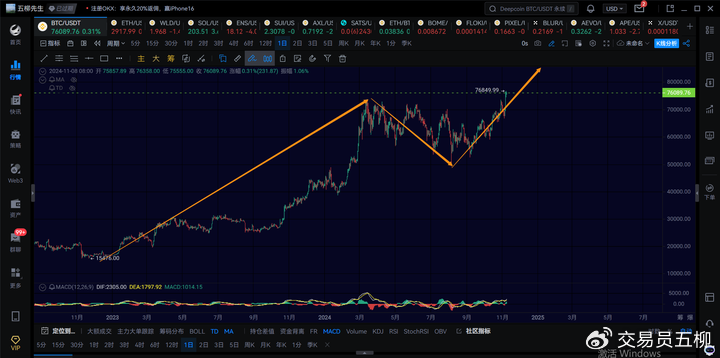
On the weekly chart, we are currently experiencing a weekly level rise, with an expected target of over 100,000. It is anticipated that when Bitcoin's weekly chart approaches its peak, it will be the time for altcoins and mainstream coins to surge.
Daily:
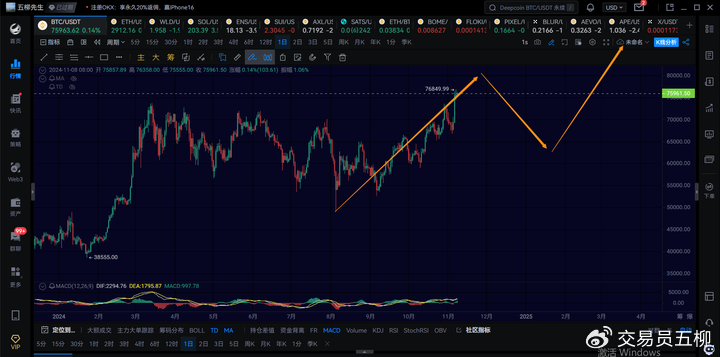
On the daily chart, we are currently in a daily level rise that started from 49000. This rise has entered the previously anticipated range of 76000 to 80000, and in the short term, we are watching to see if it will push towards 80000. After this daily rise completes, there will likely be a daily level pullback, and we can observe the expected target for the daily pullback, which may go down to around 65000. After the second daily pullback completes, the third daily rise is very likely to push towards 100,000.
4H:
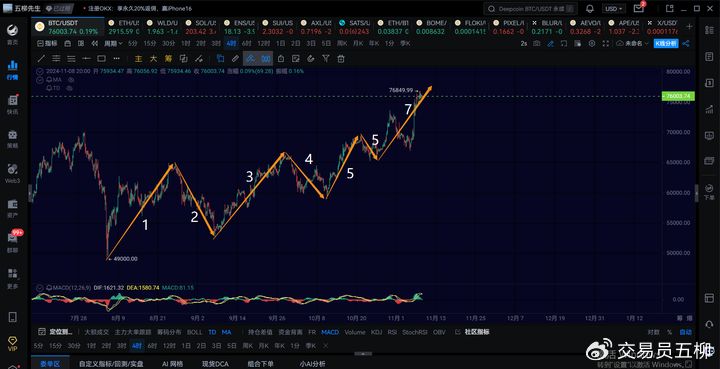
On the 4-hour chart, starting from 49000, this daily rise has already completed 7 waves. If the upcoming seventh wave of the 4-hour rise cannot break through the 77000 to 77500 range, then a daily level pullback is likely to occur in mid to late November. If the current 4-hour rise can break through 77500, then it should continue to rise, completing the eighth wave of the 4-hour pullback and the ninth wave of the 4-hour rise, potentially reaching around 80000.
Of course, the 70000 level is also an important support point. If the subsequent pullback falls below 70000, we can expect a daily level pullback. If it does not break below this level, we cannot confirm anything and can only observe the 4-hour pullback structure.
BTC Short Term
Due to the rapid changes in the market, this article can only make predictions based on the market conditions at the time of publication. Short-term traders should pay attention to the latest market changes, which should only be used as a reference.
1H:
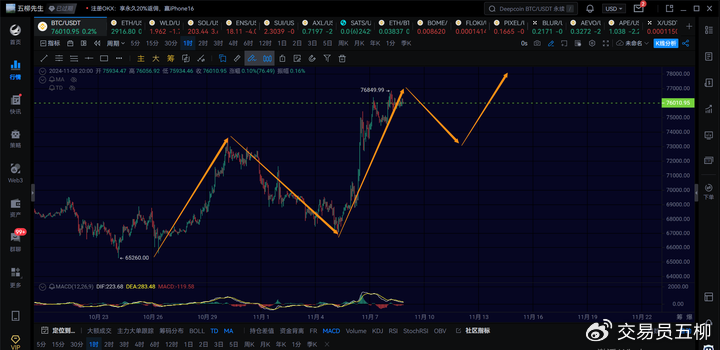
On the 1-hour chart, Bitcoin has a short-term need for a 1-hour level pullback, but I am not quite sure if it has already started. If a successful 1-hour level pullback occurs here, we can focus on the 73000 to 74000 range below. As long as it holds above 72000, there should at least be a 1-hour level rebound towards 77000 or higher; if it falls below 72000, we will look for a 4-hour pullback.
PS: I have noticed that many new traders do not quite understand the term "pullback," so let me explain briefly.
Pullback: A pullback refers to a decline that occurs after a price increase. This process of price retreating after an increase is called a pullback, which is a type of decline but is more inclined towards a normal drop during an upward trend. The literal meaning is a retreat for adjustment.
15M:
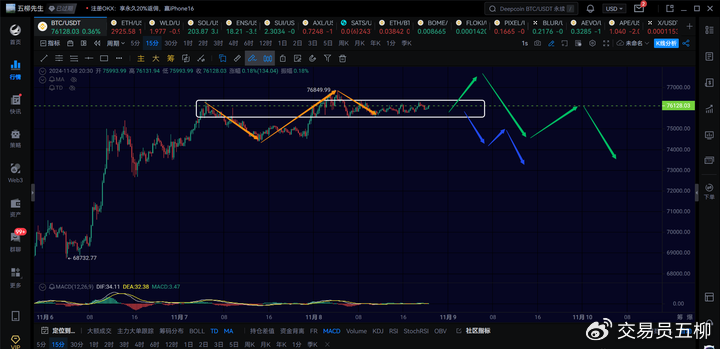
On the 15-minute chart, we are currently consolidating in a 15-minute level range. There is a possibility that it will push up towards 77000 or higher, hitting a new high before starting the expected 1-hour level pullback, as indicated by the green arrow in the image.
However, if it continues to move sideways and directly breaks below 75500, then we can expect a 1-hour pullback, as indicated by the blue arrow in the image.
ETH
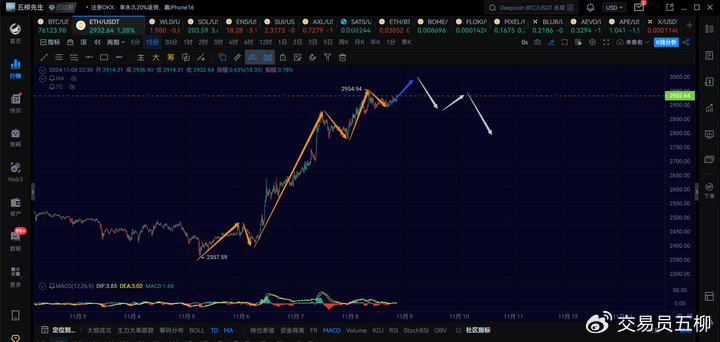
Ethereum may also push up again, with resistance to watch at 3000 to 3040. If it cannot break through, then it should undergo a 1-hour level pullback to around 2750 in the next day or two. After that, there should be another 1-hour level rise towards 3000.
Trend Direction
Weekly Level: Direction is upward, currently in a new weekly level rise, with an overall target of over 100,000.
Daily Level: Direction is upward, with the daily level rise focusing on 77000; a breakthrough will look towards 80000.
4-Hour Level: Direction is upward, with short-term focus on the resistance at 77500; a valid drop below 72000 will indicate a 4-hour pullback.
1-Hour Level: Direction is downward, with an expectation of a 1-hour level pullback soon.
15-Minute Level: Consolidating, with a possibility of pushing up to 77000 before a pullback, or it may pull back directly.
Feel free to follow my public account for discussions and exchanges:

The article is time-sensitive, please be aware of the risks. The views expressed are personal suggestions and for reference only!
免责声明:本文章仅代表作者个人观点,不代表本平台的立场和观点。本文章仅供信息分享,不构成对任何人的任何投资建议。用户与作者之间的任何争议,与本平台无关。如网页中刊载的文章或图片涉及侵权,请提供相关的权利证明和身份证明发送邮件到support@aicoin.com,本平台相关工作人员将会进行核查。


