A few days ago, the video and analysis from the young master reminded us that the higher we go, the greater the risk of a pullback. There were two reminders to reduce positions, especially for those who entered around 50,000 and just above 60,000 to lock in profits. The base position should be held firmly without any movement; when the pullback occurs, we will remind you of the opportunity to re-enter.
With each new high, the trading desk has observed that the market is selling call options and buying put options to hedge against downside risks. The market remains highly leveraged, especially in altcoins, where a large amount of leveraged trading has pushed the perpetual funding rate (1 year) up to 50-100%. Therefore, the risk of deleveraging, especially for altcoins, could be quite significant. Ethereum has dropped by 4%, while most altcoins have fallen by 10-20%.
Bitcoin
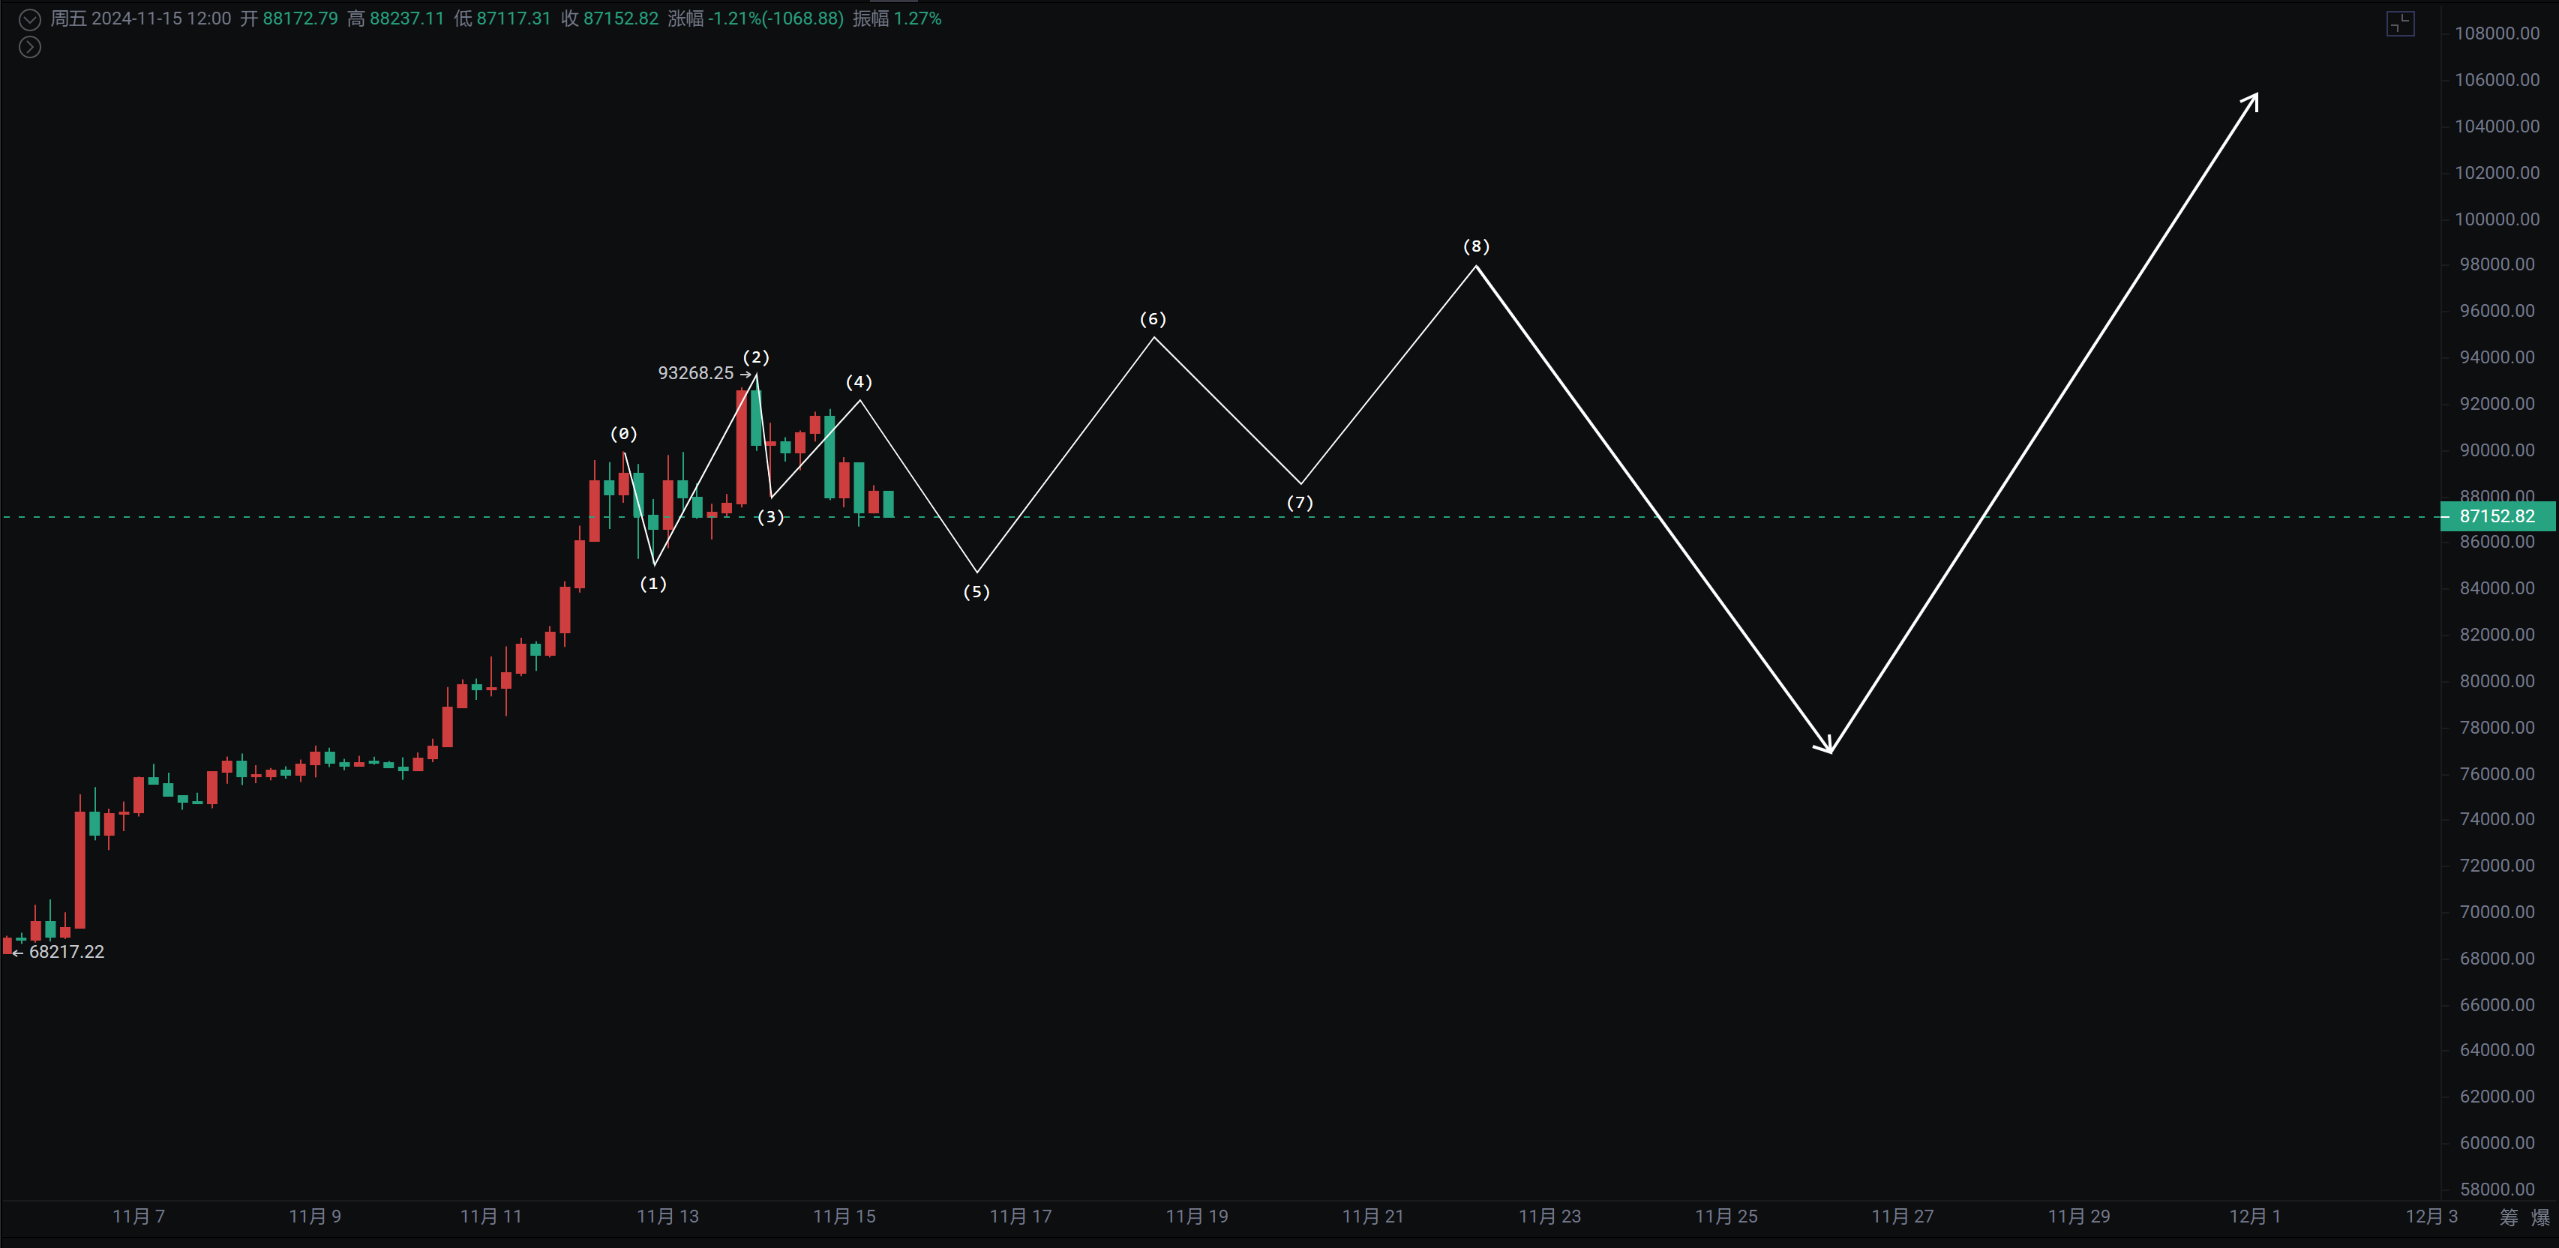
Bitcoin's rise to 93,265 and subsequent pullback was also a false breakout after surpassing 90,000, dropping nearly 6,500 points from the high. The daily chart (24H) shows two upward spikes below the key support at 85,000. Pay attention to this support; it should not be easily broken, as a breach could lead to a significant decline.

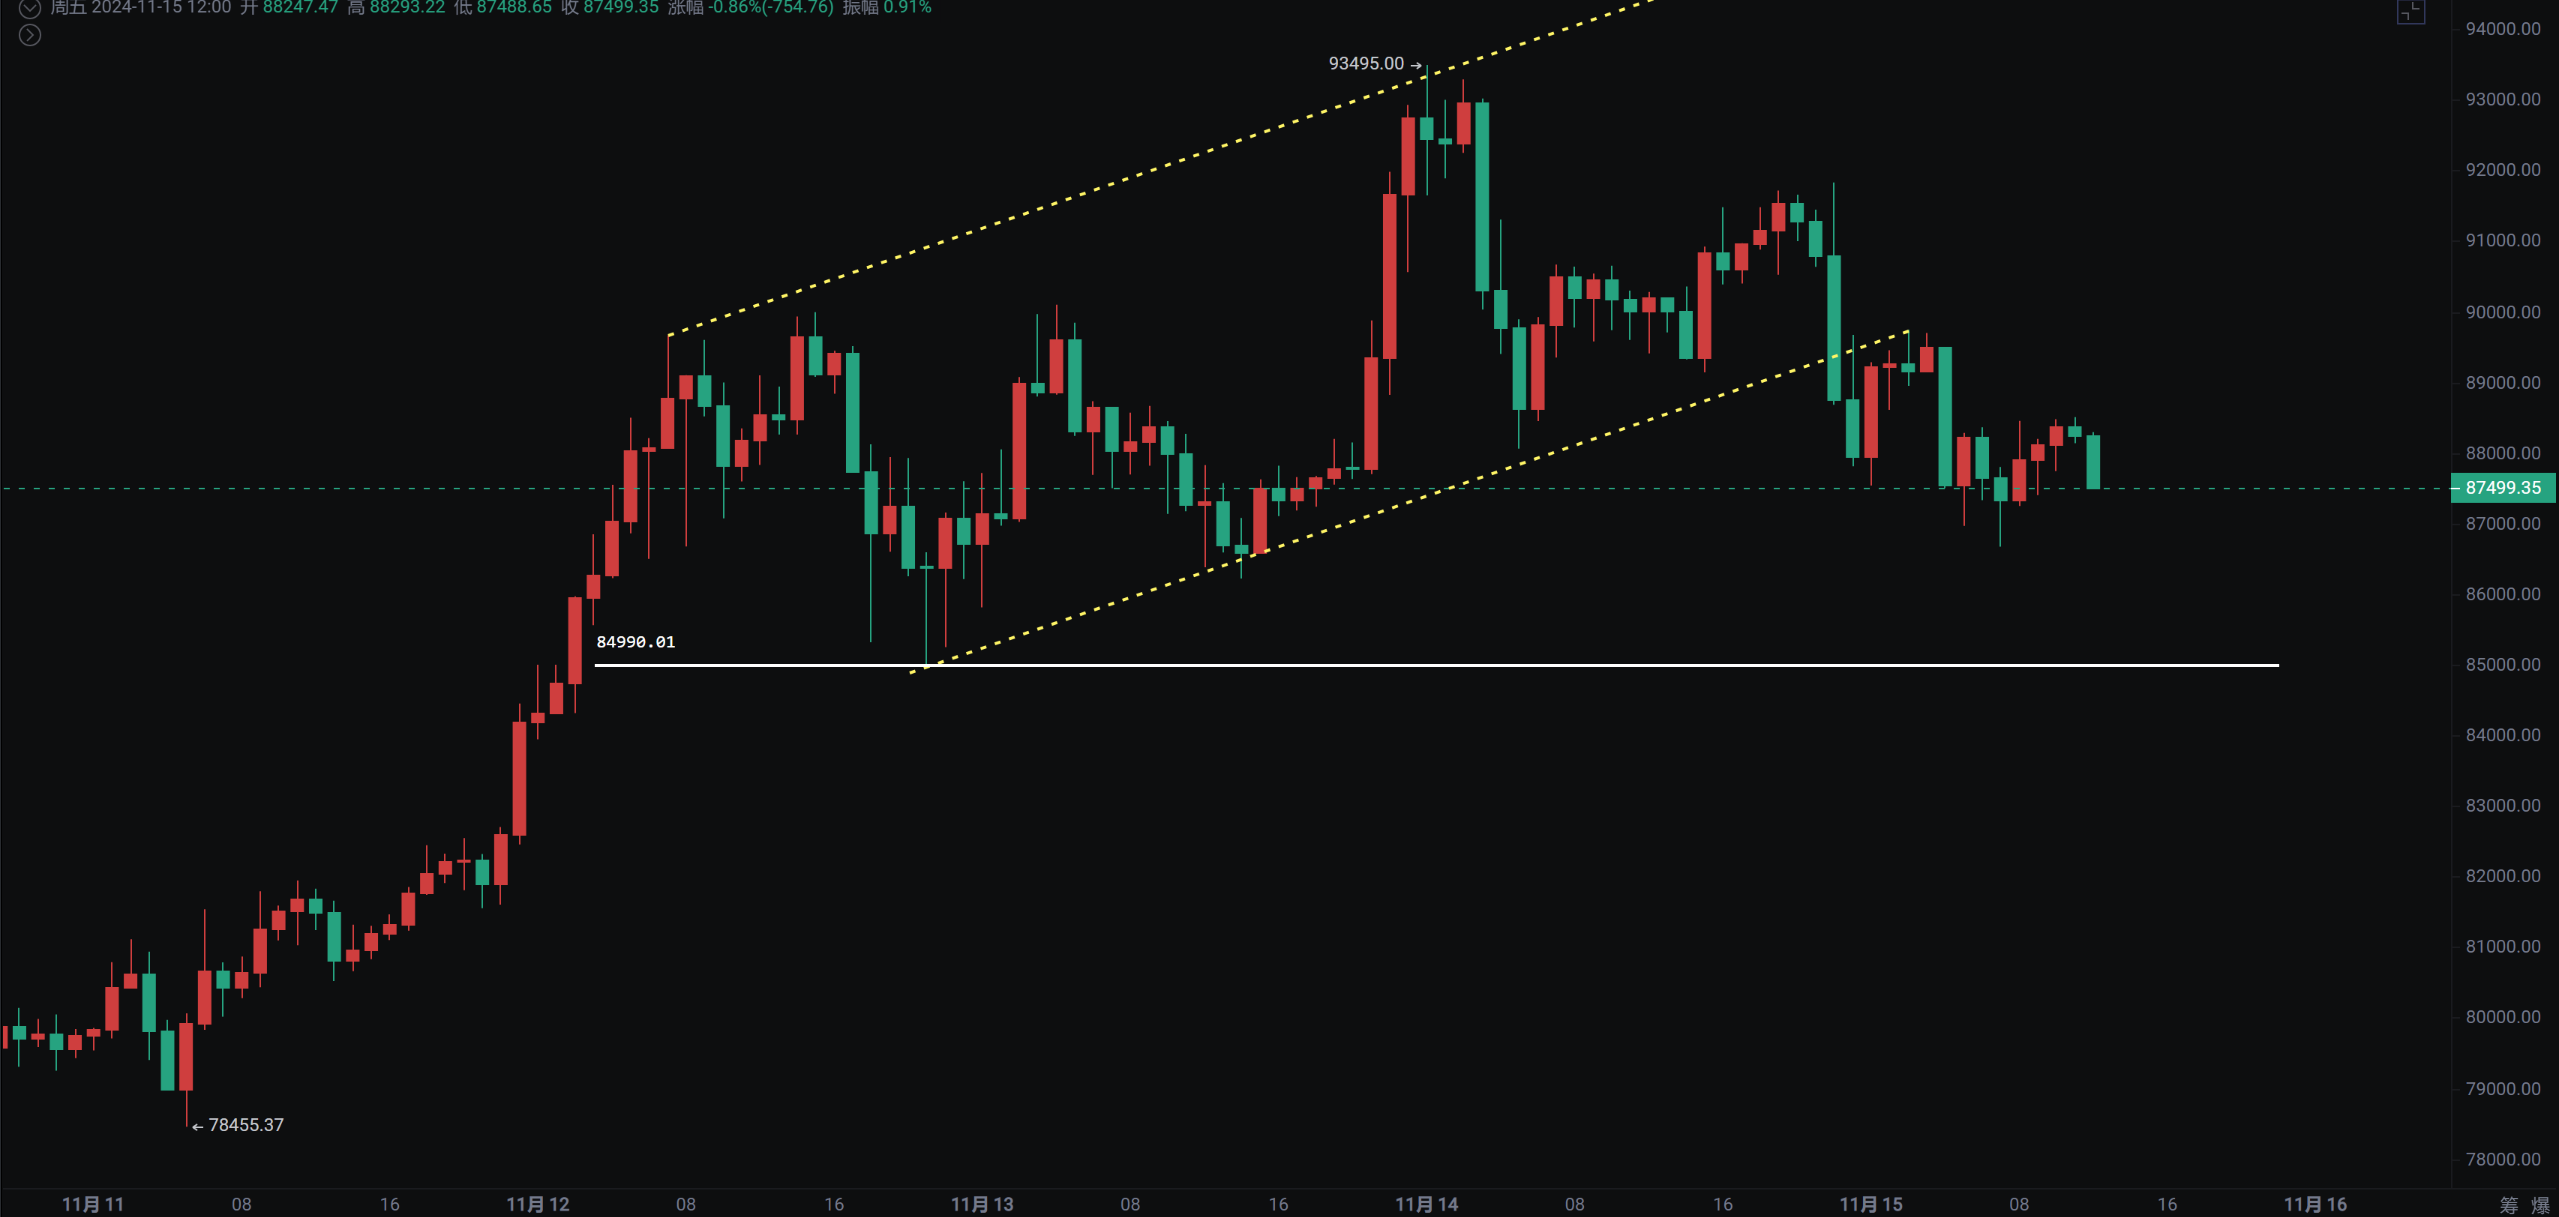
The 4-hour chart has shown an accelerated upward channel that has now broken down. Currently, it is maintaining a descending channel with a key battle at 85,000. If this line is tested again and holds, there is a chance to replicate the oscillating trend we previously mentioned, where it surged to 45,000 in 2023. For specific details on the trend, please follow our later analysis.
Support: Pressure:

Ethereum
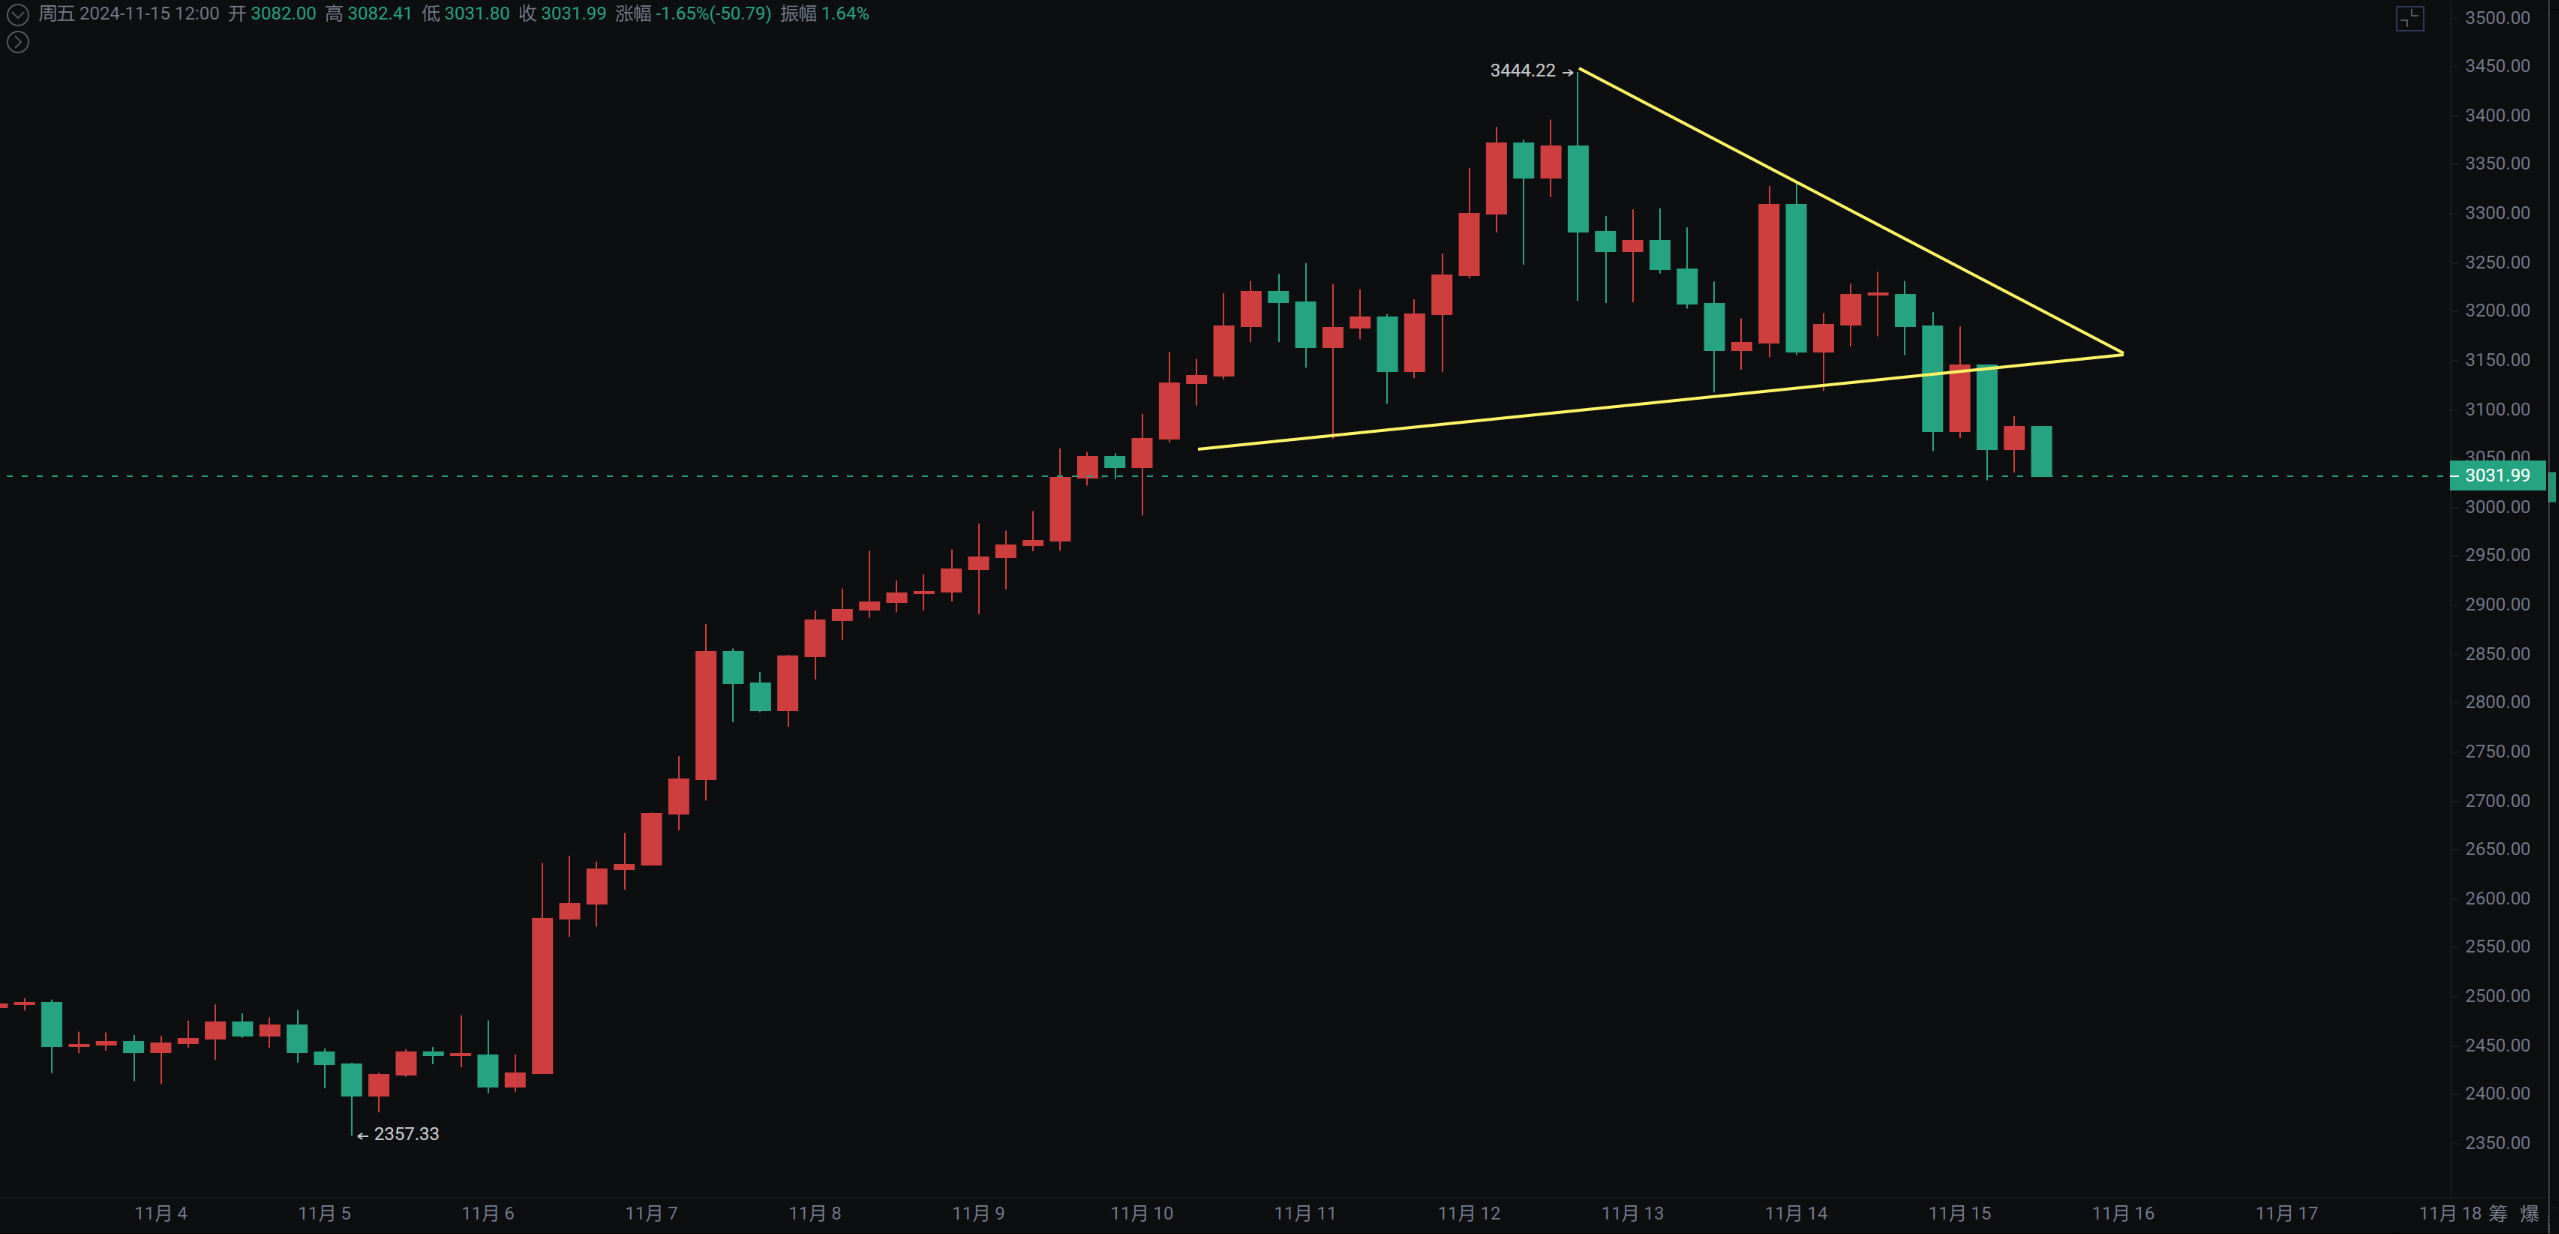
Ethereum has seen three consecutive declines, dropping from 3,444 to a minimum of 3,027 at the time of writing. This was also a reversal after the daily bat pattern we discussed earlier was completed. Last night, it broke below the 4-hour descending triangle. We have consistently reminded about the divergence on the 4-hour chart. In fact, from the weekly perspective, it has just hit the upper Bollinger Band and faced resistance. The weekly Bollinger Band is not yet adjusted, lacking the conditions for an immediate explosive rise, and the three daily moving averages have not kept up either. Any pullback presents an opportunity to enter and increase positions.
Support: Pressure:

If you like my views, please like, comment, and share. Let's navigate through the bull and bear markets together!!!
The article is time-sensitive and for reference only; it is updated in real-time.
Focusing on K-line technical research, we aim to win global investment opportunities. Official account: Trading Young Master Fusu

免责声明:本文章仅代表作者个人观点,不代表本平台的立场和观点。本文章仅供信息分享,不构成对任何人的任何投资建议。用户与作者之间的任何争议,与本平台无关。如网页中刊载的文章或图片涉及侵权,请提供相关的权利证明和身份证明发送邮件到support@aicoin.com,本平台相关工作人员将会进行核查。


