Currently priced at $98,500 to $98,750 over the last hour, bitcoin (BTC) is navigating a complex market terrain defined by psychological resistance at $100,000 and a well-established support zone below. The daily, 4-hour, and 1-hour charts reveal a tug-of-war between bullish possibilities and bearish risks, with mixed signals creating a suspenseful setup. Let’s unpack the technical indicators and potential paths for this digital heavyweight.

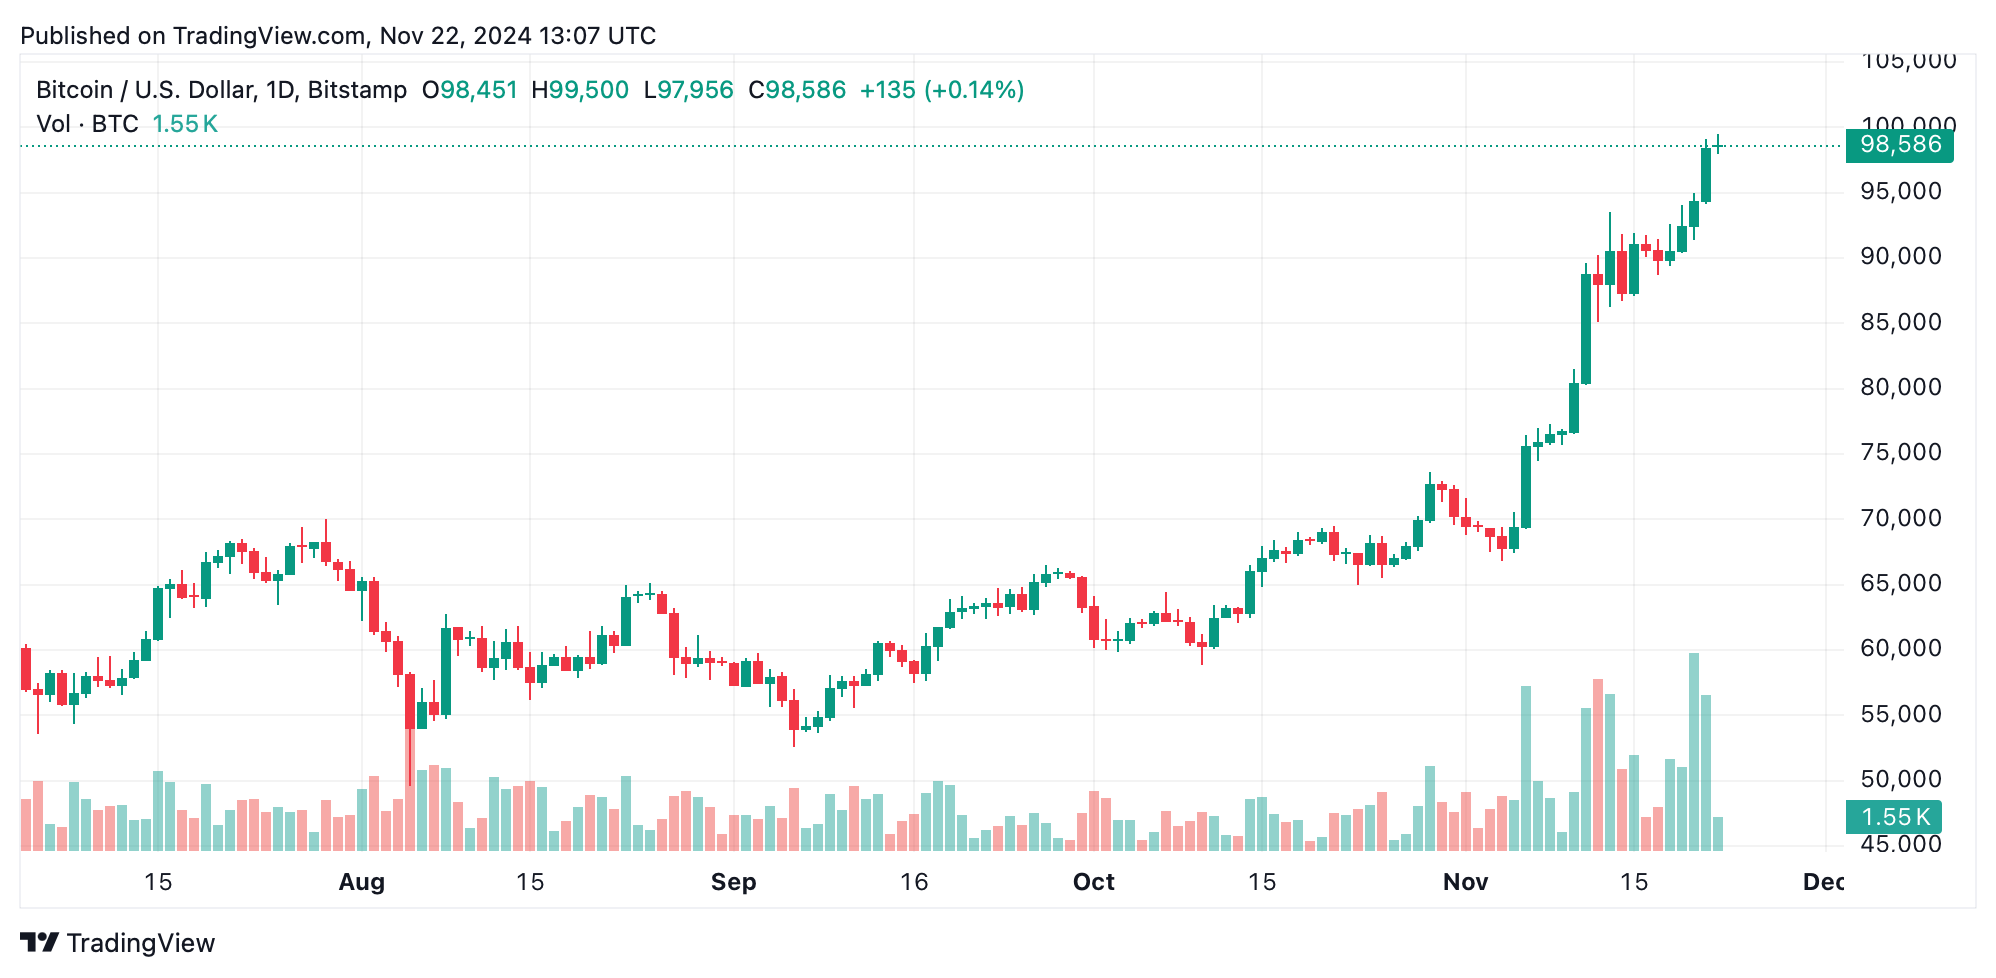
Bitcoin daily chart.
The daily chart paints a picture of bitcoin in a steady uptrend, climbing from $65,000 to flirt with $99,500. Candlestick patterns reflect bullish energy, with consistent higher highs and lows. But there’s a catch: a slight dip in volume near $99,500 hints that buyers might be running low on steam. Safer entry points may be lurking around $90,000–$92,000, while optimistic targets extend to $100,000–$105,000 if the upward momentum remains intact.

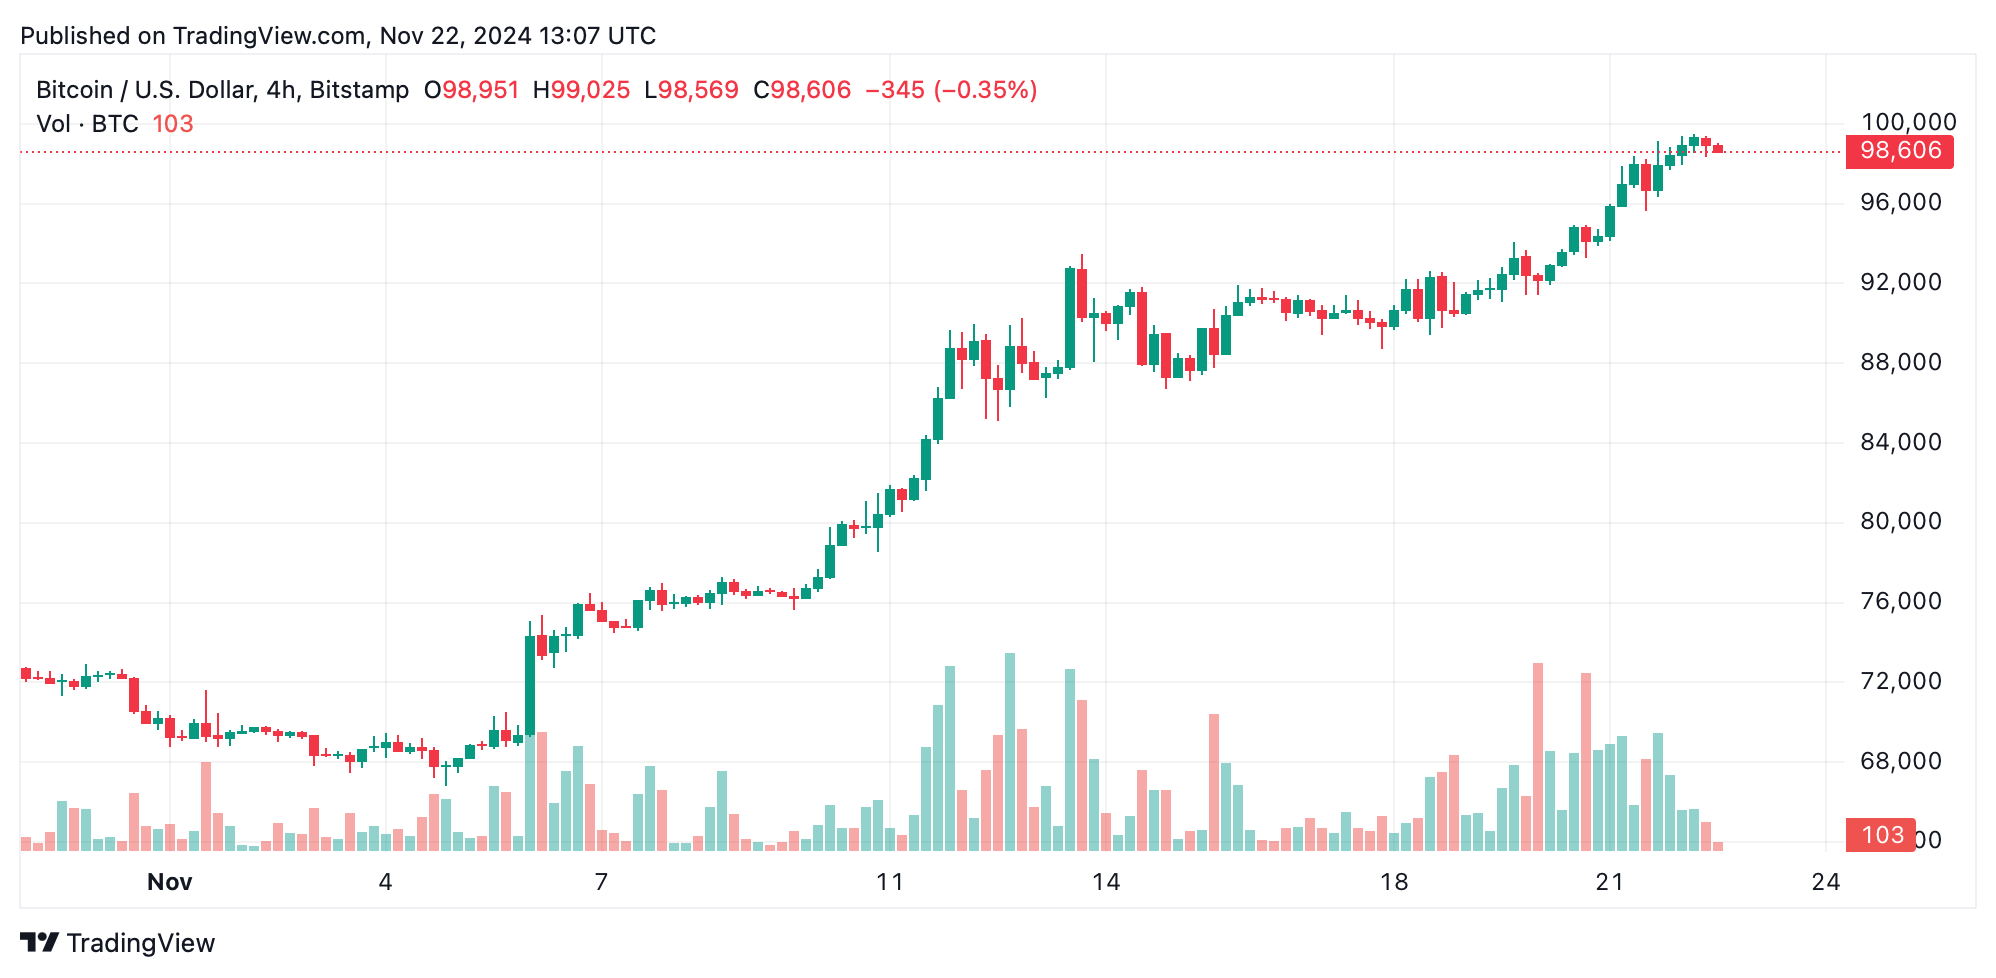
Bitcoin 4H chart.
Zooming into the 4-hour chart, bitcoin’s struggle to breach $99,500 becomes evident, with tight candles and brief volume spikes suggesting profit-taking is in play. The $95,000–$96,000 support range is critical for sustaining bullish vibes. A decisive break above $99,500 with strong volume could open the floodgates to further gains, while losing the $95,000 level might usher in a slide toward $92,000.

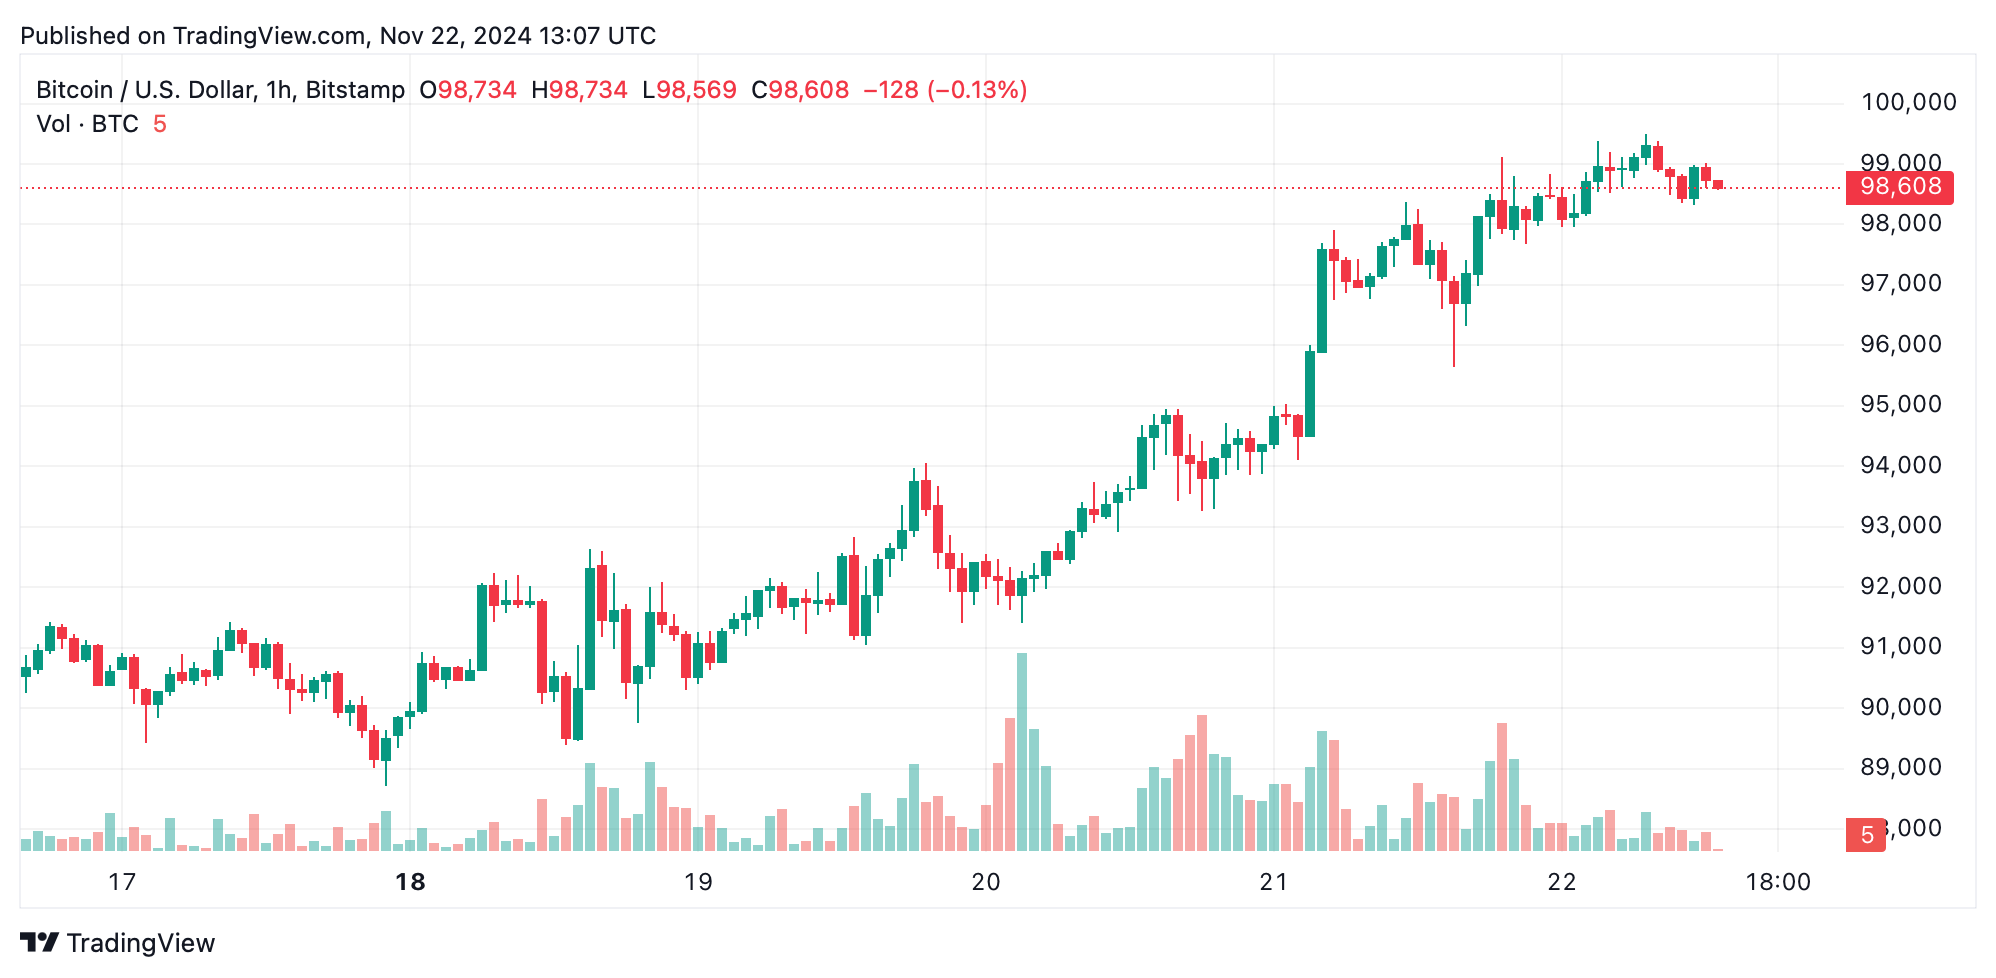
Bitcoin 1H chart.
On the 1-hour chart, the consolidation theme intensifies, as bitcoin hovers between $98,500 and $99,500. Shrinking volume during this sideways action often signals an imminent breakout or breakdown. A bullish breakout would see bitcoin leap above $98,500 on heavy buying volume, while a bearish downturn could emerge if prices drop below $98,000 on increasing sell-side activity. Traders should stay nimble and implement tight risk strategies in this choppy environment.
A closer look at technical indicators reveals a mixed bag. Oscillators like the relative strength index (RSI) and Stochastic hint at neutral conditions, while the commodity channel index (CCI) and momentum indicators lean toward cautious optimism. Moving averages (MAs), including the 10-day and 50-day exponential moving averages (EMAs), continue to favor the broader uptrend. However, the looming $100,000 resistance remains a psychological barrier that traders can’t ignore.
Bullish Verdict:
If bitcoin powers through the $99,500 ceiling with robust volume, the journey toward $105,000 and beyond could become reality. Buyers might find opportunities in pullbacks to the $95,000–$96,000 range to strengthen the rally, with indicators suggesting the broader trend is still upward. A sustained move above $100,000 would likely attract more buying interest and affirm market confidence.
Bearish Verdict:
Failure to hold the $95,000 support could spell trouble, potentially pulling bitcoin down to the $92,000 level. Resistance volume patterns hint at possible buyer fatigue, and slipping below $98,000 could intensify downward pressure. Bears might capitalize on a rejection at $99,500 or a confirmed breakdown below these critical thresholds amid waning market activity.
免责声明:本文章仅代表作者个人观点,不代表本平台的立场和观点。本文章仅供信息分享,不构成对任何人的任何投资建议。用户与作者之间的任何争议,与本平台无关。如网页中刊载的文章或图片涉及侵权,请提供相关的权利证明和身份证明发送邮件到support@aicoin.com,本平台相关工作人员将会进行核查。


