Cryptocurrency News
November 24 Highlights:
1. Solana ETF is expected to be approved by the end of 2025.
2. Arthur Hayes: Predicts Bitcoin will reach $250,000 by the end of 2025.
3. Industry institutions vying for a seat on Trump's cryptocurrency advisory committee have prompted warnings from consumer groups: one should not be both the referee and the player.
4. Morpho platform's total lending has reached a milestone of $1 billion.
5. The Hong Kong Securities and Futures Commission plans to explore the application of tokenized deposits in bond and fund subscriptions.
Trading Insights
Why is Wave 3 the best buying point in cryptocurrency trading? After pondering for a long time, I finally understood the true meaning of this chart! All trading originates from this. From significant losses to a comeback, I have learned many methods along the way, but I truly believe that the wave theory resonates deeply with me. Today, I want to share my insights on wave theory trading strategies over the years. The methods may be simple, but they are rich in content, so keep them for reference. To understand the basic logic of wave trading, one must first understand what wave structure is. Simply put, in an upward trend, the operational model that drives the price of the coin to rise continuously is generally a five-wave push pattern, known as the famous upward five waves; while in a downward trend, the operational model that drives the price to fall continuously is a three-wave adjustment pattern, known as the famous downward three waves. From the perspective of wave theory, buying point 1 is when the trend has just begun to reverse; this stage is just starting, and the safety factor is low. Buying point 2 is when the market is in a consolidation phase, with limited gains; buying point 3 is the starting position of the main upward wave, and usually, this wave's increase is at least 1.5 times that of wave 1, [currently] often prone to a significant market surge. If analyzed using the Chande theory, this is the resonance buying point of large and small levels, which is highly reliable and can easily yield substantial profits. If you still find wave theory obscure and difficult to understand, please remember its three laws to grasp the essence of wave theory. Law 1: The correction of wave 2 generally does not exceed the starting point of wave 1. Law 2: Among the basic driving patterns of waves 1, 3, and 5, the increase of wave 3 will not be the shortest of the three. Law 3: In a complete five-wave push, the adjustment of wave 4 will not fall into the price range of wave 1.
LIFE IS LIKE
A JOURNEY ▲
Below are the real trading signals from the Big White Community this week. Congratulations to the friends who followed along; if your trades are not going well, you can come and test the waters.
The data is real, and each trade has a screenshot from when it was issued.
Search for the public account: Big White Talks About Coins
BTC


Analysis
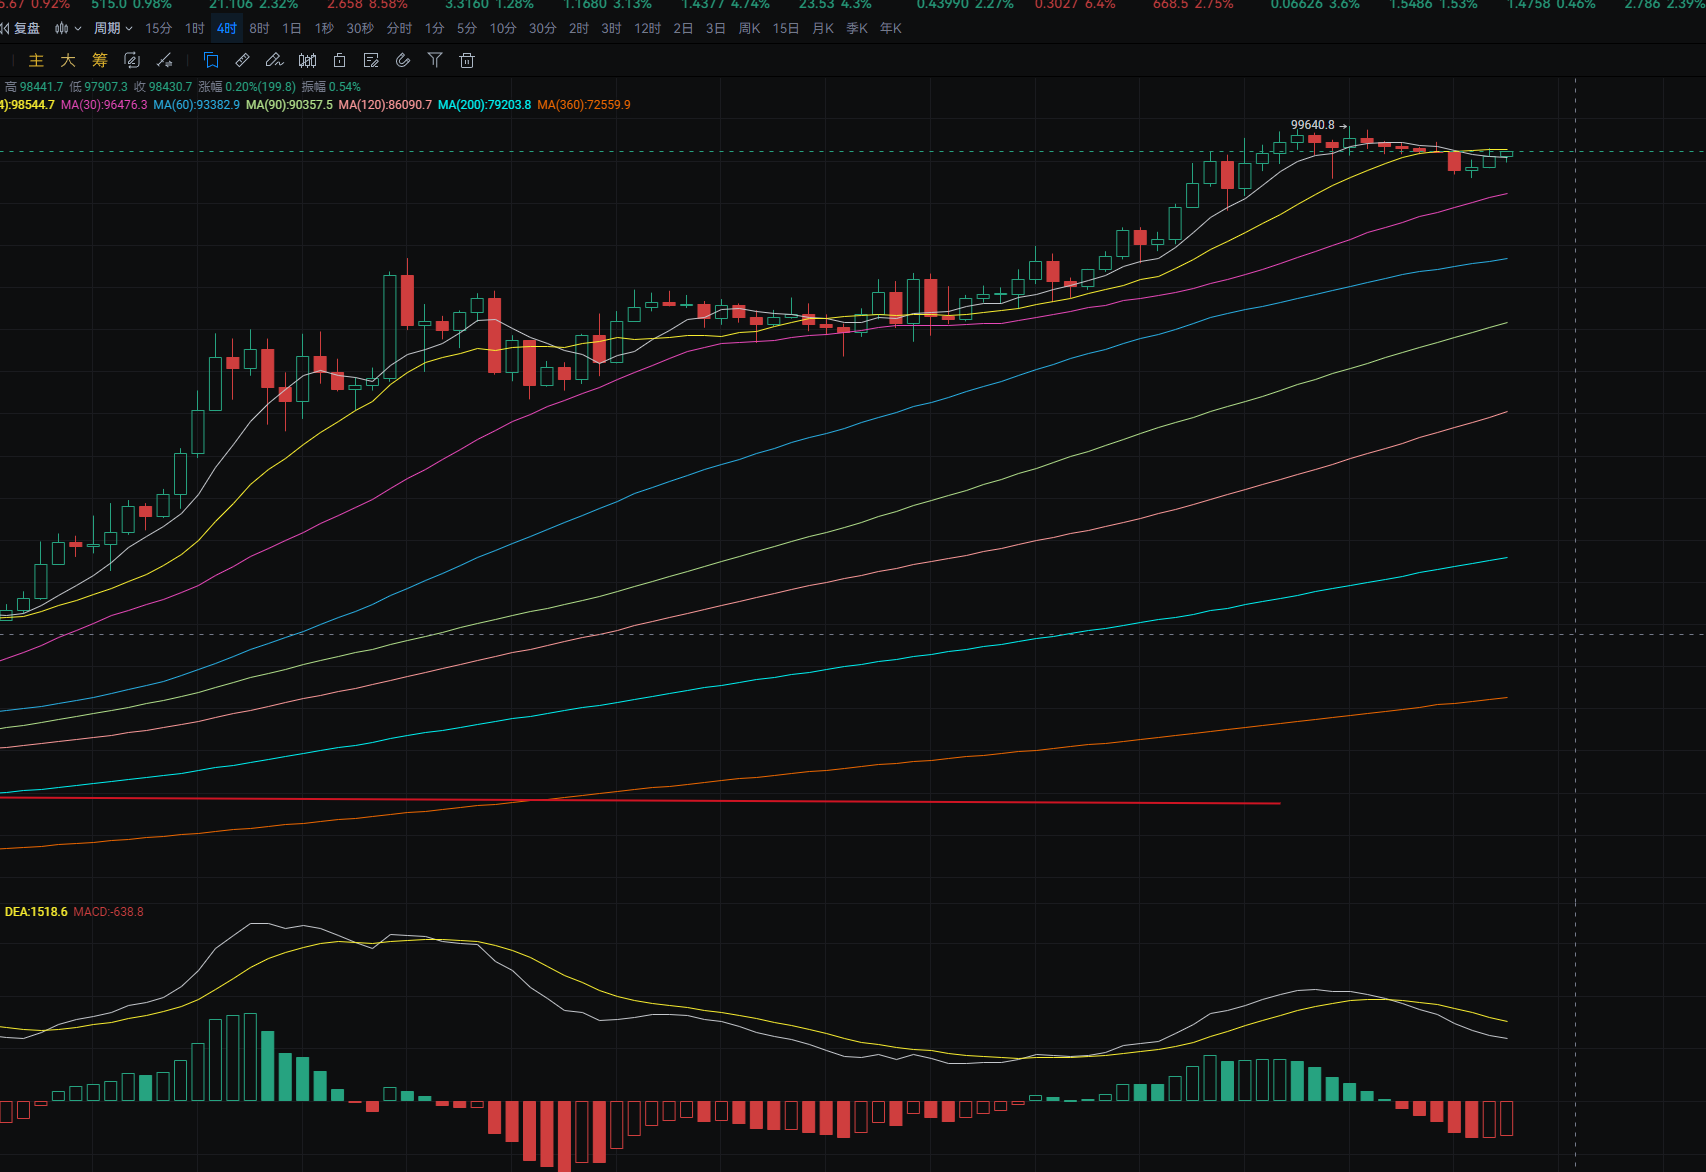
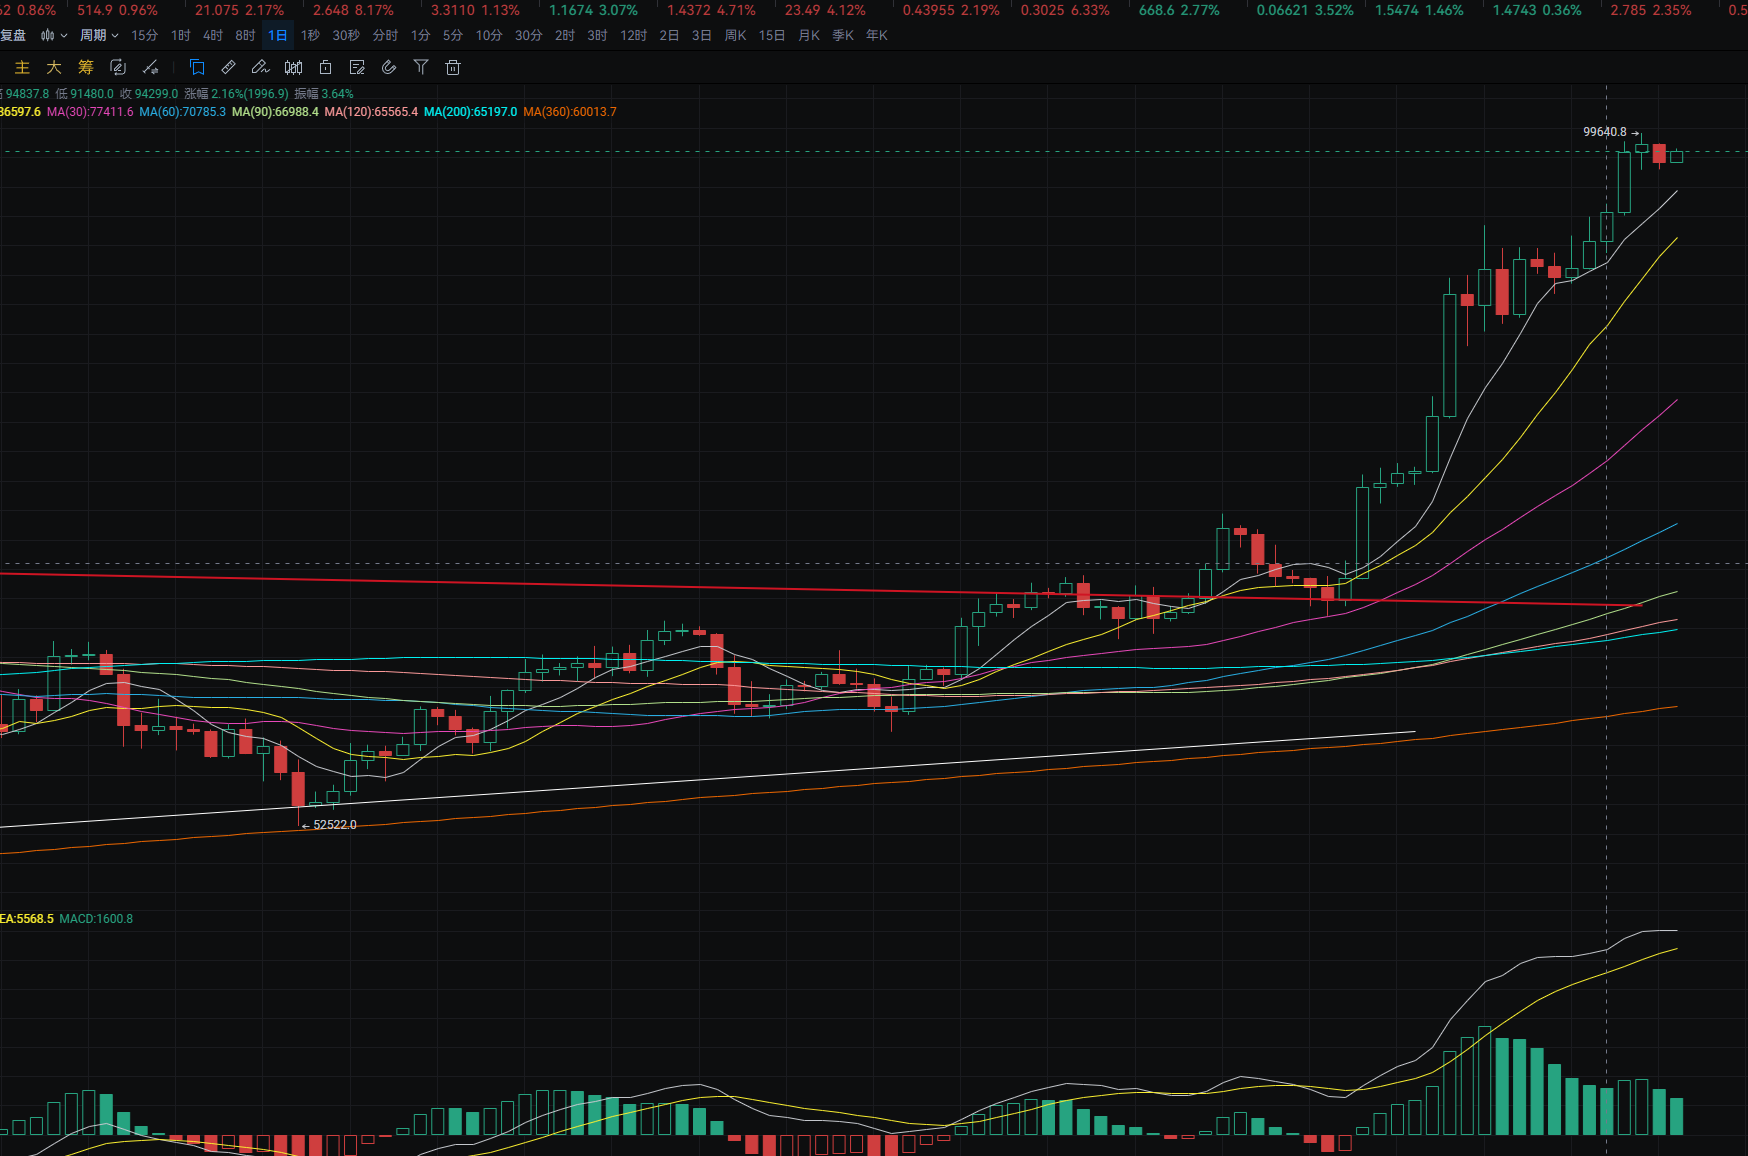
Bitcoin's daily chart showed a pullback yesterday, dropping from a high of around 98,950 to a low of around 97,150, closing around 97,700. The support level is near the MA7 moving average; if it breaks, it could drop to the MA14. A pullback can be used to buy near the support. The MACD shows a decrease in bullish momentum. On the four-hour chart, the support is near the MA30; a pullback can be used to buy near this level. The resistance is near the MA14; if broken, it could reach a new high. The MACD shows a decrease in bearish momentum.
ETH


Analysis
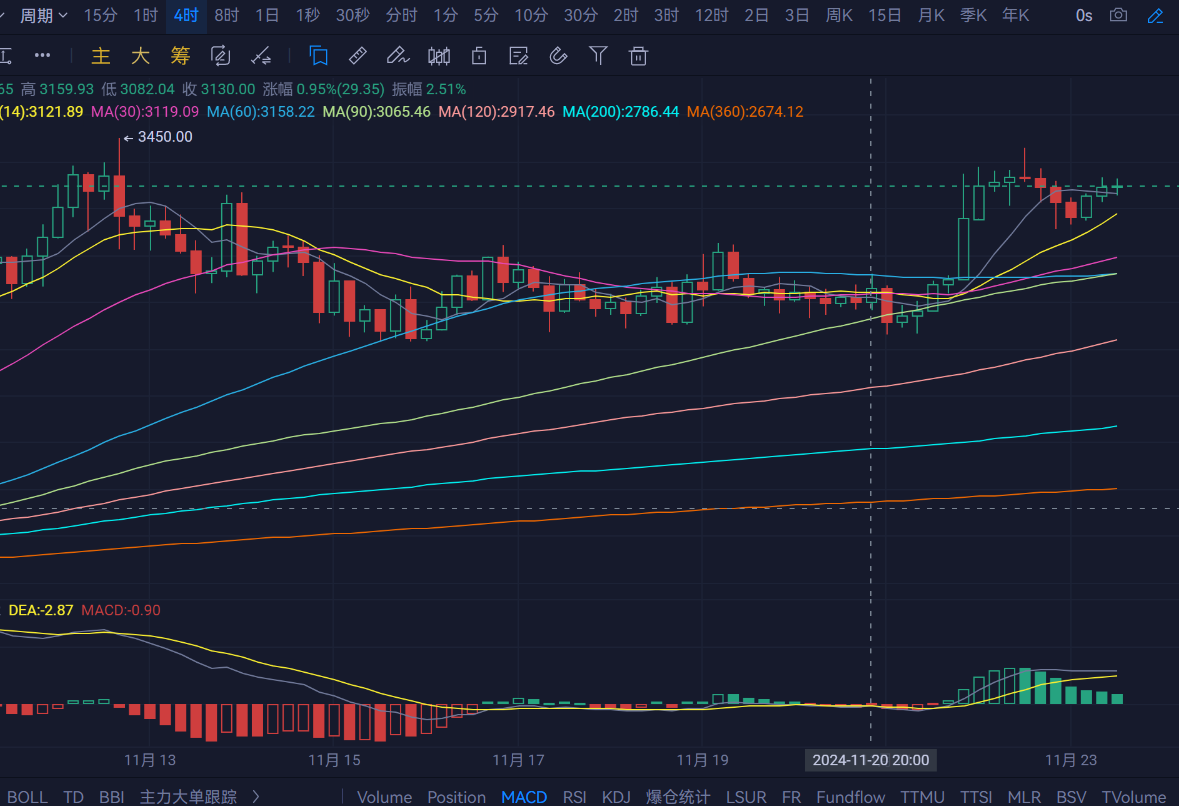
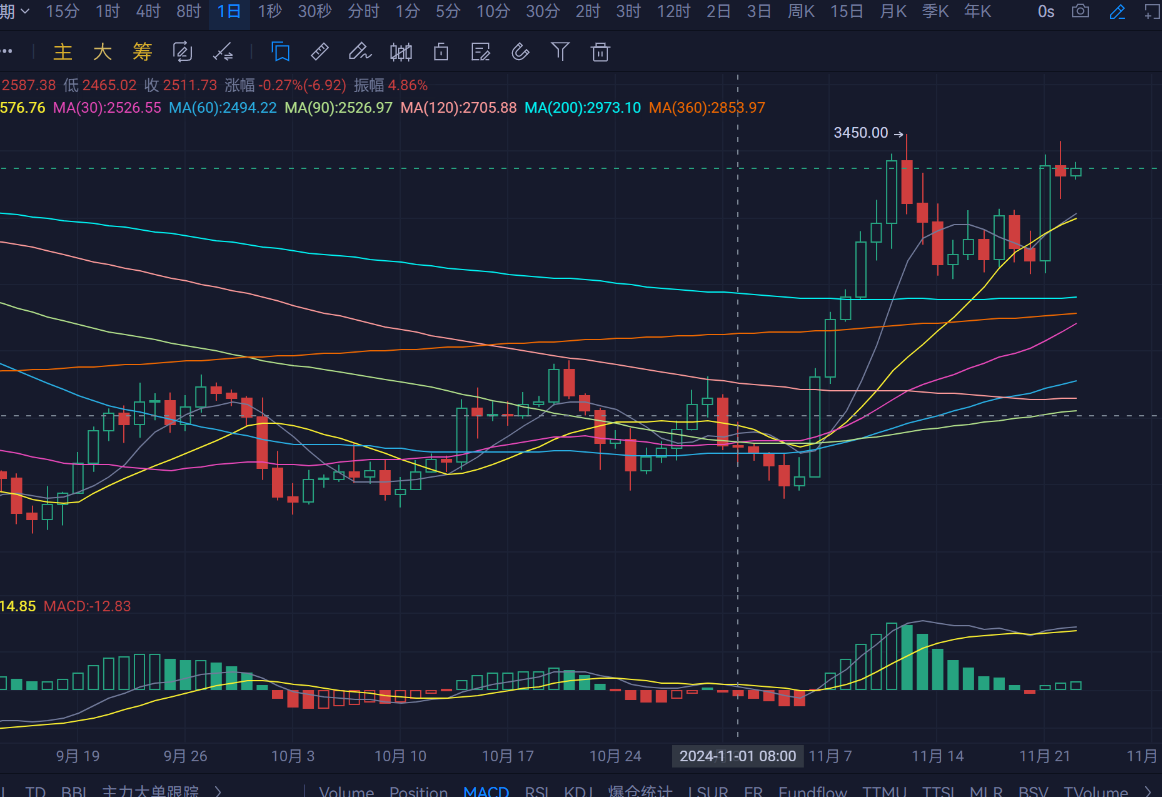
Ethereum's daily chart rose from a low of around 3,315 to a high of around 3,500 yesterday, closing around 3,400. The support level is near the MA7 moving average; if it breaks, it could drop to the MA14. A pullback can be used to buy near this level. The MACD shows an increase in bullish momentum. On the four-hour chart, the support is near the MA14; if broken, it could drop to the MA30. A pullback can be used to buy near this level. The MACD shows a decrease in bullish momentum and signs of a potential death cross.
Disclaimer: The above content is personal opinion and for reference only! It does not constitute specific operational advice and does not bear legal responsibility. Market conditions change rapidly, and the article may have a certain lag. If you have any questions, feel free to consult.
免责声明:本文章仅代表作者个人观点,不代表本平台的立场和观点。本文章仅供信息分享,不构成对任何人的任何投资建议。用户与作者之间的任何争议,与本平台无关。如网页中刊载的文章或图片涉及侵权,请提供相关的权利证明和身份证明发送邮件到support@aicoin.com,本平台相关工作人员将会进行核查。


