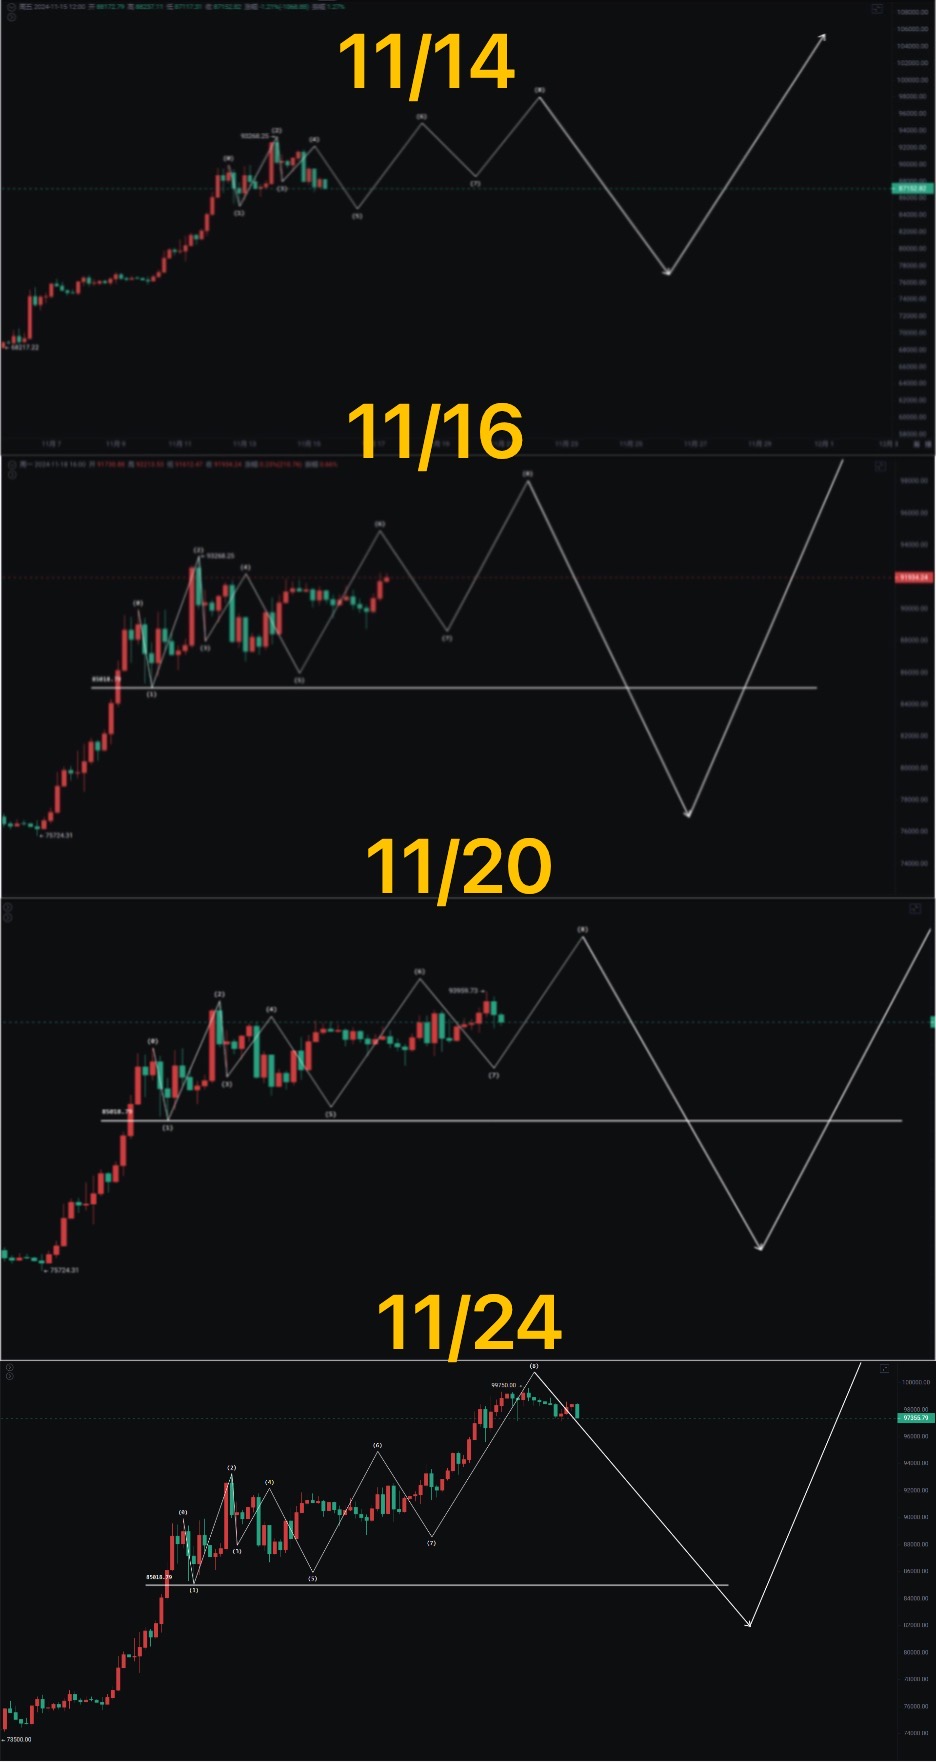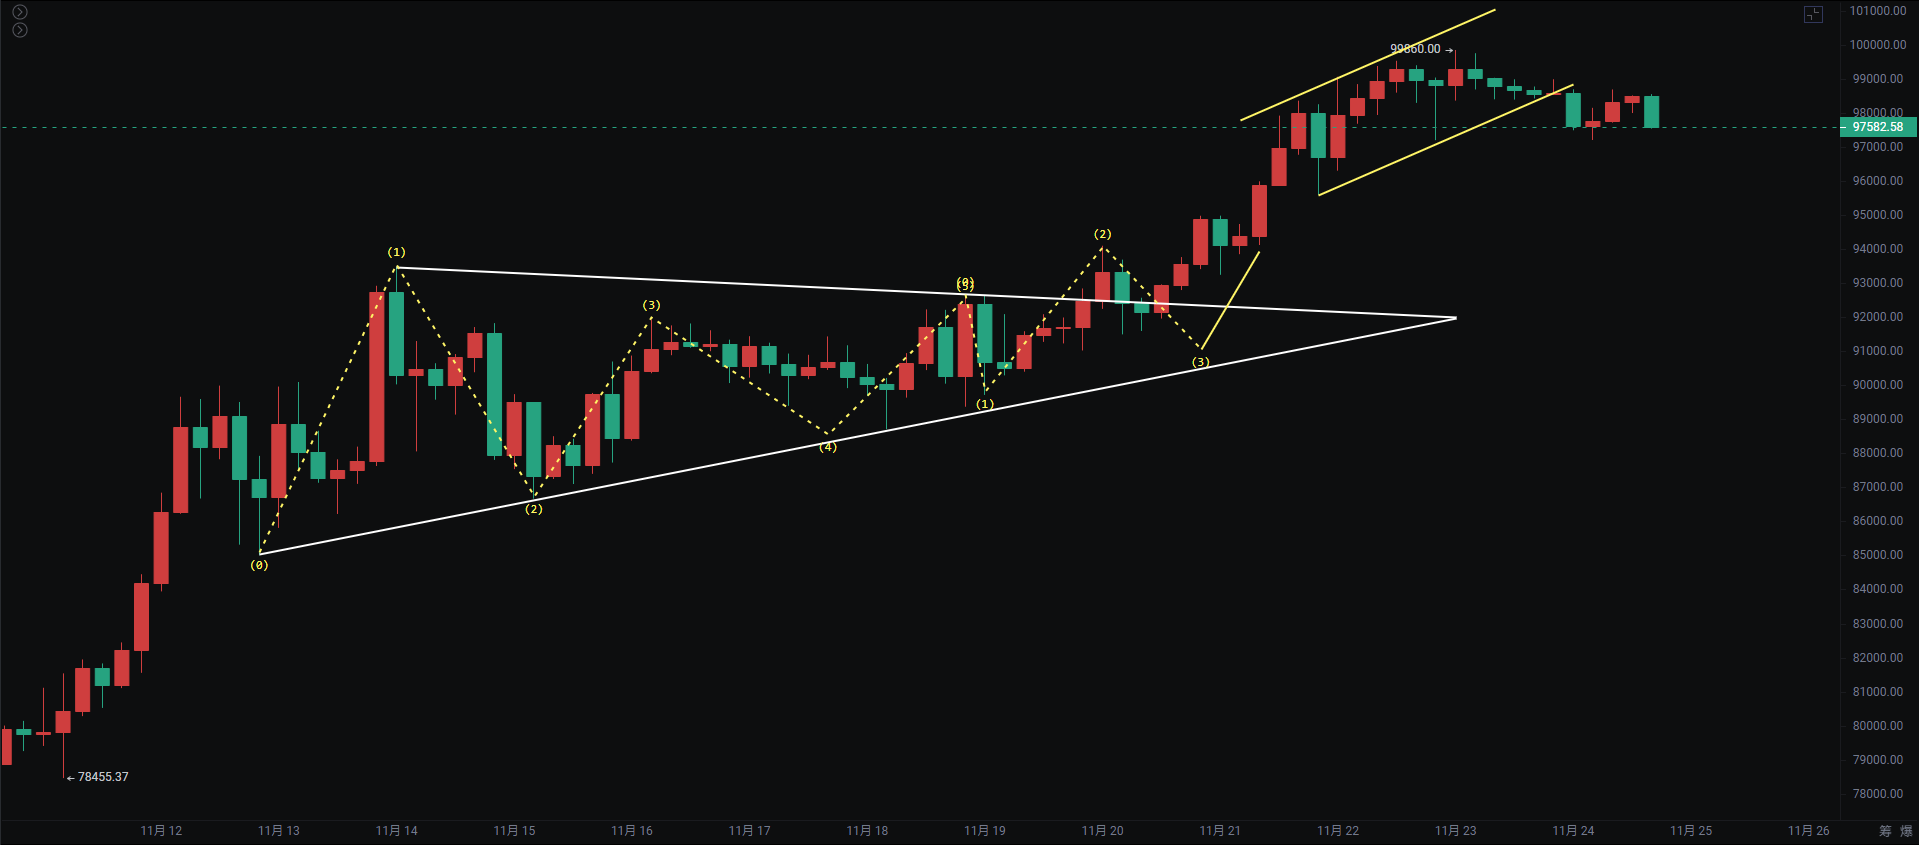
Bitcoin reached a high of 99,588, with a pullback of a few hundred points from 100,000. Last night, it retraced to 97,136 and rebounded, with a spike during the day to 98,564 before pulling back again. The 4-hour chart shows a spike and a double bullish engulfing pattern, and if it breaks down, there is a probability of retracing to the previous breakout level of 93,265.
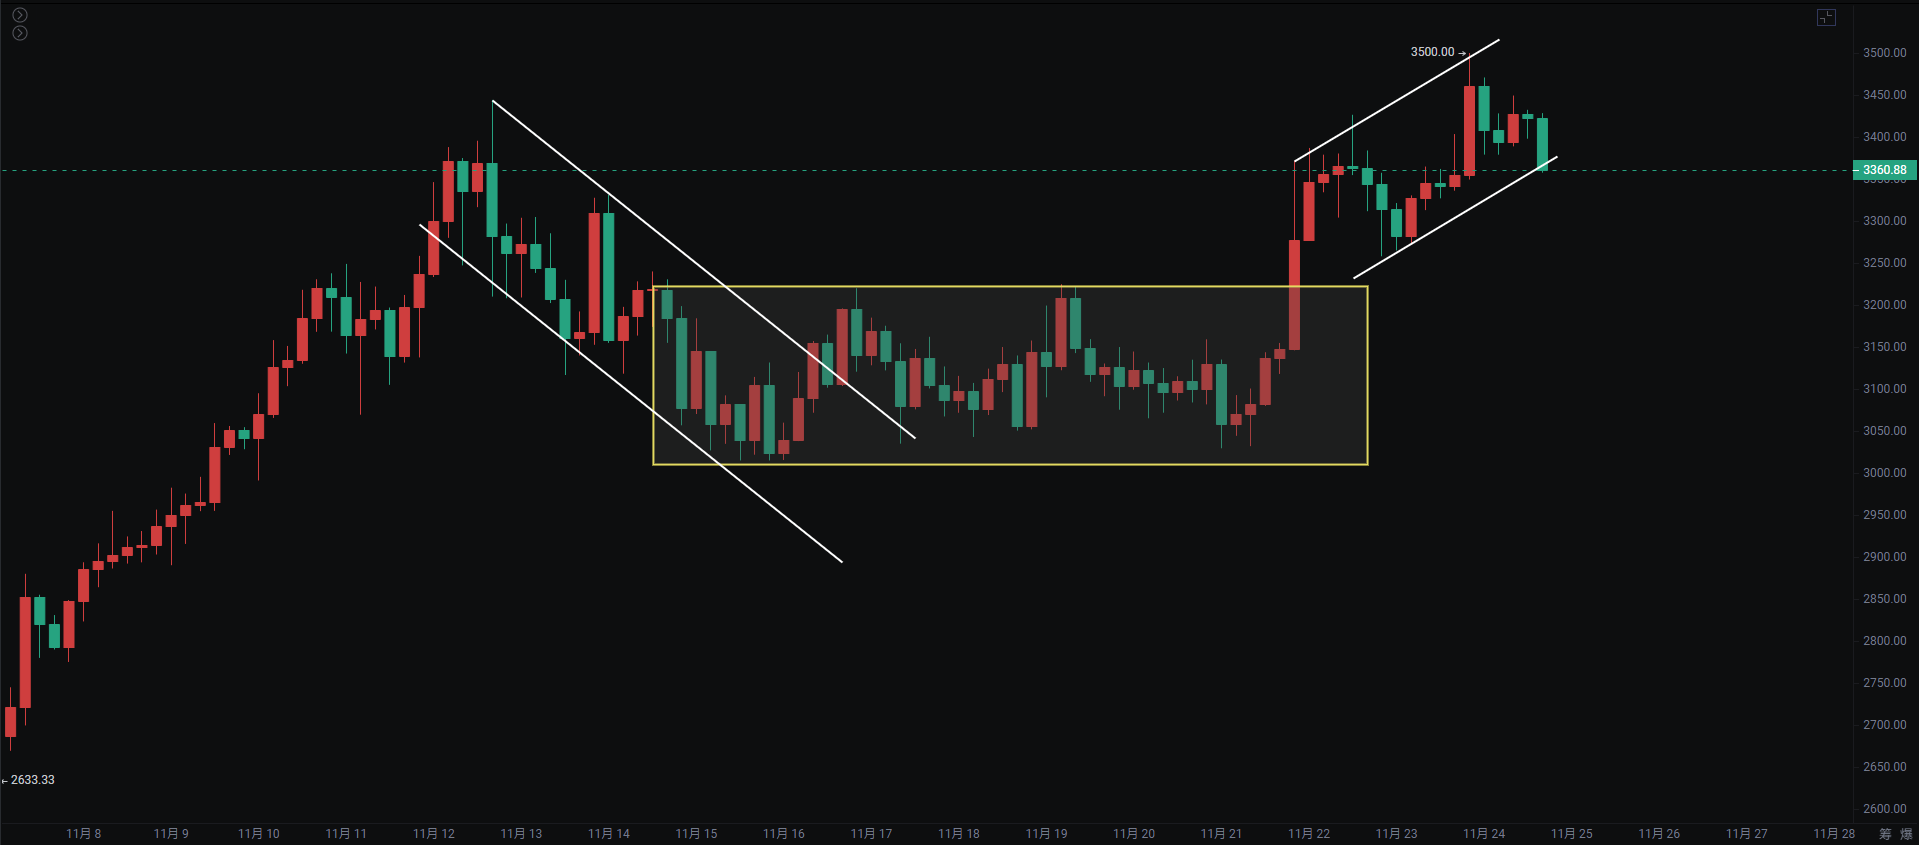
Ethereum is catching up, reaching a high near 3,500, and is currently still below the support level of 3,444. If it falls back, it could easily form a secondary high pullback. The altcoin GAMEFI metaverse sector, including SAND, MANA, and AXS, is leading in gains. The gaming sector is essential in a bull market, and those that have not yet seen significant gains include C98, YGG, PIXEL, and COMBO…

Elon Musk confirmed that the X platform will launch a remittance feature, but the market generally expects that Dogecoin may be included in the payment system. The Polkadot ecosystem tokens continue to rise, with KSM gaining over 90% in a single day, DOT up 36%, and GLMR up 18.2%.
The president of The ETF Store: The Solana ETF is expected to be approved by the end of next year at the latest. On the morning of the 24th, Tether minted an additional 2 billion USDT on Ethereum, which has been authorized but not issued, pushing the total market cap of stablecoins over 190 billion dollars, a new historical high.
Bitcoin
The 4-hour BOLL is narrowing, increasing the probability of a downward trend in the short term. The 4-hour chart has maintained an upward channel, which is currently testing the middle line support. The continuous top divergence on the 4H and 6H charts needs to be monitored to see if it extends to the daily chart. It is also important to note that this wave is at least a unidirectional trend dominated by the daily and weekly charts. A continuous top divergence on the daily chart would lead to a significant pullback, which can only be viewed as a short-term pullback, such as a retracement to the previous high support of 93,265 or the lower boundary of the channel.
The 4-hour chart previously formed an upward triangle, and after breaking down from the upward channel, the rebound has not reclaimed the previous level. The RSI and volume-price divergence should be watched for short-term pullback risks.
Support: Resistance:

Ethereum
After reaching a new high near 3,500, it has pulled back. After breaking through 3,444, it fell back, and the daily MACD shows divergence, with RSI and volume-price also showing divergence. The 4-hour BOLL has turned downward, and subsequent rebounds cannot create new highs, indicating that the downtrend remains unresolved.
Support: Resistance:

If you like my views, please like, comment, and share. Let's navigate through the bull and bear markets together!!!
The article is time-sensitive and for reference only, updated in real-time.
Focusing on K-line technical research, sharing global investment opportunities. Public account: Trading Prince Fusu

免责声明:本文章仅代表作者个人观点,不代表本平台的立场和观点。本文章仅供信息分享,不构成对任何人的任何投资建议。用户与作者之间的任何争议,与本平台无关。如网页中刊载的文章或图片涉及侵权,请提供相关的权利证明和身份证明发送邮件到support@aicoin.com,本平台相关工作人员将会进行核查。


