What was meant to come has finally arrived, albeit late!
In last Friday's article "Trend Extension," a warning about the high-risk level of BTC was issued again! After reaching a new high of 99,588 in the early hours of the 23rd, Bitcoin has been in a high-level consolidation for several days, including the weekend. Yesterday at 5 PM, it rebounded to sell at 98,871, and then dropped significantly in the early hours, hitting a low of 92,600, with the current price at 94,000.
Risks are always a result of price increases. This time, Bitcoin provided ample time for reducing positions before the major correction. Of course, those who couldn't reduce their positions at the high shouldn't panic; we are currently only experiencing a downward correction on the 4-hour level. The bull market is still in the mid to late stages, and the overall direction remains bullish. Long-term positions can still be held, waiting for signals from a larger structural level.
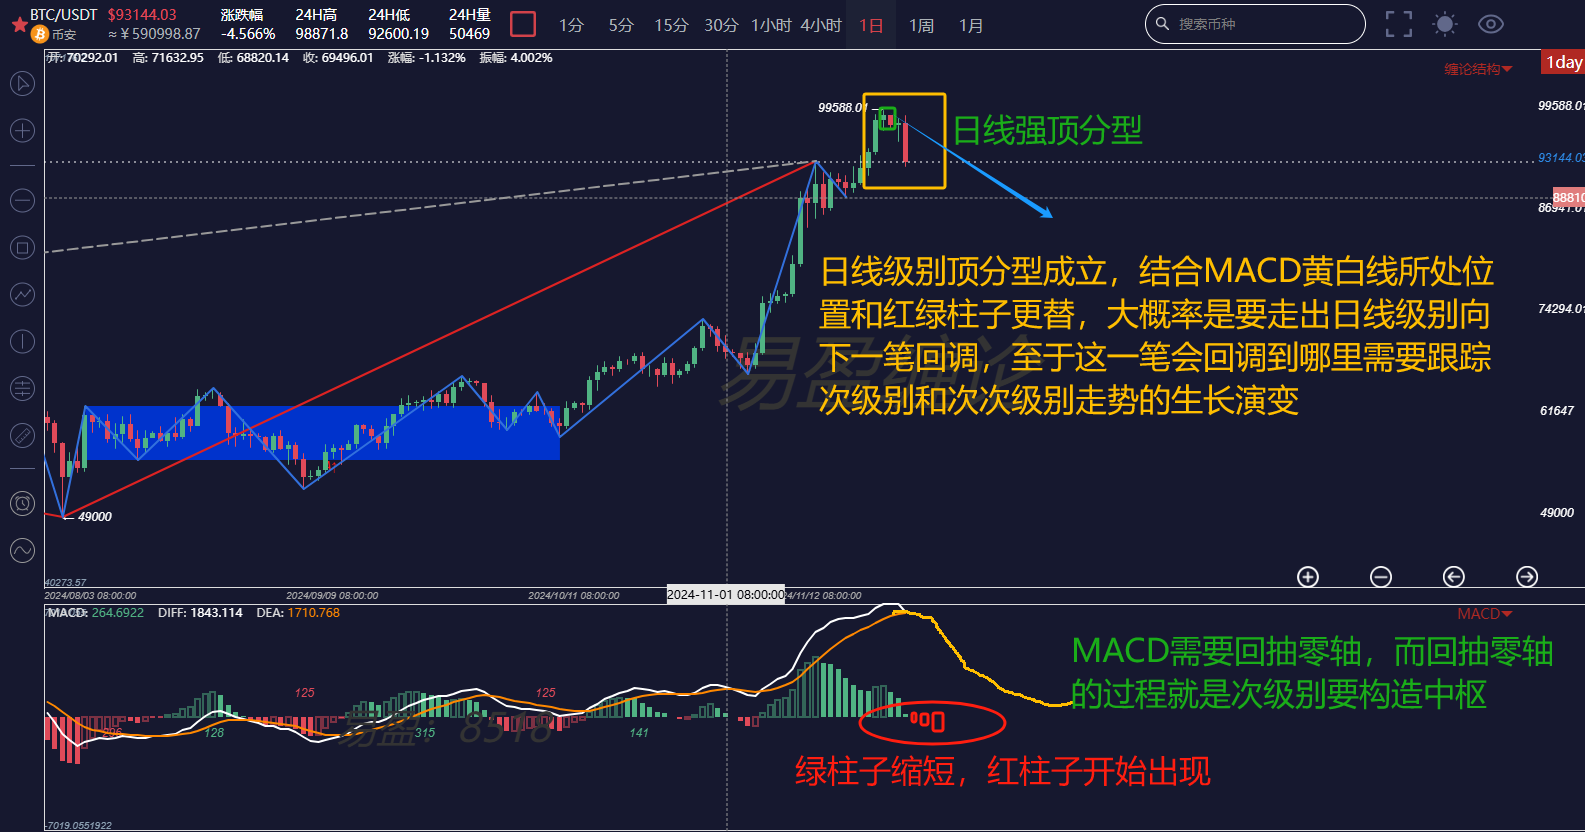
First, let's look at the daily chart of Bitcoin. The chart shows a strong top formation, and combined with the position of the MACD and the alternating red and green bars, it suggests that at least a downward correction on the daily level is needed. From this level's perspective, the high MACD pulling back to the zero line indicates that a secondary level needs to form a central structure. This means that after the secondary level's central structure is completed, there is a high probability of continuing to break upward.
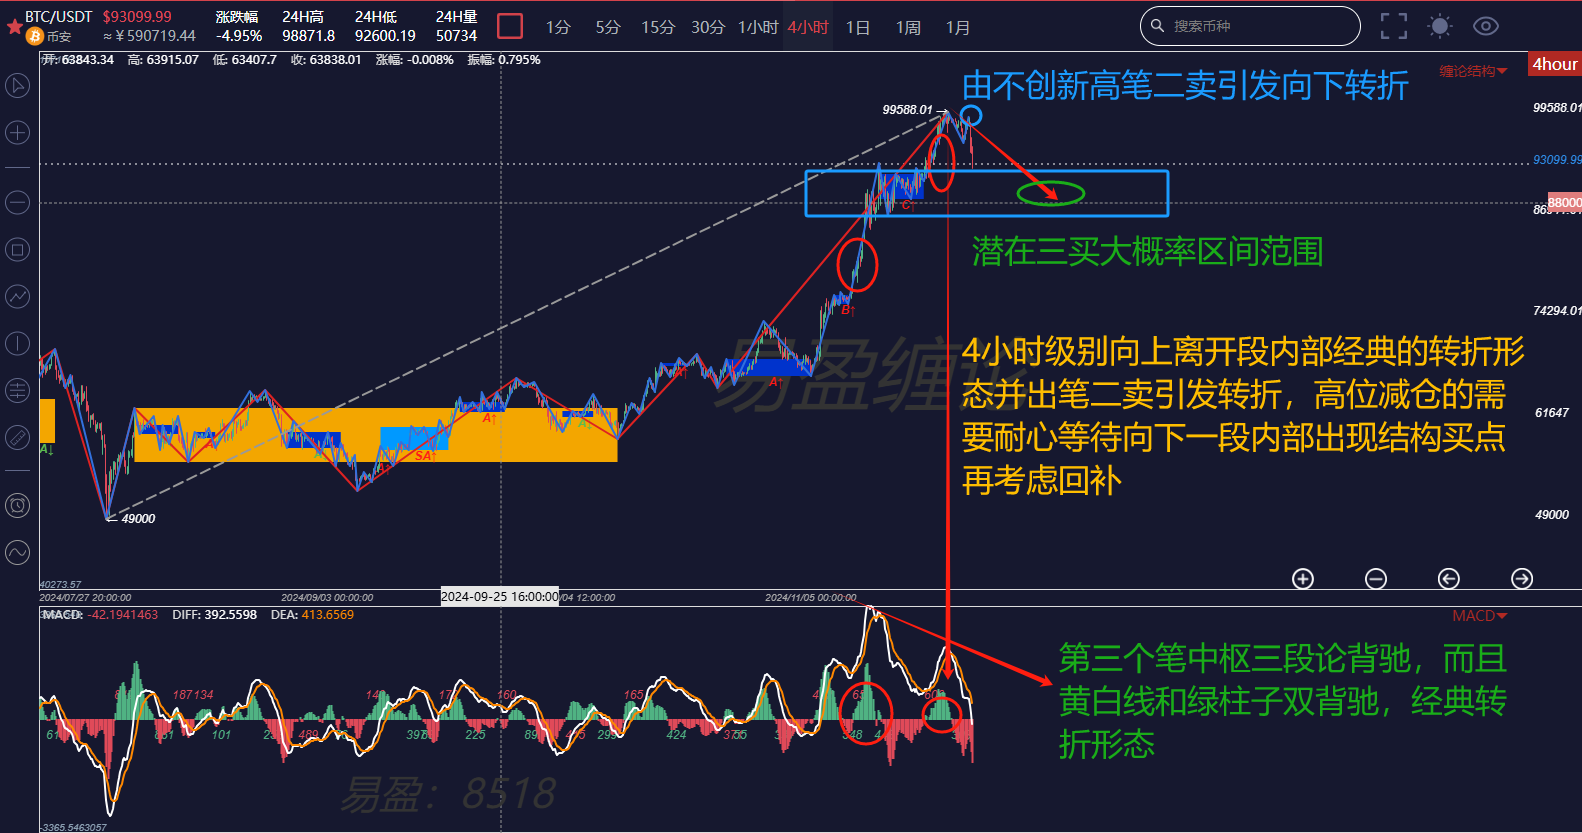
Next, looking at the 4-hour chart, we can see that within the upward segment, a three-part divergence pattern has formed, which is a classic reversal pattern in the Chande theory. A downward correction on the 4-hour level is about to occur, and the range for this correction can be referenced from the central range on the left side. There is a high probability that after a third buy signal, it will move towards the previous upward segment. As for the specific return position, we need to pay attention to the growth evolution of the secondary level's trend type.
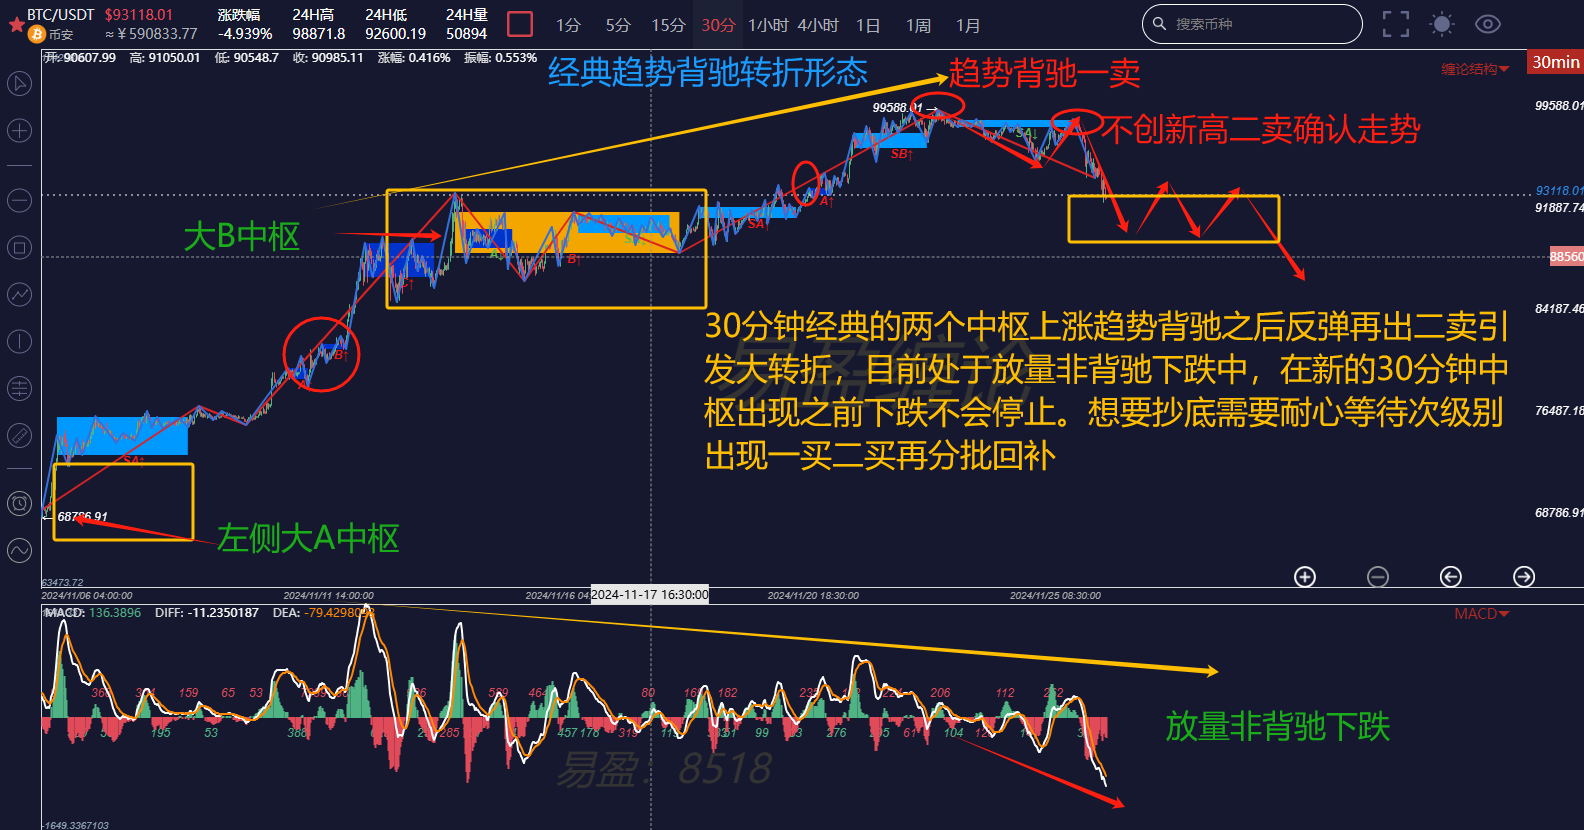
Finally, looking at the 30-minute level, the internal structure of the upward segment on the 4-hour chart can be seen very clearly at this level. After a downward correction from the classic two central upward trends, it rebounded to confirm the correction trend with a second sell signal.
Summary: From the current correction's intensity, it is in a volume-increasing, non-divergent downward state. Therefore, we can conclude that the decline will not end before a new 30-minute central structure appears. Those looking to bottom fish are currently only targeting the small-level bottoms on the 30-minute level and below. Opportunities at larger levels require patience, with a time frame of at least 7 to 10 days.
Trading is a system
Trading mantra, as the poem goes:
Strategy is fundamental, logic is the framework,
Indicators are auxiliary, structure is king.
Planning is the spear, discipline is the shield,
Risk is paramount, mindset is the defense.
The above analysis is for reference only and does not constitute any investment advice!
Friends, if you are interested in Chande theory and want to obtain free learning materials, watch public live broadcasts, participate in offline training camps, improve your trading skills using Chande theory, and build your trading system to achieve stable profit goals, utilizing Chande theory to time your entries and exits effectively. You can scan the QR code to follow the public account and privately chat to get and add this WeChat account!

免责声明:本文章仅代表作者个人观点,不代表本平台的立场和观点。本文章仅供信息分享,不构成对任何人的任何投资建议。用户与作者之间的任何争议,与本平台无关。如网页中刊载的文章或图片涉及侵权,请提供相关的权利证明和身份证明发送邮件到support@aicoin.com,本平台相关工作人员将会进行核查。