Conveying the Way of Trading, Enjoying a Wise Life.
Students who have been following us will find that the trading systems now are completely different from the trading systems we had two or three years ago. Of course, we have also learned from past advantages, but the perspective on trading technology itself, or the trading philosophy, has undergone a significant adjustment. All indicators and tools are just that—tools. The real purpose of these indicators is to determine the corresponding resistance levels, support levels, and even target levels. But essentially, the trading market cannot be fully understood; the market we see is merely a reflection of our cognitive range, not the essence of the market.
So does the market have an essence? In my view, it does not. If it had an essence, there wouldn't be a thousand people with a thousand opinions, which is to say, a thousand waves or a thousand faces. Therefore, the market we see is the market within our understanding.
Today, we will approach this from that perspective, using the channel tool to discuss the possible positions of Bitcoin's recent adjustment and its potential future rise. Why are we making this video? It is mainly based on many opinions suggesting that Bitcoin will reach $150,000 or $200,000. Each of these opinions could be correct or incorrect because trading cannot be fully understood, so predictions are merely predictions; otherwise, they wouldn't be called predictions. Now, let's get back to the point and look at Bitcoin's price trend.

Yesterday's closing was quite good, with a long bearish candle, which was a 6.41% drop, the largest decline in nearly a month. Some say that at this position, the main force is offloading, while others believe it is just a normal pullback. From yesterday's candlestick chart, there was no significant volume, as long as there is no significant volume, it generally does not indicate that large institutions or major players are offloading. Therefore, a normal technical pullback will become the main tone of this period, so there is no need for everyone to panic too much.
The pullback is due to the exhaustion of bullish momentum, which has already been reflected in the MACD indicator. As a commonly used tool, you will find that the bullish momentum, as shown in the daily chart, indicates a retreat, meaning the upward momentum has weakened. Those who should take profits have taken some, and those who should break even have also done so. Thus, Bitcoin's momentum is declining, and the daily chart also shows a death cross, indicating a divergence at the daily chart level, so the adjustment won't be too low. It may exceed some people's expected values, but what is truly tested is faith, your grasp of the trend, and your endurance for profit withdrawal from your account; 99% of people cannot pass this test.
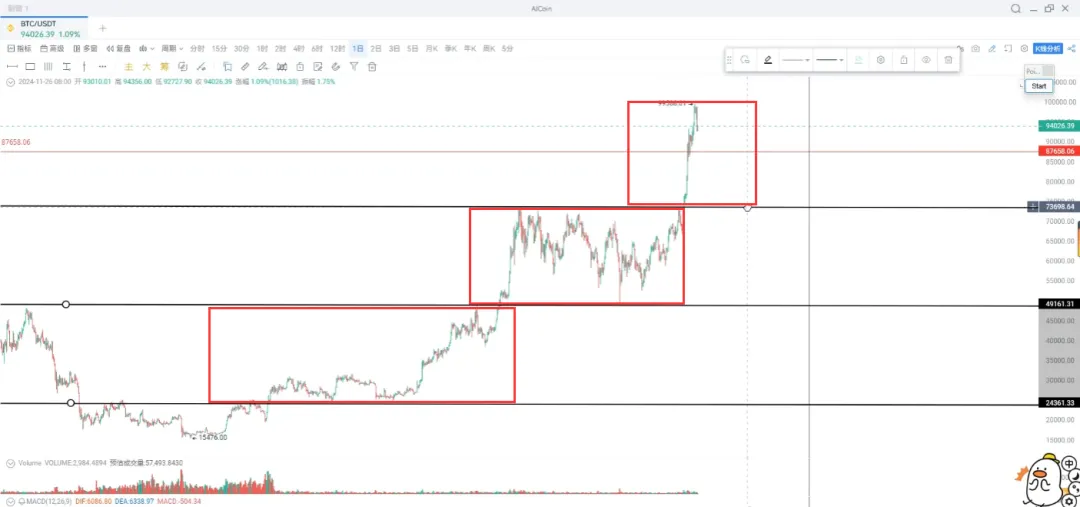
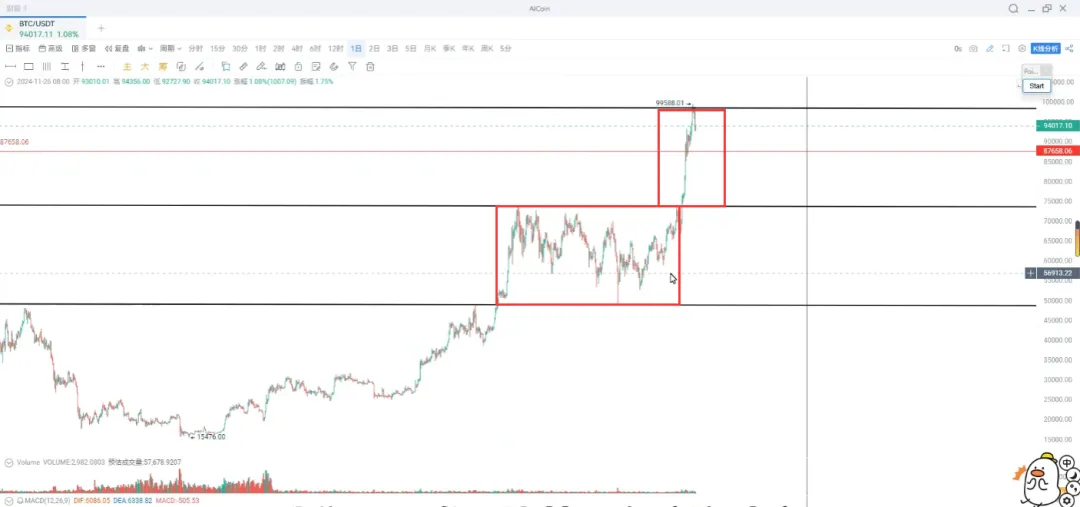
So what position is Bitcoin most likely to return to? We can see that Bitcoin has actually consolidated in this area for a month, and you will find that it has just gone through two channels. So has Bitcoin finished rising this time? Of course not. We can see that during this time, Bitcoin has gone through two channels and consolidated in one channel.

In this channel, we need to know that when we drift down again, you will notice a problem: in the previous wave of the market, during this wave, it also went through two channels in a bull market. Therefore, during this drop, it also dropped through two channels. So, when Bitcoin starts the channel, the starting point is at $19,000, which is a historical high formed in 2017. After breaking this high, it went through two channels.

We know that Bitcoin's price is very likely, if we measure it by this method or rule, that after Bitcoin goes through two channels, it will first drift upward. When it breaks the historical high at this position, it may go through two channels. These two channels should be a high-probability event.
So, if Bitcoin goes through such two channels, the price could reach around $120,000 to $130,000, and it may even reach $140,000. Therefore, some people in the market say $150,000, $180,000, or $200,000; those are others' opinions, and everyone's views are different. When it reaches this position, that is when the real risk will manifest.
At this position, it may experience a larger pullback. So this time, it is just a pullback in the upward continuation. To know the most likely position for the pullback, we need to wait for the MACD indicator to return to the 0 axis, or to form a golden cross again. Correspondingly, in terms of price, we need to see this secondary line because Bitcoin has broken through, pulled back, and after the pullback, this position may become a very important support level at $85,000.
Bitcoin actually still has room to decline. My view is that it has not yet completed a pullback; at least, the pullback has not been confirmed. Therefore, the next two weeks, or one week, will be relatively difficult. Whether Bitcoin is consolidating at a high level or pulling back, it is a normal phenomenon, but it does not mean that the market has no improvement.

We can look at it from another angle: Bitcoin's market cap ratio has actually reached a high point of 61.5%, and it is currently declining. So, its market cap ratio is starting to fall. What does the decline in its market cap ratio mean? It means that when Bitcoin reached a high point earlier, the market cap ratio also indicated that funds would start to flow out of the Bitcoin market.
So where is the money flowing to? The first is stablecoins. After flowing out, it may return to stablecoins. From historical trends, over the past ten years, this is a trend line, so every time it pulls back to this trend line, the market cap ratio of stablecoins starts to rise. This also means that Bitcoin is about to decline, which is the direction of this portion of funds flowing out.
What is the second part? There are altcoins. As for the market cap ratio of altcoins, we also pay close attention to it. During this period, it has also reached a low point, and after the low point, we can see that it is also a trend line. So at this position, you will find that the market cap ratio of altcoins is also starting to rise. What does this mean? It means that there is a high possibility of a rotation of altcoins occurring next, but it is not certain. Because funds are flowing into stablecoins on one hand and into altcoins or Ethereum, SOL, etc., on the other hand, the first wave of rising funds may experience outflow.
So how do we respond to this situation during this phase? We need to look at the technical aspects, have expectations, and secondly, we need to guard against risks, which vary from person to person. From my perspective, the overall trend is upward; it is just a mid-course pullback. Therefore, in terms of position control, I may not reduce it too drastically; I still maintain a relatively high position because there is a lot of profit at the bottom that needs to be consumed, which will not affect your larger emotions. However, some people, when their capital is not particularly large, may want to make a swing trade, then sell at a high position and buy back at a low position. I can only tell you that you may miss out.
So this is a different situation, and the method of position control varies from person to person. You need to decide which one you are. At least, at this position, to be safe, you can maintain about 60-70%, and 80% would be great. When Bitcoin returns to a certain position, we can slowly add to our positions again. As for which sectors will rotate or rise, we have emphasized this since last Monday and the previous week. Bitcoin's price is likely to flow into which coins and altcoins during the pullback process, and you can consult in the group chat. Alright, that concludes today's sharing.
For more information, you can contact our assistant and join the VIP group.
免责声明:本文章仅代表作者个人观点,不代表本平台的立场和观点。本文章仅供信息分享,不构成对任何人的任何投资建议。用户与作者之间的任何争议,与本平台无关。如网页中刊载的文章或图片涉及侵权,请提供相关的权利证明和身份证明发送邮件到support@aicoin.com,本平台相关工作人员将会进行核查。


