Don't worry about having no friends on the road ahead; there are like-minded individuals on the investment path. Good afternoon, everyone! I am the King of Coins from the Coin Victory Group. Thank you all for coming here to watch the King's articles and videos, and I hope the brothers who have been following the King will return.
Click the link to watch the video: https://www.bilibili.com/video/BV1yszbYoENY/

Market Dynamics Review:
In the midday analysis on November 27, we proposed a short-selling strategy at the 9.46 and 3500 points. In the midnight strategy, we suggested shorting Ethereum at the 3650 points. This strategy successfully achieved a 100-point profit after Ethereum's price rebounded to a high of 3680 before pulling back to 3780. Now, with the price rebounding and falling again, we provide the following analysis to guide you on the next steps.

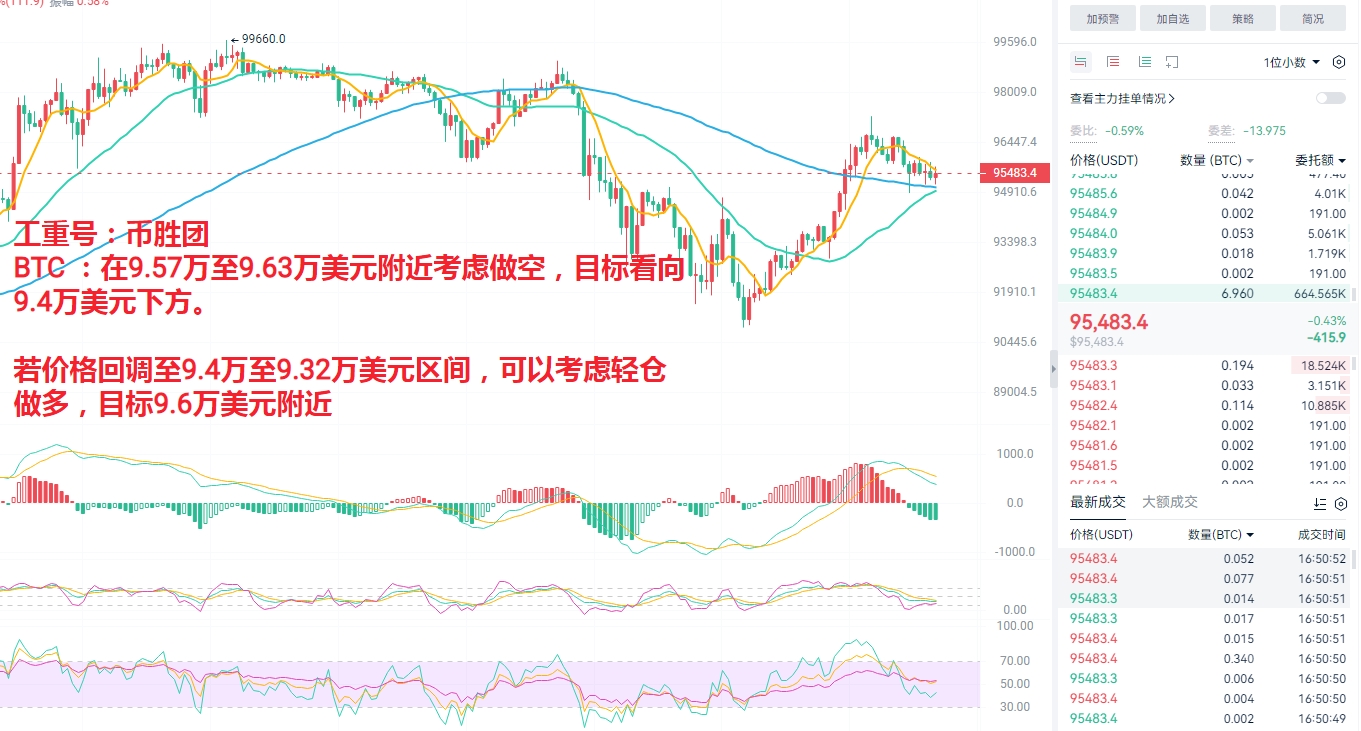
Bitcoin (BTC) Midday Market Analysis
Daily Chart Analysis: Yesterday, the Bitcoin market performed strongly, with a large bullish red K-line on the daily chart. The price broke above the MA5 and MA10 moving averages and formed an upper shadow, indicating strong bullish momentum. During the day, there was a slight pullback to around 95,000 USD, and we need to pay attention to whether the price can stabilize above the daily MA5/10 moving averages.
4-Hour Chart Analysis: On the 4-hour level, Bitcoin's price briefly pierced the MA30 moving average before falling below the MA60 moving average. Currently, we need to focus on the support situation in the 95,000-95,500 USD range, which is also the support of the MA256 moving average on the 1-hour chart. If it can hold above 95,000 USD, the market will still treat it with a bullish bias; if it breaks below, it may enter a weak consolidation phase.

Midday Trading Suggestions:
Consider shorting near 95,700 to 96,300 USD, targeting below 94,000 USD.
If the price pulls back to the 94,000 to 93,200 USD range, consider light long positions, targeting around 96,000 USD.

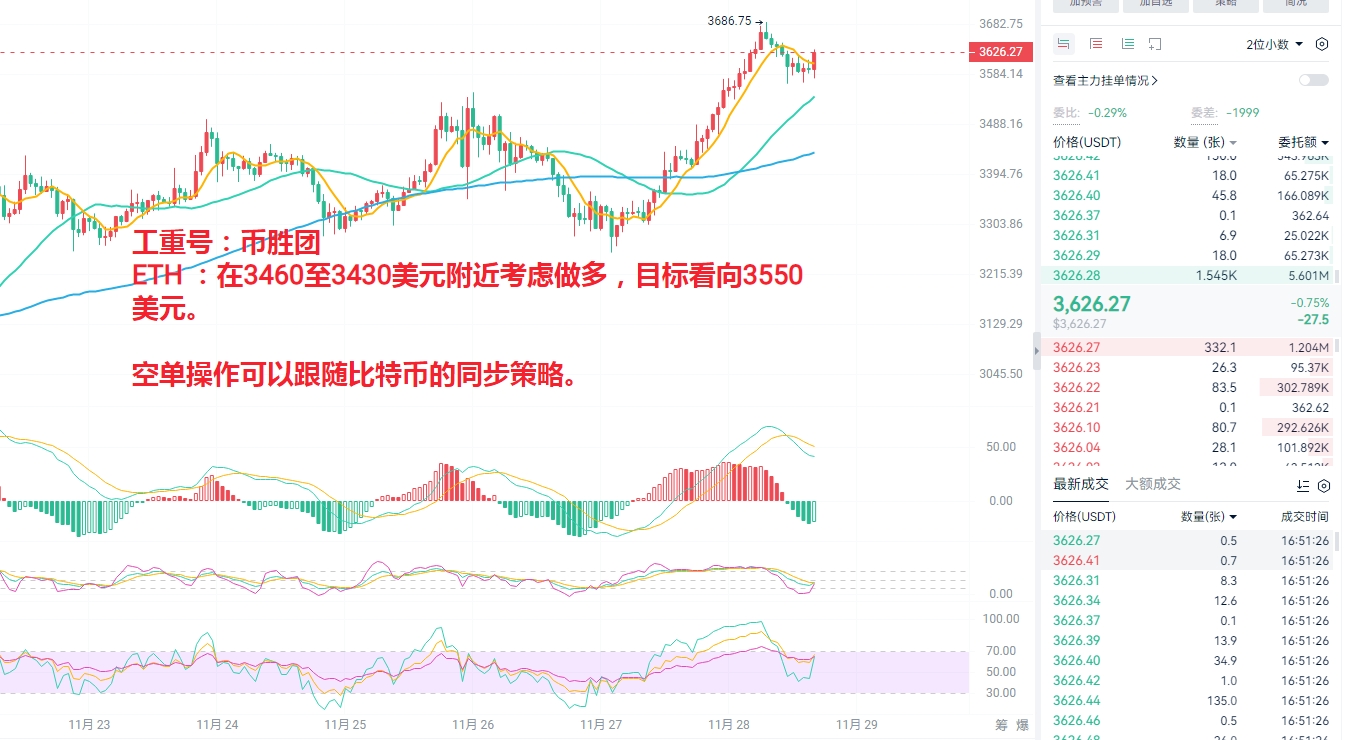
Ethereum (ETH) Midday Market Analysis
Daily Chart Analysis: Ethereum also performed strongly yesterday, with a large bullish candle on the daily chart, reaching a high of 3680 USD. The current price is far from the MA5/10 moving averages, and we need to watch for a potential pullback to test the support of the daily MA5 moving average (3470 USD).
4-Hour Chart Analysis: On the 4-hour level, Ethereum continuously formed bullish candles yesterday, with the price moving upwards along the MA5 moving average. The price has now pulled back to the MA5 line, and we need to monitor whether it will break below this line, potentially testing the 3480 USD level.

Midday Trading Suggestions:
Consider going long near 3460 to 3430 USD, targeting 3550 USD.
Short positions can follow the synchronized strategy with Bitcoin.
IV. Summary and Risk Warning
The cryptocurrency market is full of variables and opportunities. Past trends provide references for current decisions but cannot fully define the future. Investors should closely monitor real-time market dynamics when operating based on the above strategies, flexibly adjust positions and strategies, and manage risks reasonably to achieve ideal returns in this digital asset game.

This article is independently written by the Coin Victory Group. Friends in need of current price strategies and solutions can find the Coin Victory Group online. It mainly focuses on spot trading, contracts, BTC/ETH/ETC/LTC/EOS/BSV/ATOM/XRP/BCH/LINK/TRX/DOT, specializing in styles, mobile lock-up strategies around high and low support and resistance short-term fluctuations, medium to long-term trend positions, daily extreme pullbacks, weekly K-top predictions, and monthly head predictions.
免责声明:本文章仅代表作者个人观点,不代表本平台的立场和观点。本文章仅供信息分享,不构成对任何人的任何投资建议。用户与作者之间的任何争议,与本平台无关。如网页中刊载的文章或图片涉及侵权,请提供相关的权利证明和身份证明发送邮件到support@aicoin.com,本平台相关工作人员将会进行核查。


