Since December 5, when BTC officially broke through $100,000 and peaked at $104,088, it has ended a one-sided upward trend and entered a high-level wide-ranging oscillation pattern. The oscillation range is between $102,000 and $94,000, with a fluctuation of 8,000 to 10,000 points. The current price is $101,488.
The high-level wide-ranging oscillation has lasted for more than 10 days, indicating that the market's consistent expectation of rising has been broken, and both bulls and bears have diverged on the price, engaging in intense tug-of-war and competition around the relative price range. As time passes and news impacts the market, one side will eventually overcome the other and break out of this oscillation range.
A key point to focus on in the news is the Federal Reserve's interest rate decision meeting next Thursday morning. The market generally believes that the probability of the U.S. lowering interest rates by 25 basis points exceeds 94%, and this timing may trigger a major showdown between bulls and bears, ultimately determining the medium-term direction of Bitcoin.
Another point to note is that the U.S. Bitcoin spot ETF has seen significant net inflows since the beginning of this month, which has provided a solid foundation for Bitcoin to maintain its high-level oscillation. Without the continuous net inflow of the ETF, the market's bulls and bears might have already determined the outcome. However, it is worth noting that the ETF cannot maintain significant net inflows indefinitely; when the inflow of funds decreases or even turns into outflows, it is likely to be a turning point for the market.
Today is already December 14, close to the end of the year and Christmas. At this time, market capital flow changes can be very active, which is something to be cautious about.
Returning to the current market situation, through the analysis of various levels of trends using the Chande theory, both the large-scale weekly and daily levels of BTC do not show sell signals, indicating that the long-term cycle will continue to rise. However, a bullish long-term outlook does not mean that there won't be short- to medium-term corrections. There is no market that only rises without falling; short- to medium-term corrections are certainly for better upward movements in the future. Only through a certain degree of correction can the market consolidate its foundation and ensure a healthier, higher, and further future for Bitcoin!
This account has been reminding everyone of the buying opportunities at the 4-hour level since the crash to $49,000 on August 5 and for a considerable time afterward, and has repeatedly stated during live analysis that it would not sell until Bitcoin breaks the high point of $73,777. Ultimately, it captured a perfect wave of the main upward trend, and when Bitcoin broke through $100,000 on the morning of December 5, reaching the peak of market sentiment, this community announced a significant reduction in positions to secure profits.
After several oscillation rebounds, the positions have been reduced further. Now, the focus is on patiently waiting for at least a 4-hour level buying opportunity to re-enter.
Bitcoin is oscillating at a high level, and there are no trading opportunities across various levels, with only trading opportunities available in the central oscillation of the 1-hour level and below.
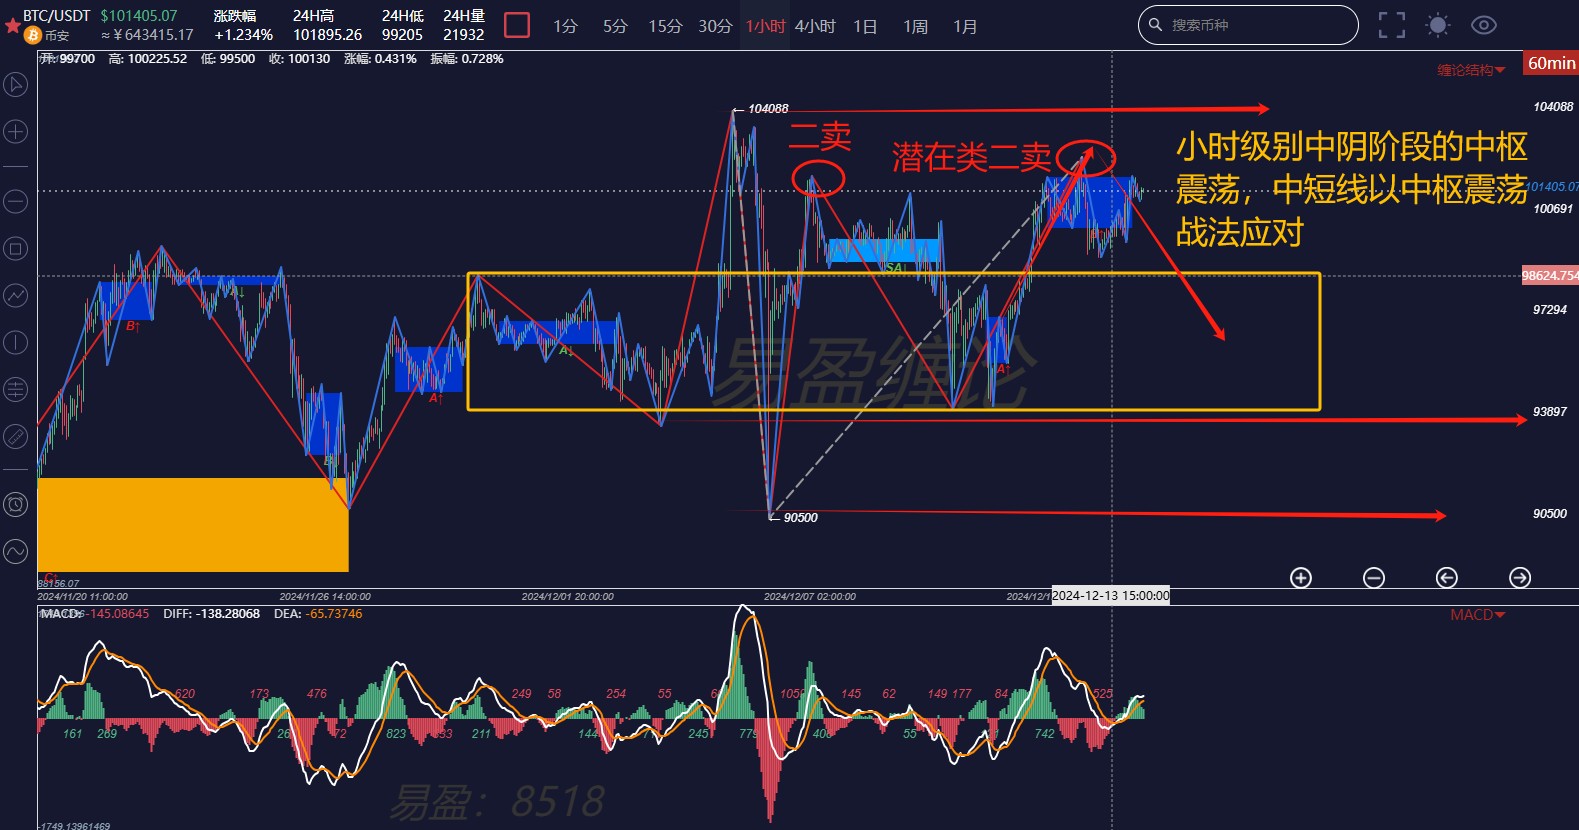
Looking directly at the hourly chart, the yellow box indicates the central area. The current price is above the central area, which is a potential second sell signal at the 1-hour level. For short-term traders, it is advisable to sell first and buy later when a sell signal appears. Even if a new high is broken, it is likely to be a divergence sell signal, and those with heavy positions should primarily focus on reducing their holdings.
For those who have captured the main upward trend and have already reduced their positions, as we approach the turning point, the best approach is to patiently wait for opportunities. Small-level fluctuations can be chosen to be ignored, and it is perfectly fine to take a comfortable break for a while; sometimes resting is the best trading strategy.
The above analysis is for reference only and does not constitute any investment advice!
Friends, if you are interested in the Chande theory and want to obtain free learning materials, watch public live broadcasts, participate in offline training camps, improve your trading skills, build your trading system to achieve stable profit goals, and use Chande techniques to escape peaks and buy bottoms in a timely manner, you can scan the QR code to follow the public account and privately chat to get and add this account's WeChat!

免责声明:本文章仅代表作者个人观点,不代表本平台的立场和观点。本文章仅供信息分享,不构成对任何人的任何投资建议。用户与作者之间的任何争议,与本平台无关。如网页中刊载的文章或图片涉及侵权,请提供相关的权利证明和身份证明发送邮件到support@aicoin.com,本平台相关工作人员将会进行核查。