

The current trend is very similar to the period at the end of 2023 and the beginning of 2024.
In terms of price increase: In 2023, the price rose from 24,900 to 49,000 and from 52,500 to 108,353, both around a doubling.
In terms of pattern: The price moved in a range from 24,900 to 31,800 for 224 days before breaking out, and from 49,000 to 74,000 it oscillated in a rising flag pattern for 238 days. After breaking 40,000 in 2023, it formed a broadening triangle, and after breaking 90,000 in 2024, it also formed a broadening triangle, which lasted about 35 days.
In terms of time: Previously, we mentioned that after more than 7 months of oscillation, the beginning of each month is likely to see a change in trend, so the probability of a trend change in the first week of next month is relatively high. (This was mentioned in the article on 24/12/29, reminding that the adjustment is about to end, and that it is the best time to accumulate positions gradually, coinciding with the new crypto president taking office during the Spring Festival!)

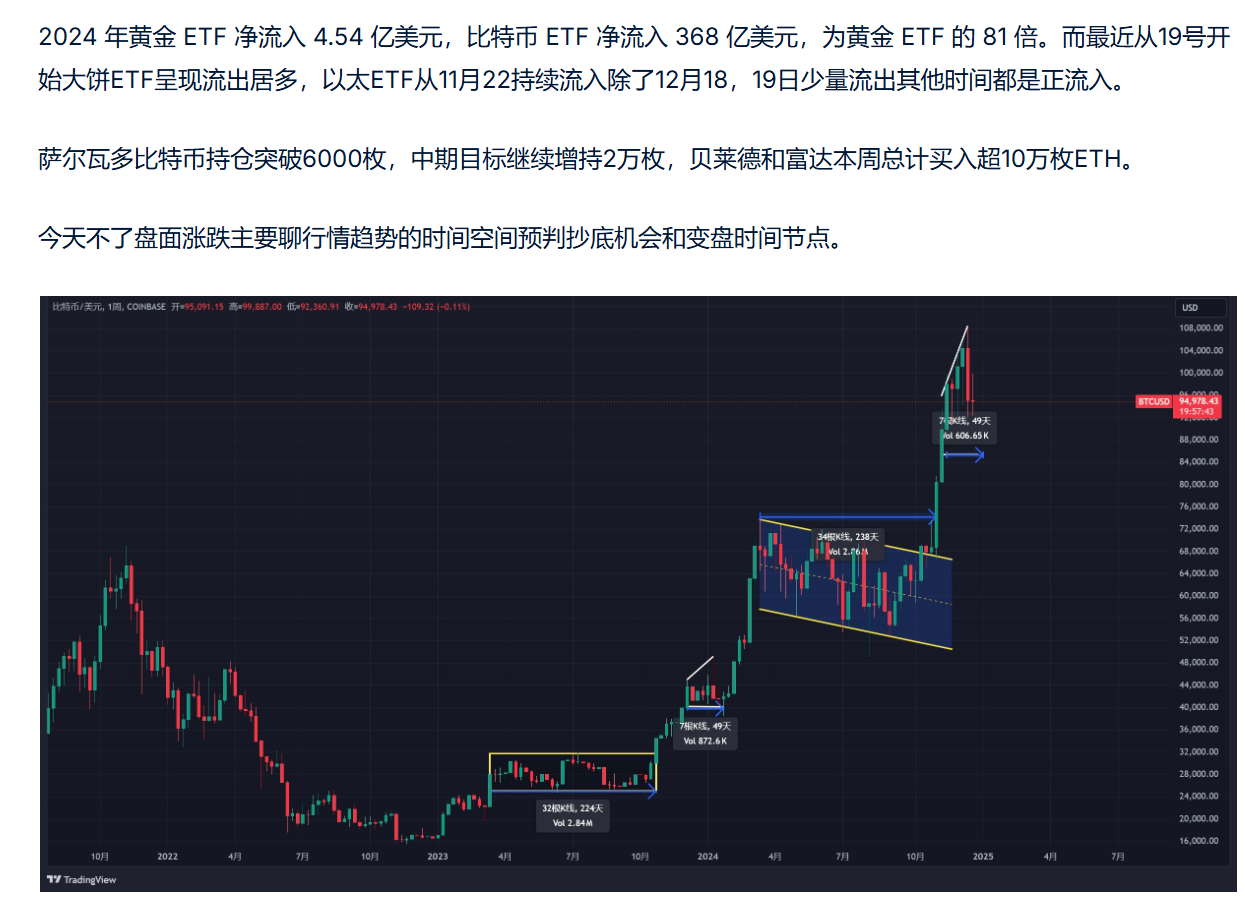
After a long journey of over a decade, the Bitcoin spot ETF was finally approved by the U.S. SEC on January 10, 2024. After spiking to 49,000 on January 11, it quickly dropped. On the 12th, we warned that Grayscale's GBTC had significant selling pressure due to safety concerns, leading to a prolonged selling wave from Grayscale over the next few months, which directly affected the high-level oscillation from March to June.
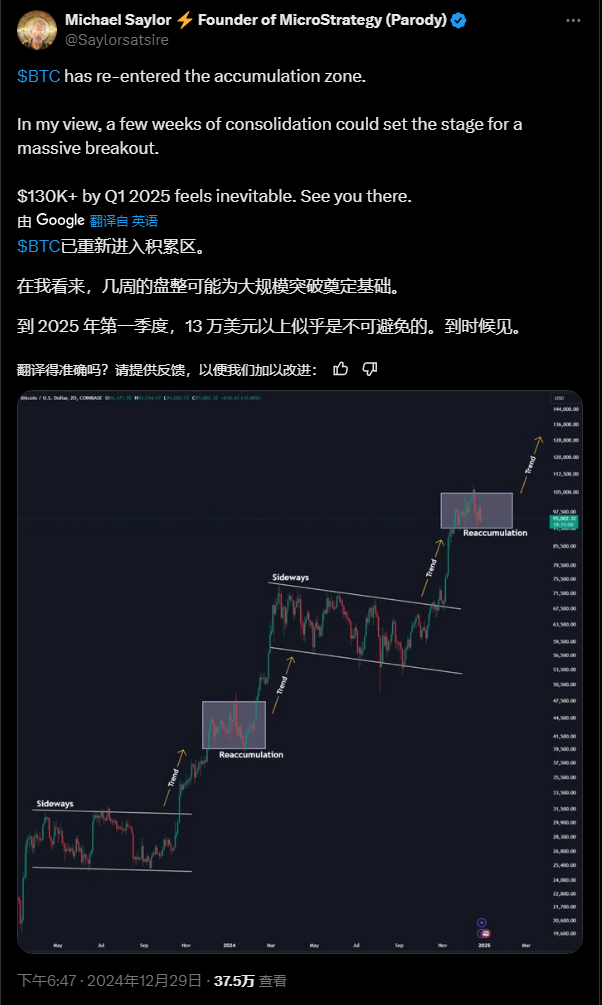
Subsequently, after a pullback to a low of 38,500, we reminded to fill the gap between 39,200 and 40,300, noting that there is usually a Spring Festival market every year, as seen in 20-23, and we believe there will also be a market during the Spring Festival of 2024. After a false drop below 38,555, we entered at 39,500, but I planned to reduce positions around 48,000. (Although there was a misjudgment) However, the subsequent inflow of ETF funds directly broke through, pushing the price to oscillate between 50,000 and 52,000, continuing to turn bullish.
After that, Bitcoin began a series of daily surges of 3,000 to 4,000 points, breaking through the previous bull market high of 69,000 to reach a peak of 73,777.
On 24/03/05, Morgan Stanley announced the launch of an ETF, and Bitcoin approached its previous high. Is there a chance to reach 80,000 before the halving? The price keeps soaring, and the risks are increasing.
On 23/03/08, the Egyptian currency collapsed, plummeting by 40%, and Bitcoin was rejected at its previous high in a one-day drop, raising concerns about short-term pullback risks.
On 24/03/11, BTC reached a new high of 70,000, but the weekend rebound was again rejected, warning of short-term pullback risks.
On 24/03/15, the pullback was for a better rise, with BTC showing a potential cup and handle pattern on the weekly chart, one of the bullish continuation patterns.
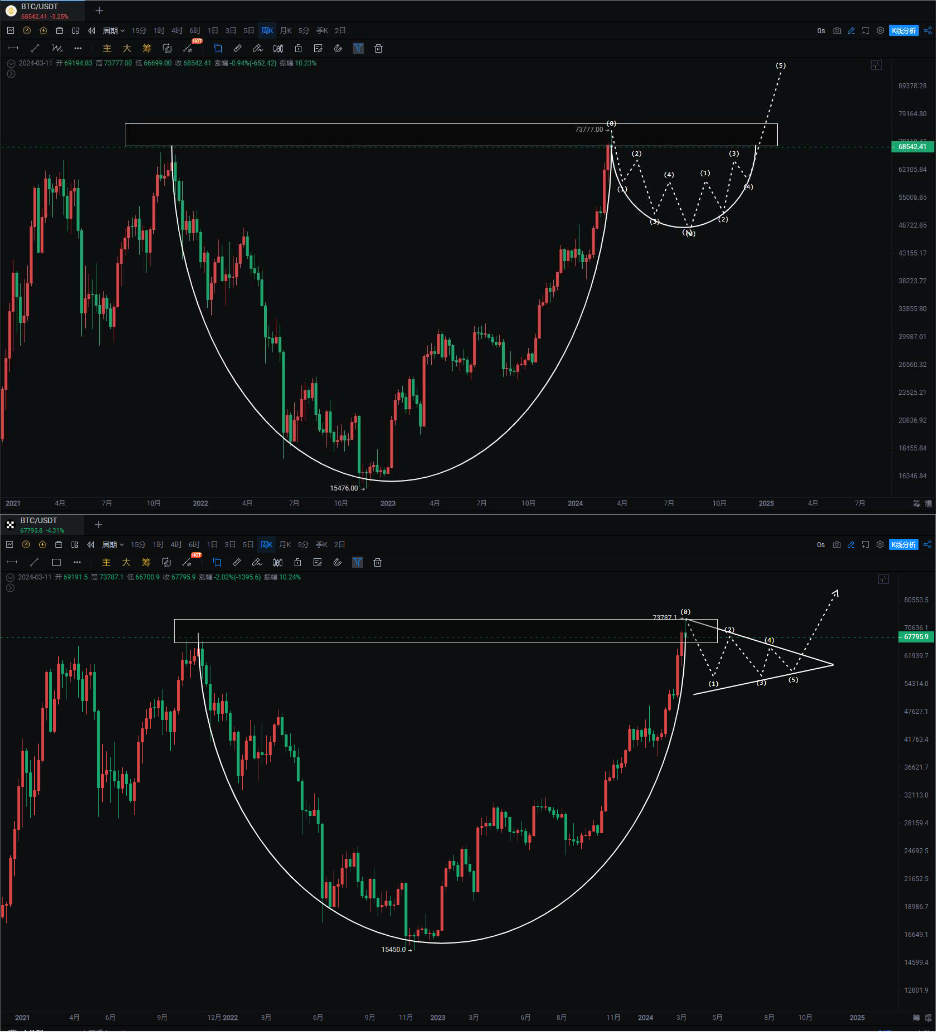
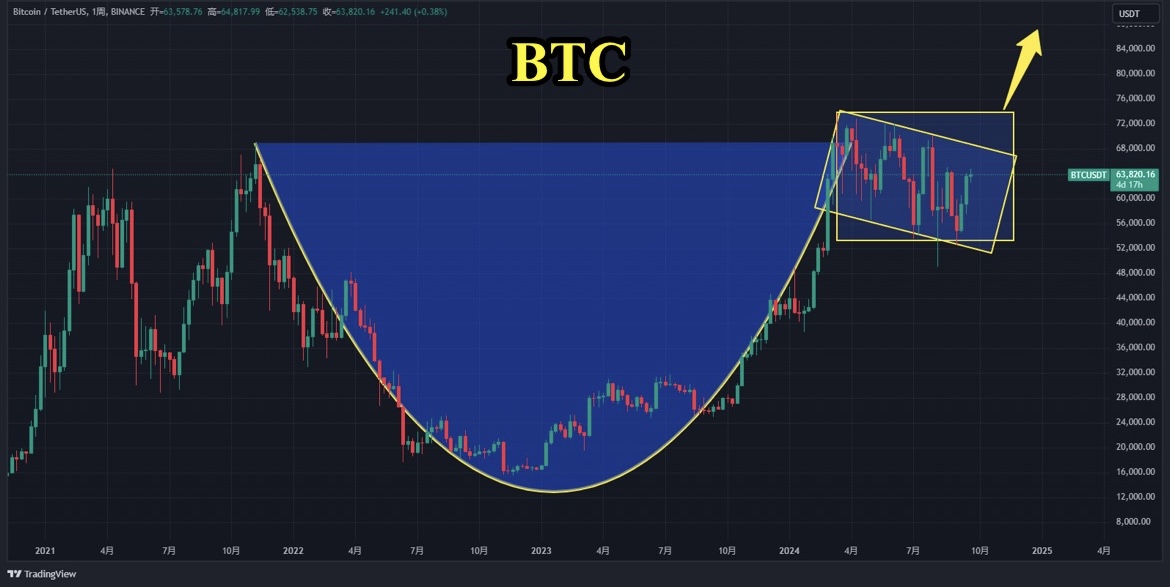
On 24/03/06, when a spike of 10,000 points occurred, I reminded that the higher we go, the greater the risks, warning of short-term pullback risks! Reduce positions for short-term trading. It is particularly worth mentioning that after hitting the high of 73,777 on March 14, I reminded the next day about the weekly cup and handle pattern, one of the bullish continuation patterns, and I was one of the earliest bloggers to predict the cup and handle pattern and remain bullish.
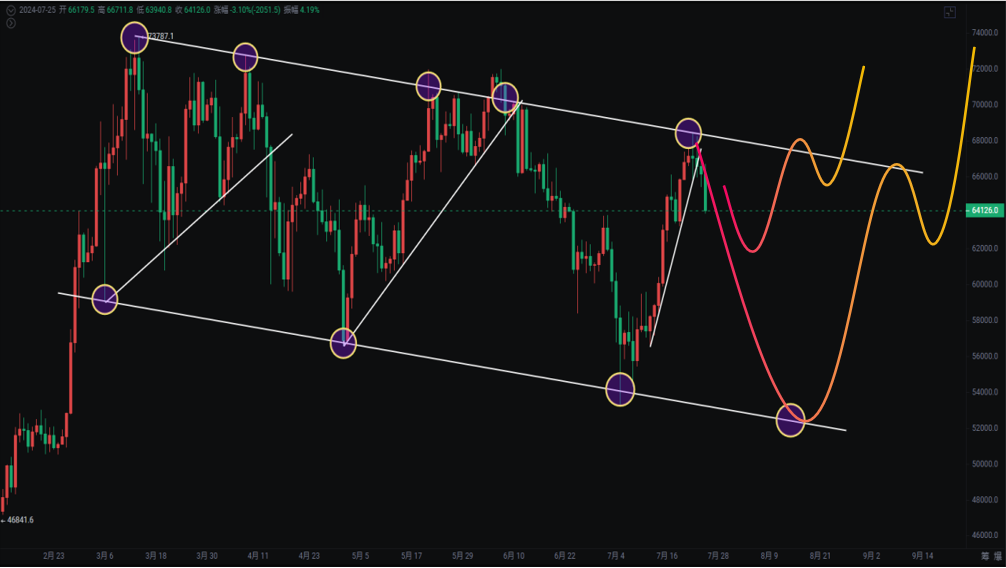
At that time, there were two viewpoints: 1. According to wave theory, a 20% pullback would be 59,000, and a 30% pullback would be 51,000.
- According to the cup and handle pattern, a major pullback would be 1/3 or 1/2, with pullback levels at 57,000 and 44,500.
During this period, we saw a low spike at 49,000, followed by a rebound and then a pullback to 52,500, after which it began to oscillate upward.
The time spent in high-level oscillation far exceeded our expectations; for more detailed information, please refer to "2024/07/10 Mid-Year Market Operation Summary and Outlook for the Second Half of the Year."

On August 5, after a spike at 49,000, it continued to drop to 52,500. At that time, I still held a bearish view, but after the subsequent rebound and a quick recovery from 55,555, I fully turned bullish, looking towards 59,500 to 70,000.
On 24/09/12, the U.S. stock market's "Big V Tianlong" correlated with BTC's channel + head and shoulders bottom breakout. How long can this rebound last?
On 24/10/11, BTC's downward momentum weakened, with expectations of a W-bottom near 60,000, providing opportunities for gradual positioning at lower levels.
On 24/10/12, BTC falsely broke down and rebounded by 4,500 points, with the daily downtrend line under pressure. Watch for rebound opportunities after the pullback.
On 24/10/15, Bitcoin was about to break through 66,500, with bearish deep-sea crabs pointing to 70,000. Don't easily discard cheap chips.
On 24/11/07, BTC aimed for 100,000 in the fourth quarter, while ETH rebounded to 2,800, and how to grasp the rebound of altcoins that are oversold?
On November 6, Trump won the election, and the weekly cup and handle pattern + rising flag breakout led to the recent market trend, replicating the 2023 market.
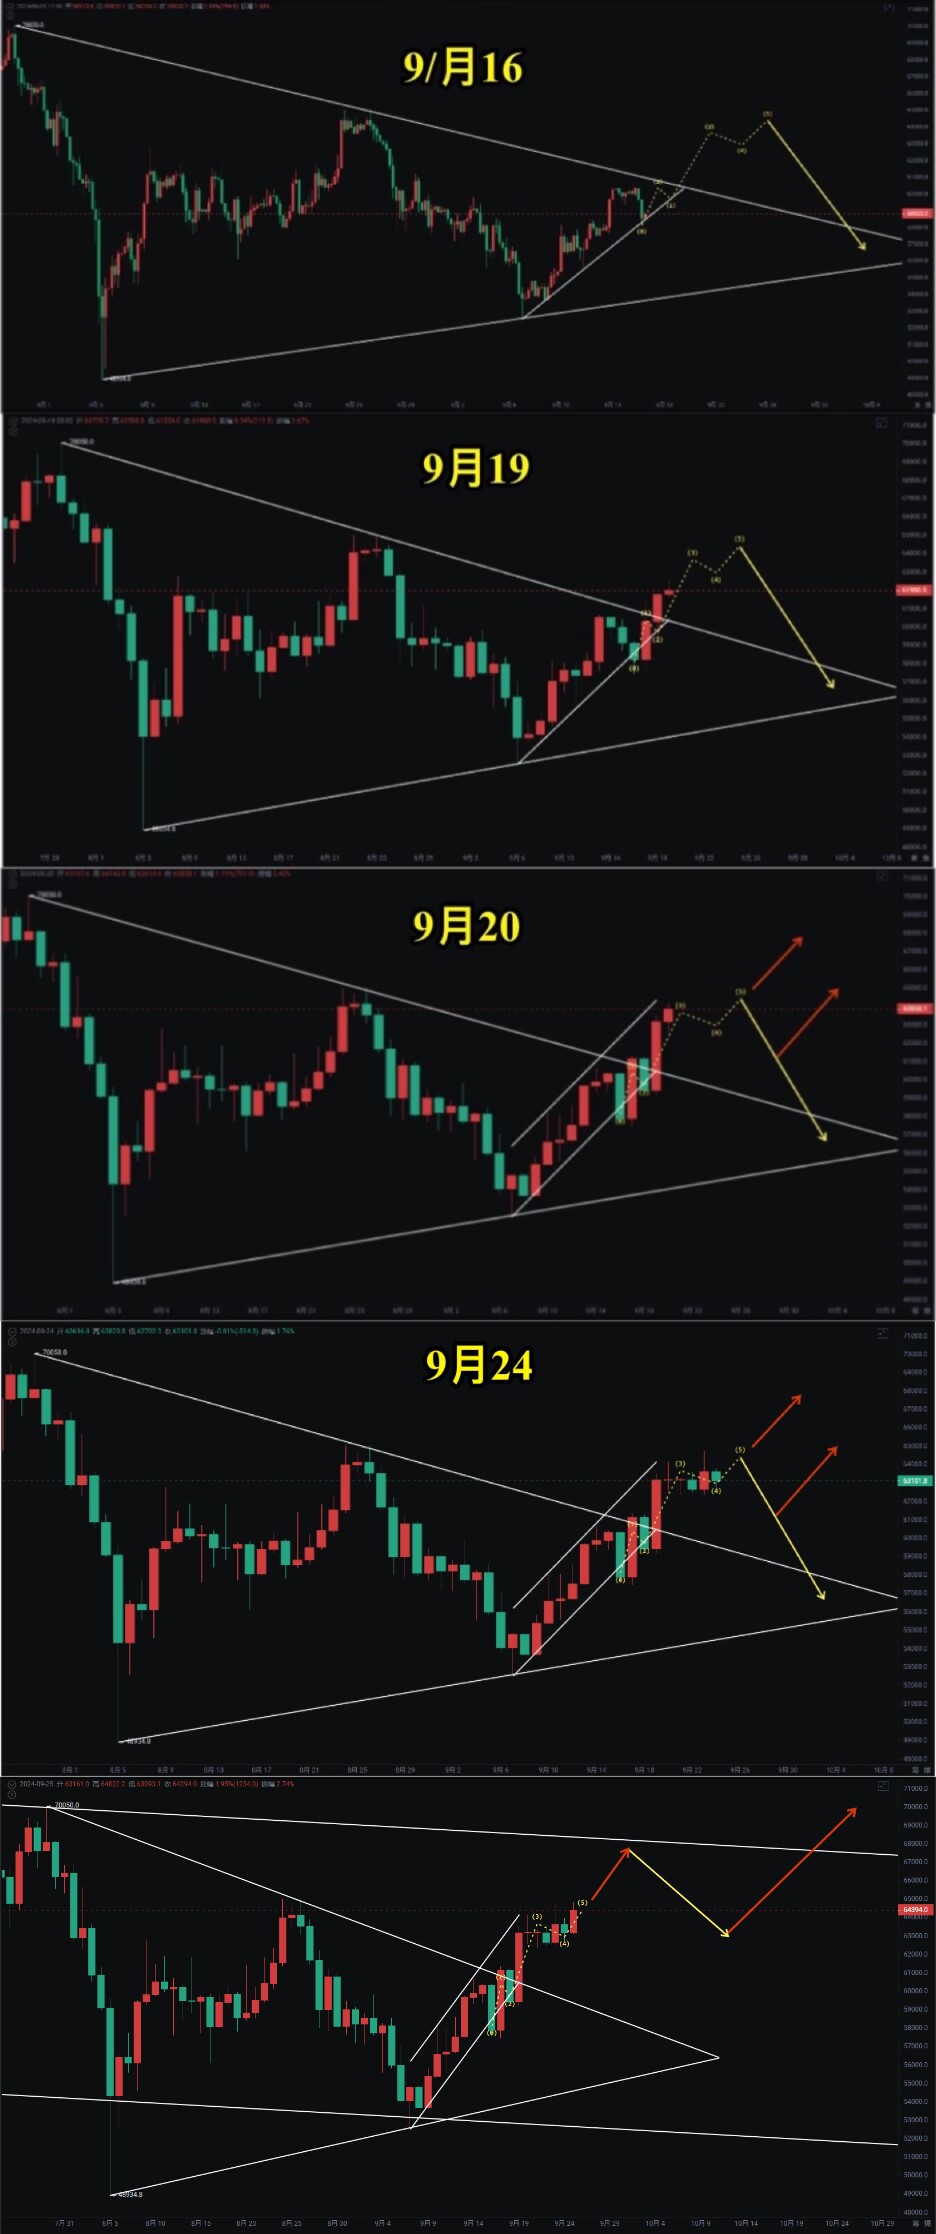
On 24/12/11, BTC's spike for the second time was temporarily effective, and it was about to challenge the previous high pressure again. How to grasp the Spring Festival red envelope market?
On 24/12/12, BTC perfectly predicted the doge's market, while ETH's rebound tested the rising trend. With interest rate cuts approaching, how to grasp the market?
On 24/12/18, BTC was nearing a critical moment, with support moving up to 103,000, and we need to pay attention to a potential downward adjustment.
On 24/12/19, the doge indeed replicated the 2023 playbook, and BTC's decline was just beginning. Prepare for the 2025 Spring Festival red envelope market!
On 24/12/20, BTC sharply adjusted by 12,000 points, and ETH broke below the M-head neckline. Is there a buying opportunity after the Christmas sacrifice?
After all this, it's still more direct to look at the charts.
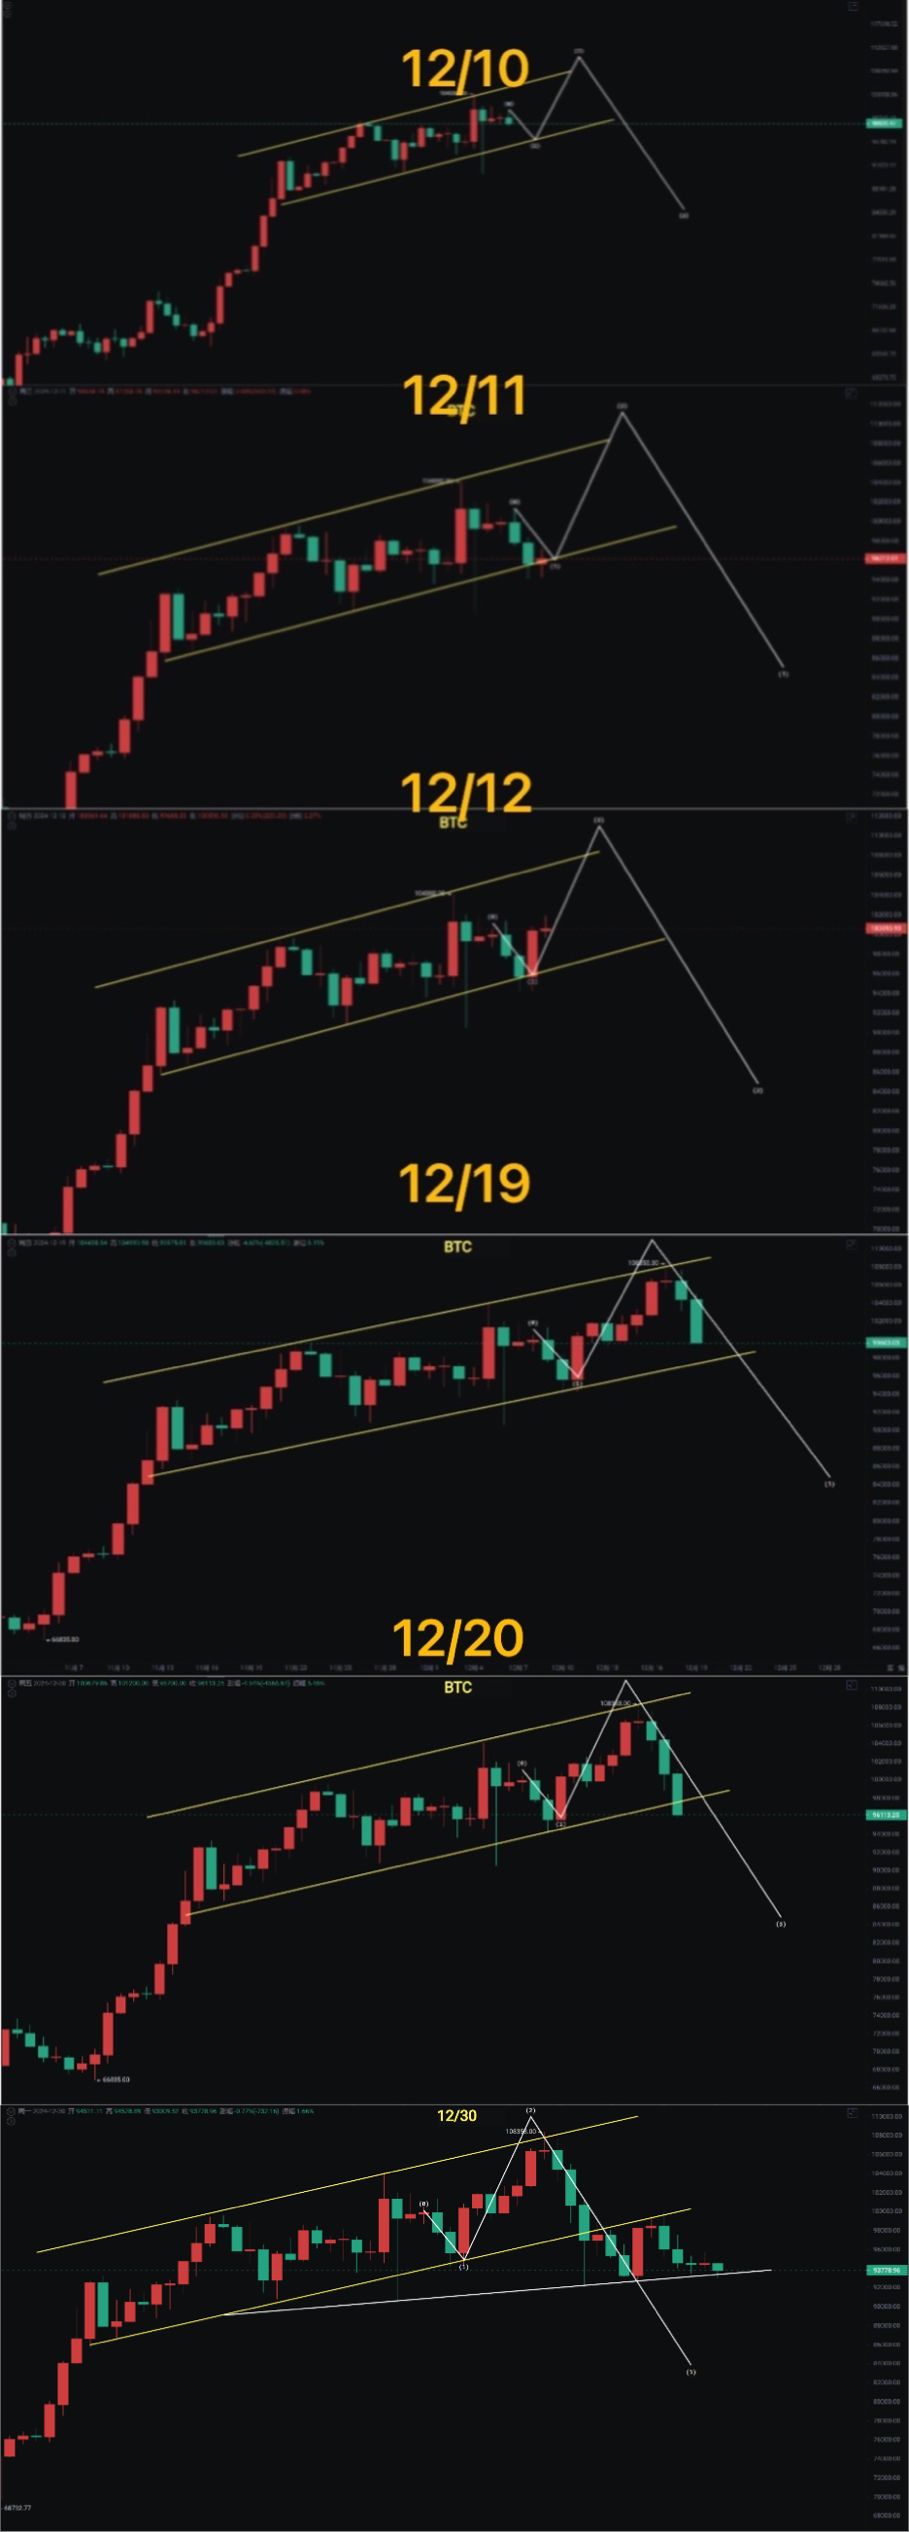
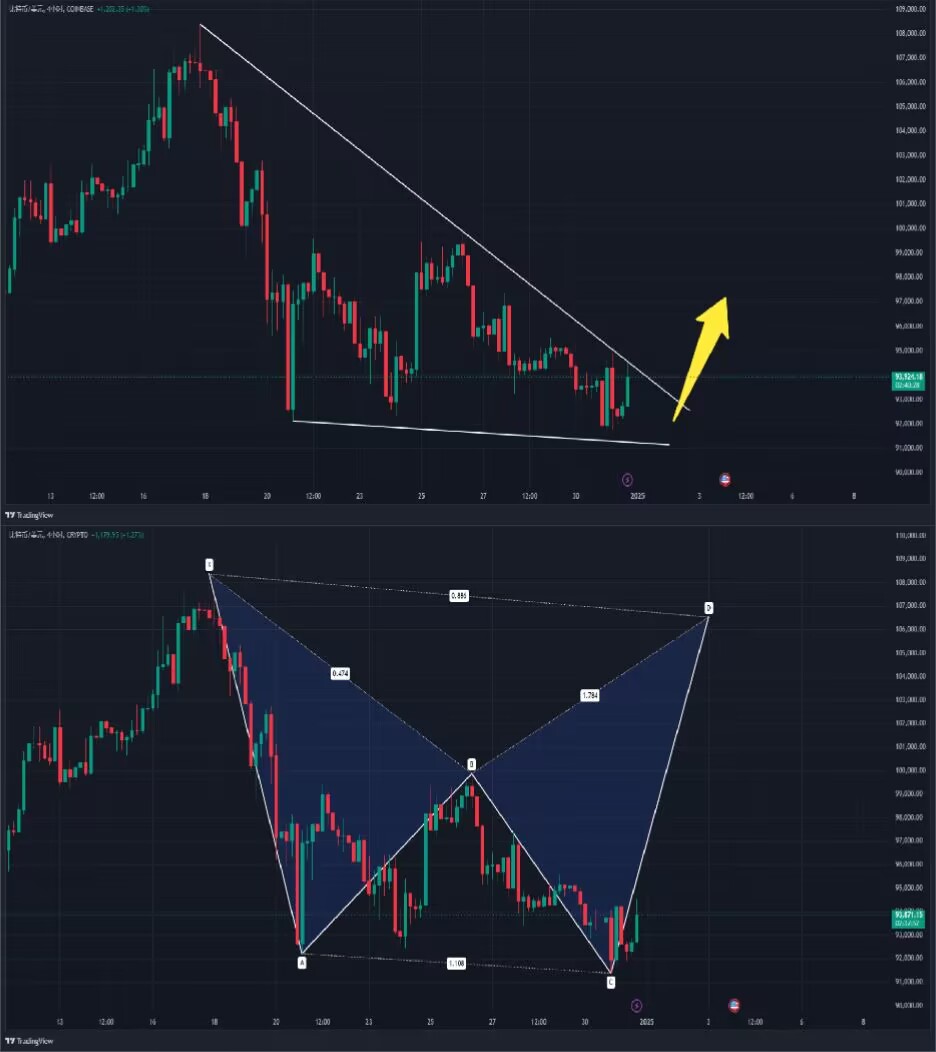
On 25/01/01, BTC formed a daily engulfing pattern, with a potential descending wedge and bat pattern on the 4-hour chart, indicating a short-term crazy washout to clear leverage.
On 25/01/02, BTC's pullback may have ended, and the Spring Festival red envelope market is about to begin. Is the altcoin season of 2025 worth looking forward to? More exciting content will continue to be delivered…
In 2025, time flies, and as we pursue our dreams, opportunities and challenges coexist. Here are my predictions for 2025!
BTC's bull market peak will be between 180,000 and 250,000, but there will be at least one pullback of 30-40% along the way!
ETH staking rewards will rise through ETF approval, pushing ETH prices up to 8,000-10,000!
Currently, five altcoins have ETF expectations, but at least one altcoin ETF will be approved!
MicroStrategy has already been included in the Nasdaq index, and the next is Coinbase to be included in the S&P 500 index!
The number of countries or regions that approve BTC spot ETFs will double in 2025!
The number of publicly traded companies directly or indirectly participating in Bitcoin purchases will multiply!
The use of stablecoins will surge, and banks may issue stablecoins, but Tether will still maintain its leading position!
The U.S. will pass stablecoin legislation, while broader market infrastructure reforms (FIT21) will be postponed!
AI + tokenization of real-world assets (RWA) will remain the main theme!
In 2025, Trump will not include Bitcoin in the strategic reserves!
If you like my views, please like, comment, and share. Let's navigate through the bull and bear markets together!!!
The article is time-sensitive and for reference only, with real-time updates.
Focusing on K-line technical research, sharing global investment opportunities. Public account: Trading Prince Fusu

免责声明:本文章仅代表作者个人观点,不代表本平台的立场和观点。本文章仅供信息分享,不构成对任何人的任何投资建议。用户与作者之间的任何争议,与本平台无关。如网页中刊载的文章或图片涉及侵权,请提供相关的权利证明和身份证明发送邮件到support@aicoin.com,本平台相关工作人员将会进行核查。


