Table of Contents:
Large Token Unlock Data for This Week;
Overview of the Crypto Market, Quick Read on Weekly Popular Coins' Price Fluctuations/Fund Flows;
Inflow and Outflow of Spot ETF Funds;
Interpretation of Contract Funding Rates;
1. Large Token Unlock Data for This Week;

Tokens such as APT, MOVE, and KAS will see significant unlocks this week, including:
Movement (Move) will unlock approximately 50 million tokens at 8 PM on January 9, accounting for 2.22% of the current circulating supply, valued at about $53 million;
io.net (IO) will unlock approximately 3.22 million tokens at 8 PM on January 11, accounting for 2.50% of the current circulating supply, valued at about $11.8 million;
Kaspa (KAS) will unlock approximately 182 million tokens at 8 AM on January 6, accounting for 0.72% of the current circulating supply, valued at about $22.7 million;
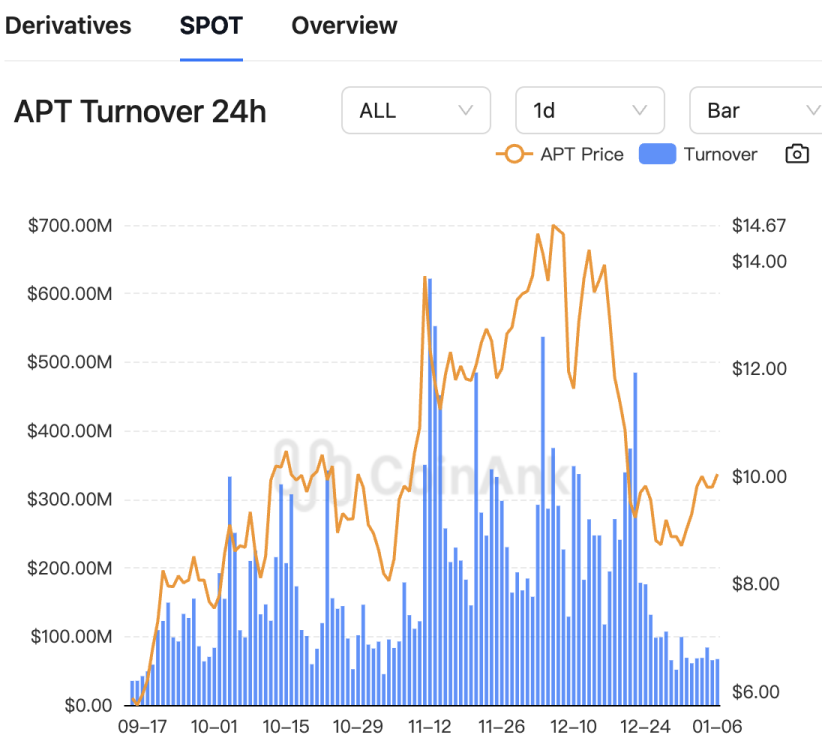
Aptos (APT) will unlock approximately 11.31 million tokens at 9:59 AM on January 11, accounting for 2.03% of the current circulating supply, valued at about $110 million;
Ethena (ENA) will unlock approximately 12.86 million tokens at 3 PM on January 8, accounting for 0.42% of the current circulating supply, valued at about $16.2 million.
The above times are in UTC+8. This week, pay attention to the negative effects brought by the unlocking of these tokens, avoid spot trading, and seek shorting opportunities in contracts. Among them, IO and APT have a larger proportion and scale of unlocked circulating supply, so pay extra attention.

2. Overview of the Crypto Market, Quick Read on Weekly Popular Coins' Price Fluctuations/Fund Flows
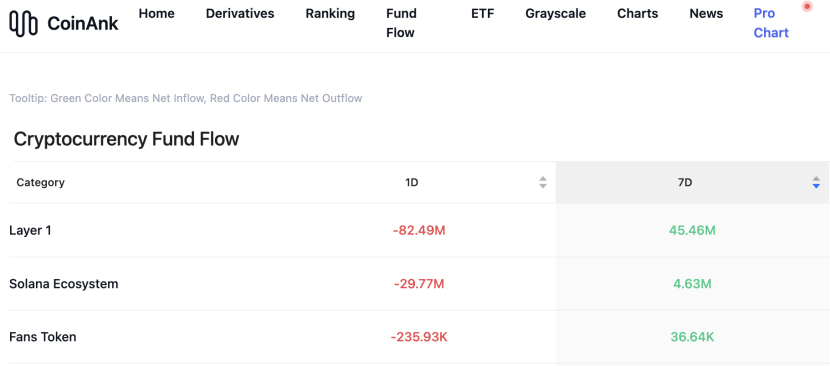
In the past week, the crypto market saw significant net inflows concentrated in several major sectors such as Layer 1, the Solana ecosystem, and Fans tokens, while the Launchpool and RWA sectors experienced smaller outflows. According to CoinAnk data, many tokens also saw significant rotational increases over the past week. The top 200 by market capitalization include SPX, AIOZ, IO, MOG, XDC, and PENGU, which had relatively high increases. SUI also reached a new high.

3. Inflow and Outflow of Spot ETF Funds.
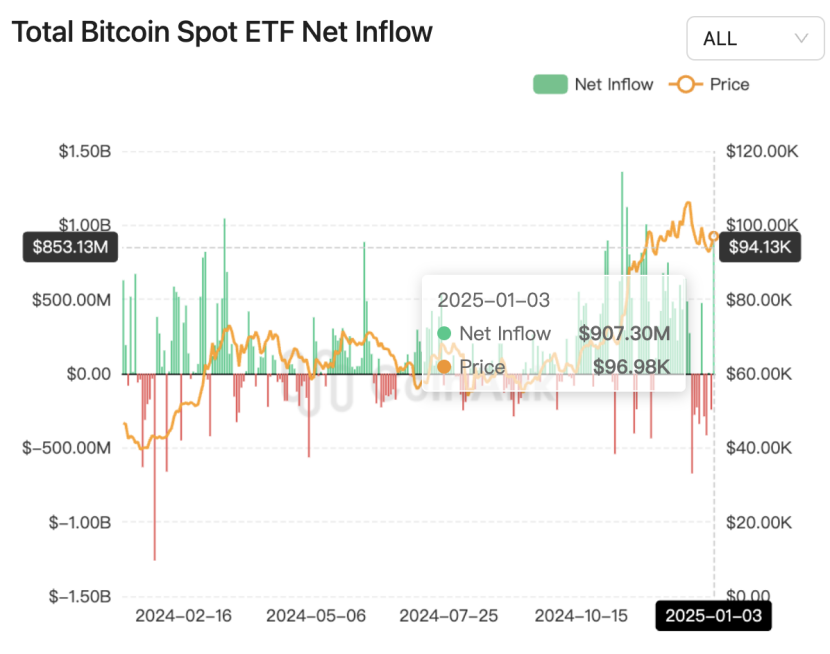
Data shows that last week, the BTC spot ETF overall experienced a slight net inflow, despite a market closure on Wednesday and significant net outflows on Thursday. The inflows on the other days compensated for this gap, with a total net inflow of $255.3 million for the week, adding 2,421.94 BTC. Notably, on Thursday, BlackRock's IBIT set a new record for the largest single-day reduction of 3,516.57 BTC, while on Friday, market sentiment improved, with an inflow of 2,601.9 BTC, and Fidelity increased its holdings by 3,684.64 BTC. Last Friday, the U.S. spot Bitcoin ETF purchased BTC worth $908 million in a single day. Currently, the BTC price has rebounded, maintaining a wide fluctuation around $99,000. The total net asset value of the Bitcoin spot ETF is $111.457 billion, with an ETF net asset ratio (market cap compared to total Bitcoin market cap) of 5.72%, and the historical cumulative net inflow has reached $35.909 billion.
The U.S. Ethereum spot ETF saw a net outflow of $38.1 million last week. The total net asset value of the Ethereum spot ETF is $13.034 billion, with an ETF net asset ratio (market cap compared to total Ethereum market cap) of 3%, and the historical cumulative net inflow has reached $2.639 billion.
We believe that last week, the U.S. spot Bitcoin ETF overall showed a slight net inflow, despite the market closure on Wednesday and significant net outflows on Thursday. The strong inflows on the remaining days compensated for the gap. Particularly, Fidelity's increase in holdings last Friday, with several ETFs buying up to $908 million worth of BTC in a single day, may reflect institutional investors' positive attitude towards Bitcoin and the recovery of market sentiment. The total net asset value and historical cumulative net inflow data of the Bitcoin spot ETF are impressive, further proving Bitcoin's attractiveness and market depth as an asset class.
Meanwhile, the U.S. Ethereum spot ETF experienced a net outflow of $38.1 million last week, with a historical cumulative net inflow of $2.639 billion. This net outflow phenomenon may be related to market expectations and trading dynamics for Ethereum in the short term, but overall, the market performance of the Ethereum ETF still shows certain growth potential, although it remains less favored by the market compared to BTC.

4. Interpretation of Contract Funding Rates Heatmap.
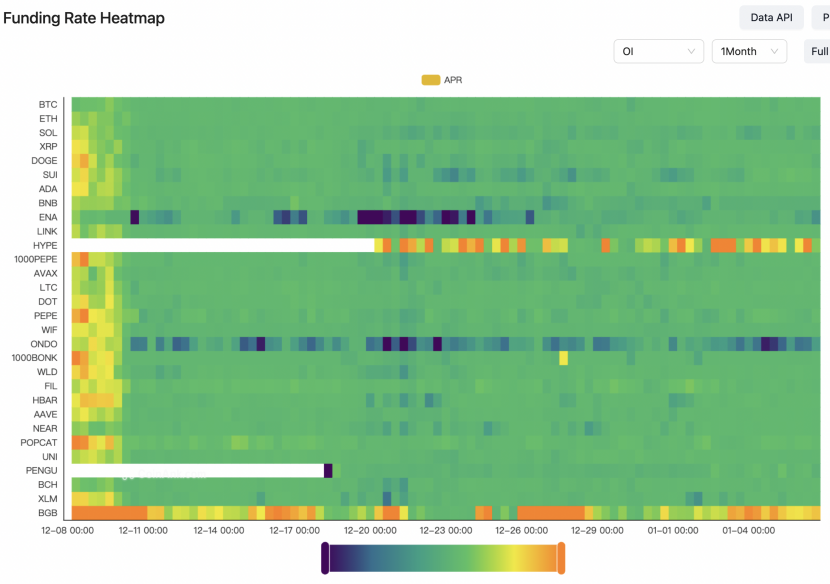
According to the funding rate heatmap: Utilize funding rates to obtain low-risk arbitrage opportunities for high annualized returns.
(1) Funding Rate Heatmap: The funding rate heatmap displays the funding rates of different cryptocurrencies (such as BTC, ETH, SOL, XRP, etc.) over a certain period (here it is 1 month, with options to switch to 1 day, 1 week, 2 weeks, 1 month, 3 months, 6 months, etc.). The funding rate is an important concept in futures trading, used to balance the interests between long and short positions.
Annualized Rate: The annualized rate converts the funding rate into an annual interest rate. It reflects the proportion of fees that longs or shorts need to pay over a year. For example, the rate settled every 8 hours multiplied by 3 gives the daily rate, and then multiplied by 365 days gives the annualized rate.
Color Meaning: The colors in the chart range from deep blue to yellow, where blue represents negative funding rates, with deeper blue indicating a larger negative value; green represents positive funding rates, with deeper yellow to orange indicating a larger positive funding rate.
A positive funding rate means that longs (buyers) need to pay a certain fee to shorts (sellers), usually occurring when market sentiment is bullish. A negative funding rate means that shorts need to pay a certain fee to longs, usually occurring when market sentiment is bearish.
(2) Data Interpretation:
Funding Rate Trend: From the chart, it can be seen that the funding rates of different cryptocurrencies have significant variations over different time periods. For example, during certain periods, BTC's funding rate is relatively high and positive, indicating strong bullish sentiment towards BTC. In other periods, some cryptocurrencies have negative funding rates, indicating strong bearish sentiment towards those cryptocurrencies.
Comparison of Different Cryptocurrencies: The chart shows the funding rates of various cryptocurrencies. For instance, the funding rates of ETH and XRP differ from BTC during certain periods, reflecting the differences in supply and demand relationships and investor sentiment among different cryptocurrencies.
(3) Funding Rate Arbitrage Strategies
In futures contract trading, the differences in funding rates can be used for arbitrage. Here are some common arbitrage strategies:
Positive Arbitrage Principle: When a trading platform's funding rate is positive and relatively high, one can sell futures contracts (open a short position) on that platform while simultaneously buying an equivalent amount of cryptocurrency in the spot market.
In this way, the short position will receive the funding rate paid by the long position, while the long position in the spot market can enjoy potential price appreciation. Even if the market declines, the short position can offset losses; if the market rises, the spot can cover the short position losses, and the extra gain will be the funding fee.
Negative Arbitrage Principle: When a trading platform's funding rate is negative and relatively low, one can buy futures contracts (open a long position) on that platform while simultaneously selling an equivalent amount of cryptocurrency in the spot market, if possible, or hedge through other means, such as shorting contracts of other cryptocurrencies with a positive funding rate.
In this way, the long position will receive the funding rate paid by the short position, and the hedging operation can reduce the risk of holding the position.
It is important to note that arbitrage operations carry certain risks, including market price fluctuations, exchange risks, and transaction costs. Before engaging in arbitrage operations, it is necessary to fully assess the risks and returns and develop a reasonable trading strategy. Specific content can be found in the daily news section or the education section.
免责声明:本文章仅代表作者个人观点,不代表本平台的立场和观点。本文章仅供信息分享,不构成对任何人的任何投资建议。用户与作者之间的任何争议,与本平台无关。如网页中刊载的文章或图片涉及侵权,请提供相关的权利证明和身份证明发送邮件到support@aicoin.com,本平台相关工作人员将会进行核查。


