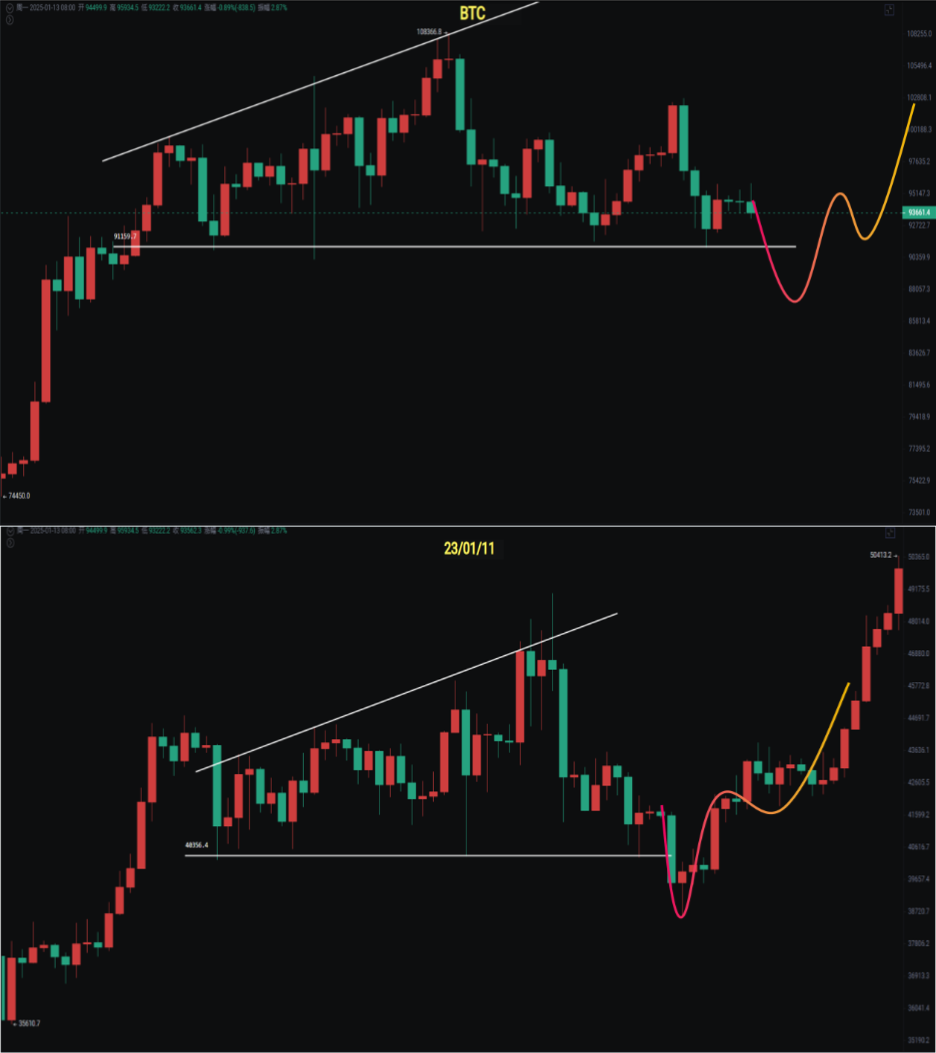
The weekly closing of Bitcoin shows a doji star. Although it doesn't count as a standard engulfing pattern, the opening was still around the 94,500 level, with a continuous narrow range fluctuation over the weekend. The daily chart may show a doji star for the third consecutive day. Although there is support at the bottom, the rebound is still too weak, and it has not been able to break through the 0.382 retracement of this decline, which will test the support in this area again, and there may be a false breakdown before returning?
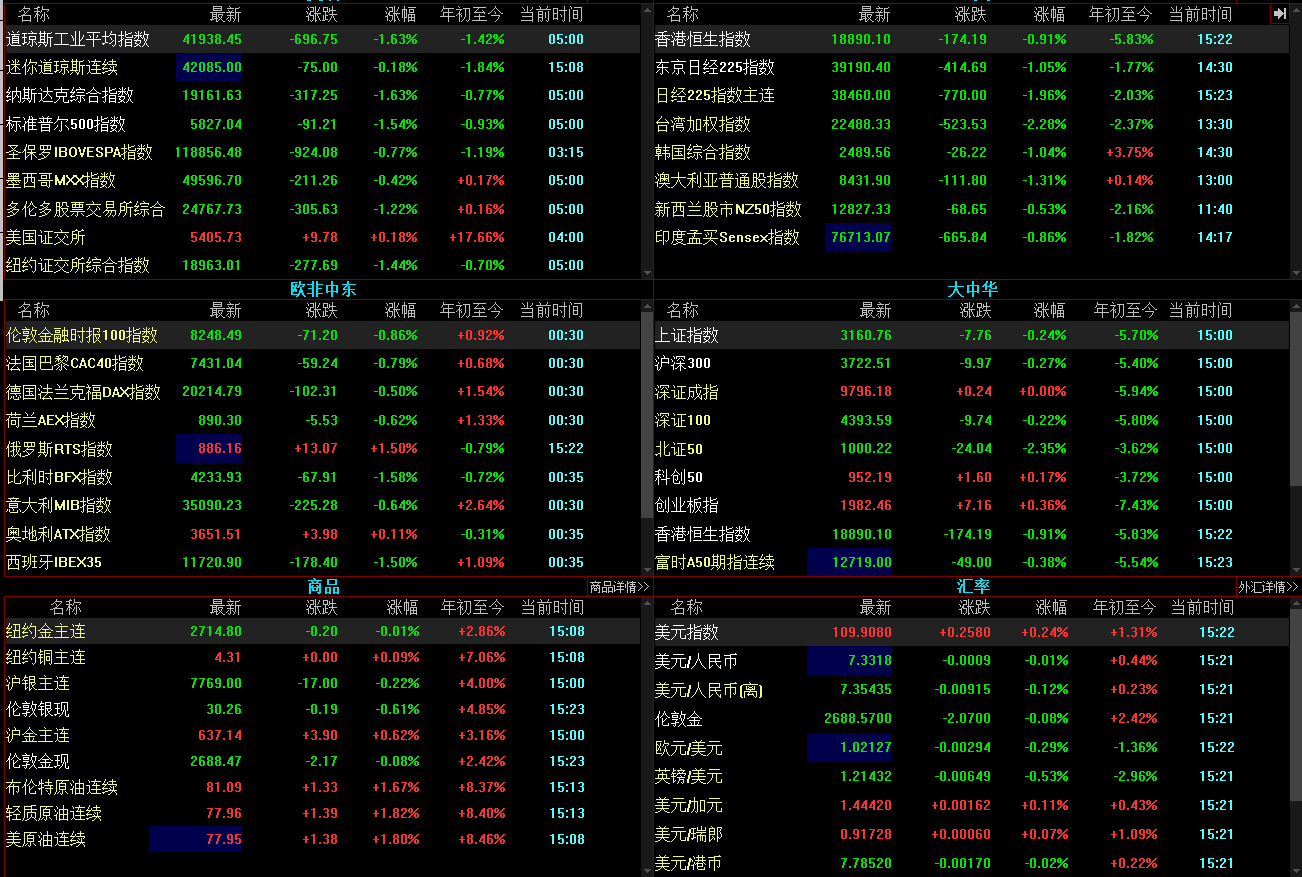
In the Asian session, the Shanghai Composite, Shenzhen Component, Hong Kong Hang Seng, Nikkei, Korea Composite, and Mumbai Sensex, while last Friday, the three major U.S. stock indices, as well as European, African, and Middle Eastern markets, mostly fell, which inevitably leads many to speculate whether a black swan event will occur.

Trump is less than a week away from taking office, and if a black swan event occurs at this time, it might create history again… So let's wait patiently. Anything that everyone thinks will happen cannot be called a black swan. The young master has always held a contrarian view and does not rule out that something might happen in 2025, but it won't happen as soon as Trump takes office; otherwise, those people on Wall Street wouldn't have to work.
Bitcoin
The short-term rebound of Bitcoin is too weak and has been in short-term fluctuations. After a quick drop following an upward rebound to 95,940 in the morning, it was also affected by the general decline in the Asian session. The opening of the U.S. stock market in the evening also needs attention, as it may be dragged down, and there is a possibility of a false breakdown. There is not much problem with Bitcoin itself, and the support at the bottom around 91,000 is quite obvious, but it is affected by external financial markets.
The 4-hour chart has been fluctuating in the range of 93,600—96,000 for 2 days, and today we need to see if it can close above 93,600.
Support: 88,000—91,200—92,200
Resistance: 96,000—97,600—98,600

Ethereum
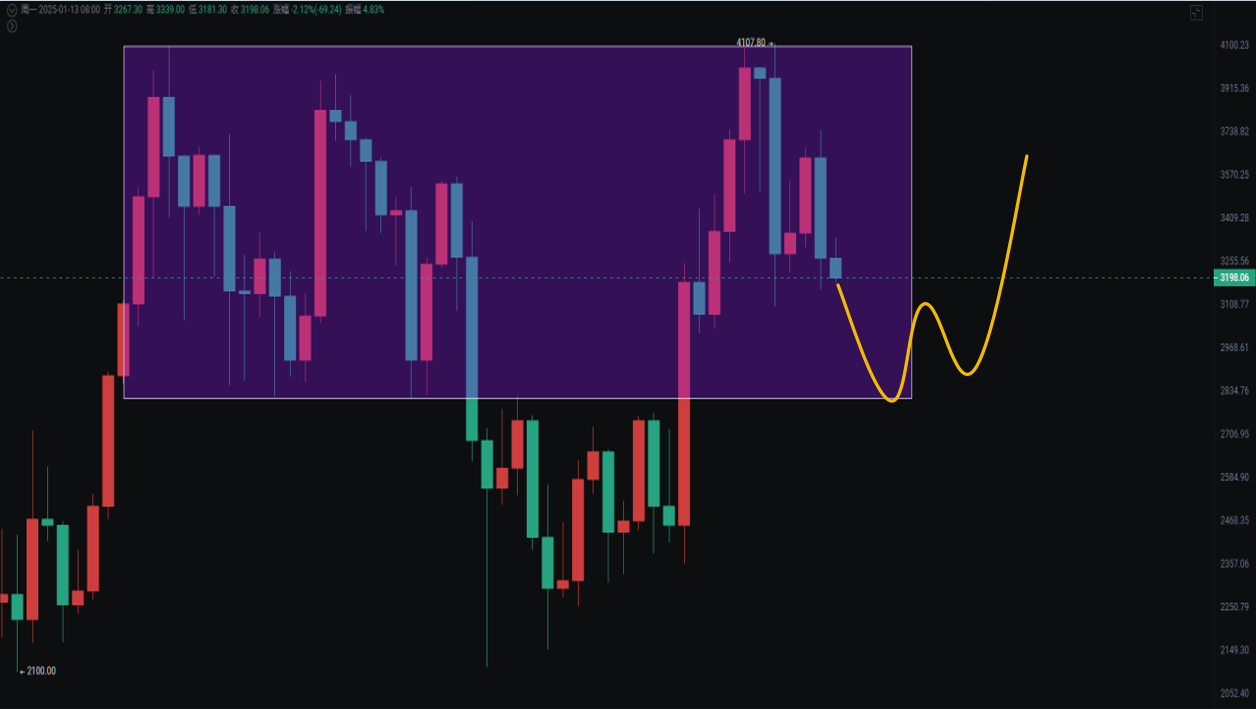
Last week, it was mentioned that the probability of Ethereum forming an engulfing pattern is relatively high, so it will continue to decline. It is possible to break below the spike at 3,100 and drop to the 3,000—2,800 range. As of the time of writing, it is at 3,181, so the probability of breaking below is still quite high.
The daily rebound is even weaker than Bitcoin, unable to recover even 3,300, so let's wait patiently.
Support: 2,800—2,900—3,000
Resistance: 3,444—3,555—3,745

If you like my views, please like, comment, and share. Let's navigate through the bull and bear markets together!!!
This article is time-sensitive and for reference only, updated in real-time.
Focusing on K-line technical research, sharing global investment opportunities. Public account: Trading Young Master Fusu

免责声明:本文章仅代表作者个人观点,不代表本平台的立场和观点。本文章仅供信息分享,不构成对任何人的任何投资建议。用户与作者之间的任何争议,与本平台无关。如网页中刊载的文章或图片涉及侵权,请提供相关的权利证明和身份证明发送邮件到support@aicoin.com,本平台相关工作人员将会进行核查。


