Conveying the Way of Trading, Enjoying a Wise Life.

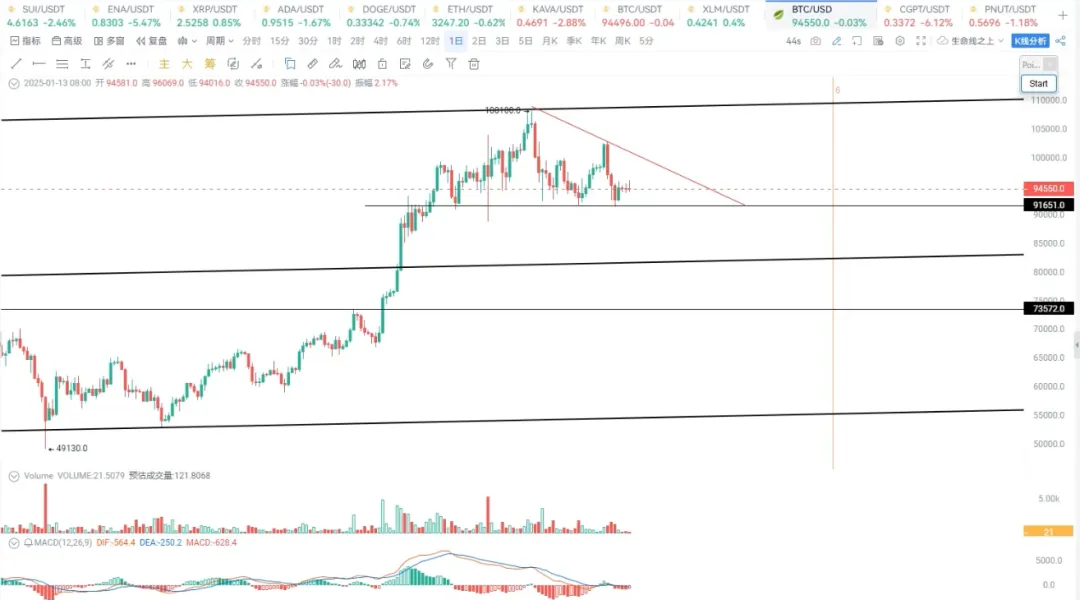
**The weekly closing of Bitcoin is not good. Last week, a controversial candlestick pattern was formed, indicating that there is selling pressure above and buying support below. At $92,000, since the upward breakout in November, it has been consolidating for two months, with December in consolidation and January still in consolidation. **How long will Bitcoin consolidate?

I don't know. It has been consolidating at $92,500 for 8 weeks, so if it breaks $92,500, then the price of Bitcoin will drop to $87,000 or $78,000. Is there a possibility for the weekly chart to move upward? If it goes up, it could reach $99,000 or $100,000, unless it breaks the second high point, which is at $102,400**, only then can we say that this market has a definitive reversal; **otherwise, it will still go down.
This adjustment may evolve into a weekly chart level adjustment. The real time for a rally here is about a month, the entire month of November, followed by consolidation, just like last time, which consolidated for 8 or even 9 months. So, is it possible for this consolidation to last for eight months or five months?
I do not rule out this possibility, and the probability of this happening is very high. Some people say that Bitcoin is still in a bull market; why does this situation occur? In a bull market, do you know that the trend of this wave is different from the previous bull market trend? Therefore, I recall a saying by Jack Ma: "Today is hard, tomorrow will be harder, but the day after tomorrow will be beautiful. However, most people die on tomorrow night and cannot see the sun of the day after tomorrow."
So, preserve your strength, be a bit cautious in your spot trading strategies and responses, and do not go all in, because the principal can become smaller the more you trade. When the entire market consolidates to the point where you are exhausted and cannot see hope, your principal continues to wear down to a very low position, and your mood or mindset also reaches a limit of wear and tear. At this time, when the real opportunity comes, you may not be able to seize it because you have expended a lot of energy and time beforehand, leading to a lack of mood and confidence, mainly starting to doubt the market and even yourself.
As for what we can do? Control your position, wait patiently. Wait for what? Wait for Bitcoin to experience a sharp drop, where will it drop? It will drop to $87,000, or $78,000. If it does not go to $87,000 or $78,000 and reverses midway, then either you break through the second high point of Bitcoin's rebound, or if it stops falling at $92,500, then the landmark event is that it must break through $102,000; otherwise, it cannot be considered a breakthrough.
**If it stops falling at $87,000, then it must rise above $92,500 again. If it stops falling at $78,000, then it must show a bullish candlestick pattern. So, a sharp drop will present buying opportunities, and a sharp rise breakthrough will also present buying opportunities. **Which one would you prefer? I believe the former should be the most ideal state.
Some people ask if this bull market is over. I do not think so. Just like from March last year to October, it consolidated for 8 months. Do you think the bull market ended? No. Therefore, Bitcoin experiencing a sharp drop is an opportunity, and an upward breakout is also an opportunity. Right now is not the time for opportunities; it is just wearing down your patience and your funds, especially for those trading spot; we need to be particularly cautious.
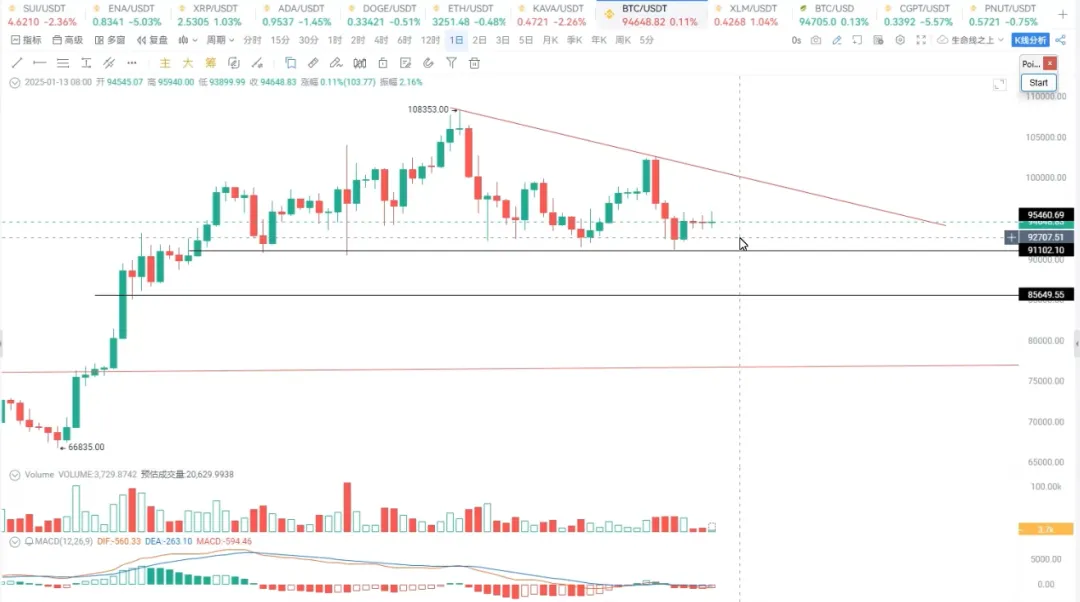
Returning to the daily chart, Bitcoin has been oscillating at $92,500 for 8 weeks, for two months, unable to break through. But what is good? At this position, Bitcoin has had four consecutive days of increased volume, which is a sign of a rising sun. Then the next three days are doji candles, which have no volume. This indicates that trading sentiment is very low, not high; mainly retail investors are trading, and the main force has not entered the market, or the main force has not exerted strength at this position. If the main force were to exert strength, it would definitely not be this situation. Therefore, the direction of the main force is uncertain; it could first drop and then rise, or it could first rise and then drop. However, we hope it drops first and then rises; otherwise, if it cannot drop, how can it rise higher?

**So at this position, our defense is at $92,000. If $92,000 is effectively broken, watch for $89,000, $87,000, or even lower positions. Of course, it is also possible to drop directly from $90,000 to below $87,000, continuing to fall for several weeks; this is also a relatively good situation. So below $100,000 is quite boring, so **when it is boring, just wait; the exciting market is only for a short period, wait for it to emerge.
**To summarize, **the upper rebound resistance level for Bitcoin is $95,000 and higher at $99,000, while downward it is $92,000, then $87,000, and lower at $78,000.
**On the hourly chart, Bitcoin's price is at this level. Today it seems to have surged a bit, reaching $95,000 - $96,000, where it faced resistance. This is a horizontal resistance level, so the upward movement is here, and its intraday support is here, which we can set at $93,800. Therefore, the intraday range is $93,800 - $95,800. You can see if it wants to break through; **if it goes down to $90,000, returning to $91,000 or $92,000, and if it goes up, it could reach $97,000. So let's see how it chooses, but we must not forget that the pressure from the larger cycle is very obvious.

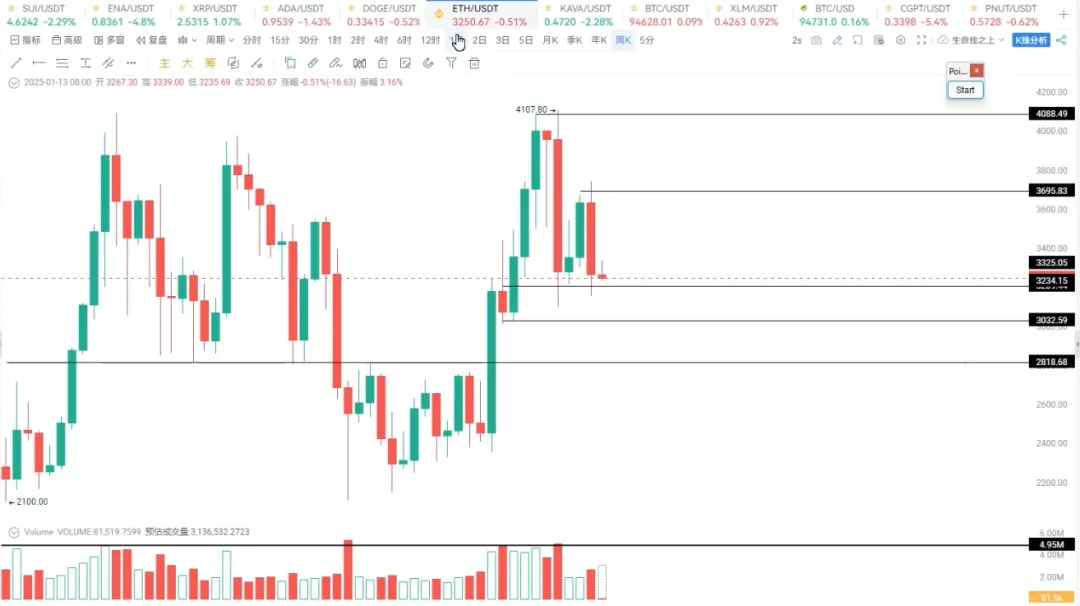
Returning to Ethereum, the weekly chart is also not good. This is clearly an engulfing pattern, and this position is $3,200, which has been tested repeatedly for seven or eight weeks without breaking. If it breaks down, it will be $3,000, and if it breaks further down, it will be $2,800. So if Bitcoin breaks down deeply, Ethereum will definitely not escape $2,800, and this will also be a good buying opportunity.
**So, a sharp drop will definitely be a good buying opportunity, ****but a sharp rise breakthrough can also happen. However, often when there is a breakthrough, you can see this position, $3,600 - $3,700; **do you think it is easy to break upwards? It is very difficult to break, so do not hold too many fantasies, and pay attention to position control. If it goes down to $3,500, then further down to $2,800, this is the trend of Ethereum.

**If it breaks through $3,325, of course, that would be better. After the breakthrough, we look at $3,500. From the current candlestick trend, you can see that the spike is very long. In the morning, it broke through $3,300 - $3,000 and went up high, then came back down. So looking at the intraday, **it is oscillating within a range, with support at $3,200 and resistance at $3,325, fluctuating within 100 points. The short-term trading opportunity is to sell high and buy low; breaking in either direction can be followed.
For more information, you can contact our assistant and join the VIP group.
免责声明:本文章仅代表作者个人观点,不代表本平台的立场和观点。本文章仅供信息分享,不构成对任何人的任何投资建议。用户与作者之间的任何争议,与本平台无关。如网页中刊载的文章或图片涉及侵权,请提供相关的权利证明和身份证明发送邮件到support@aicoin.com,本平台相关工作人员将会进行核查。


