K-Line Pattern Analysis
Recent Trend
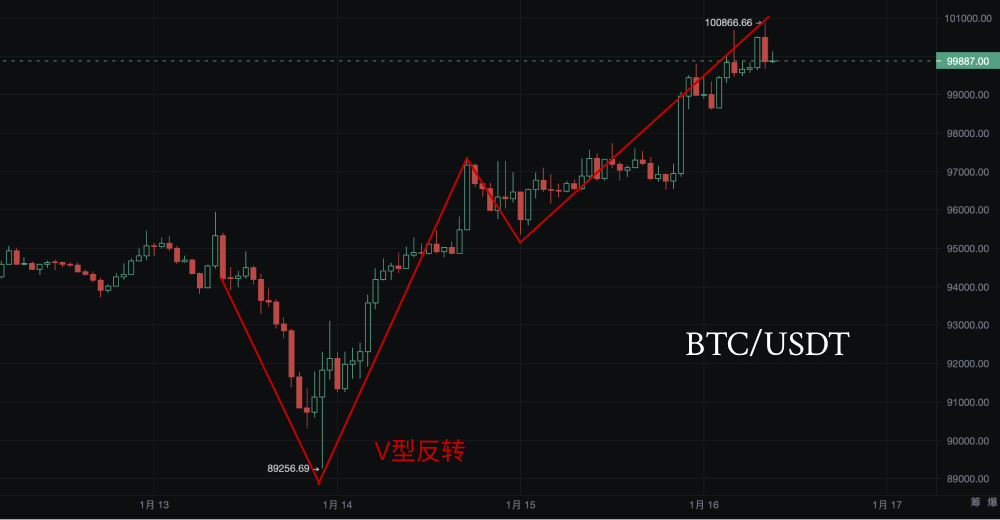
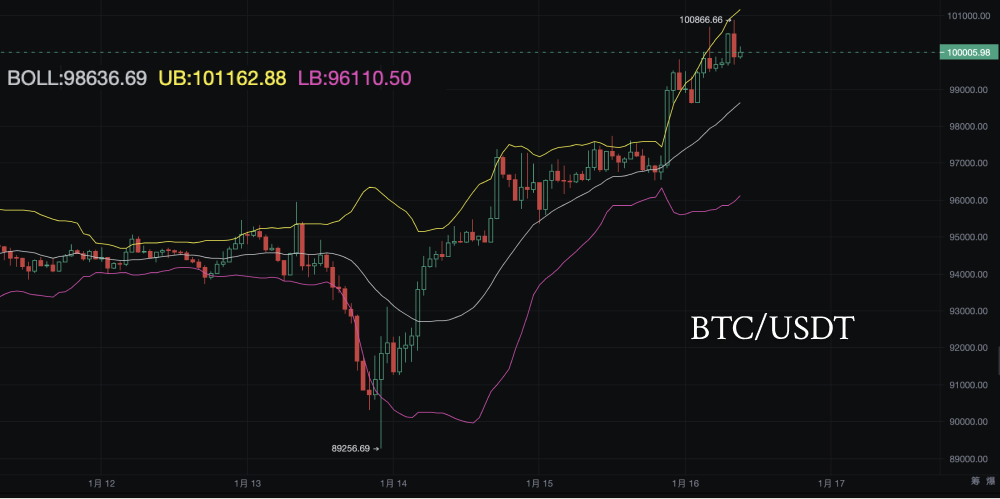
The K-line chart shows that the price of Bitcoin has experienced a V-shaped rebound. The bottom position reached around 89256.69 on January 14, followed by a strong rebound, currently facing some resistance above the 100000 mark.
Recently, several K-lines have shown a continuous bullish state, indicating strong bullish power, but after reaching a high of 100866.66, there has been a slight pullback, suggesting significant selling pressure above.
Important Patterns
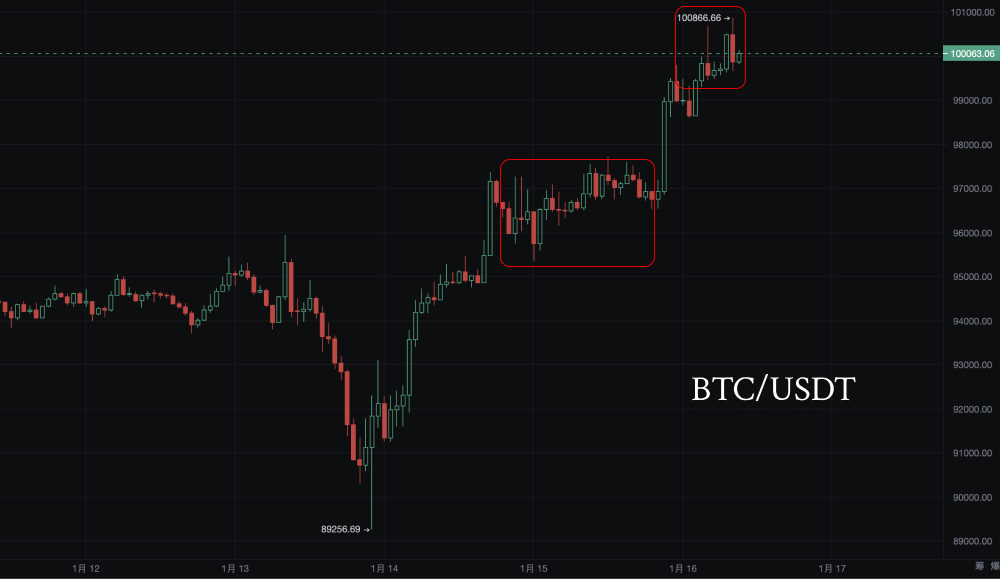
Breakout followed by a retest to confirm support: The price has broken through the previous resistance level of 97000, indicating strong support at this level. The current trend shows stabilization around 98000, forming a consolidation state, which may be a buildup for further upward movement.
The long upper shadow of the K-line indicates that selling pressure is gradually increasing above, suggesting a possible consolidation or slight pullback in the short term.
Technical Indicator Analysis
Bollinger Bands Analysis:
1. Bollinger Bands Indicator Interpretation
- Upper Band (UB): The upper limit of the Bollinger Bands, usually representing a resistance level for the price. The current upper band value is 101162.88.
- Middle Band (BOLL): The 20-day moving average, indicating the average price level, currently at 98636.69.
- Lower Band (LB): The lower limit of the Bollinger Bands, usually representing a support level for the price. The current lower band value is 96110.50.
2. Current K-line and Bollinger Bands Relationship
- Breakout above the upper band: Recently, the price has strongly risen, currently at 100005.98, above the middle band and has tested the upper band multiple times. After reaching a high of 100866.66 on January 15, there was a slight pullback, indicating that the market is generally in a strong upward state. The price is operating in the upper half of the Bollinger Bands, with strong short-term upward momentum.
- Resistance at the upper band: 101162.88 has become a short-term resistance. If the price breaks through this resistance, it may further open up upward space.
- Pullback support levels: The middle band at 98636.69 and the lower band at 96110.50 are key supports. After a pullback, the price is expected to continue upward with the help of support.
- Bollinger Bands opening: Increased volatility
The distance between the upper and lower Bollinger Bands is gradually widening, indicating an increase in market volatility. This aligns with the recent surge in Bitcoin prices following the release of CPI data. Increased volatility typically means that prices may fluctuate sharply in the short term.
3. Bullish and Bearish Power Analysis
- Clear bullish advantage: The price is running along the upper band of the Bollinger Bands, and there has been no significant retreat to the middle band, indicating strong bullish power.
- Pullback risk exists: Although the upper band has been tested multiple times, the price has not effectively broken through, and there may be some pullback pressure in the short term. The middle band will be a key defense for the bulls.
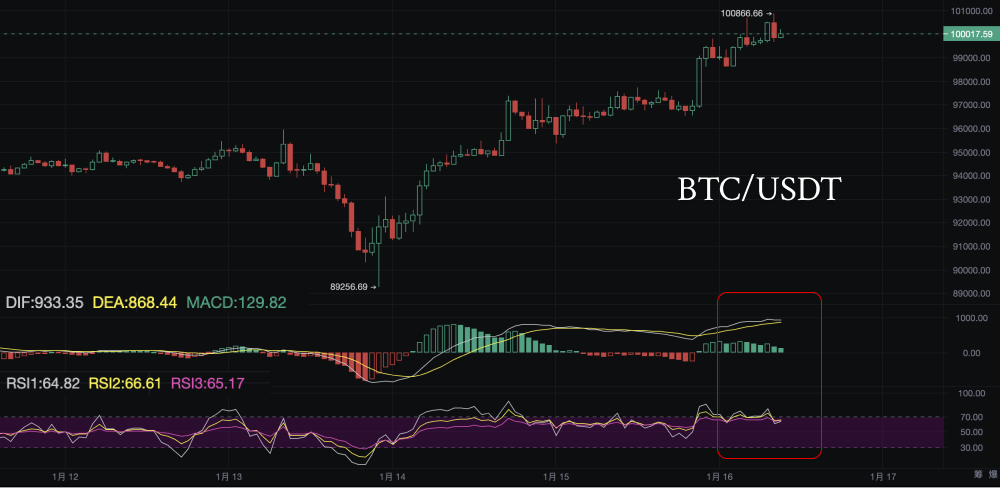
MACD: The hourly MACD is in the bullish zone, but the red bars are shortening, indicating potential pullback pressure.
RSI: The RSI is close to 70, entering the overbought zone, necessitating caution regarding short-term pullback risks.
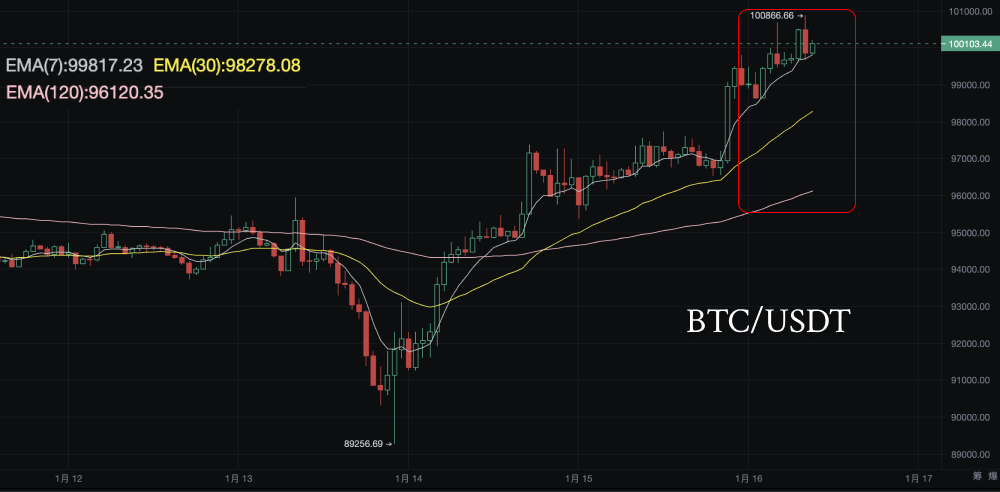
EMA: The current price is above the EMA7, indicating that the short-term trend is still upward, but attention should be paid to the support levels of EMA30 and EMA120.
Large Transactions & Chip Distribution Analysis
Dynamic Evolution of Bullish and Bearish Forces
By combining large transactions with the dynamics of chip distribution, we can further analyze the confrontation between bullish and bearish forces:
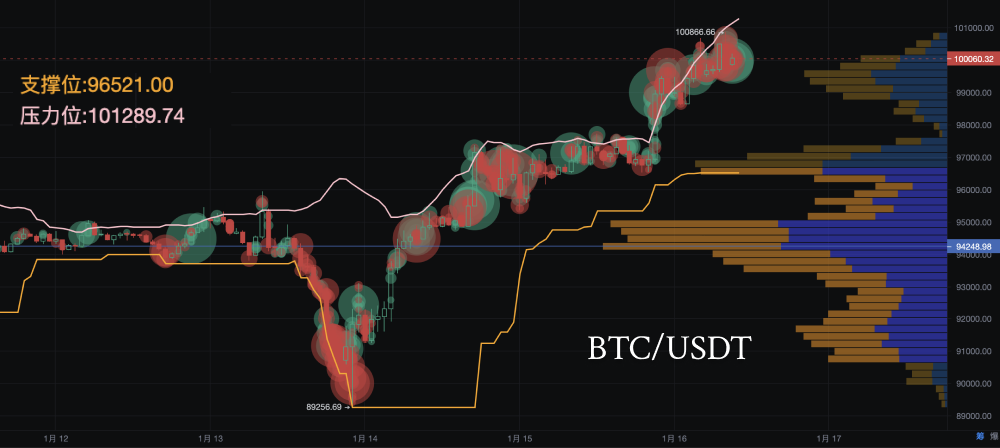
- Bullish advantage: Large buy orders concentrated around the breakout at 96000, indicating strong market support in this range. The cost of positions below the concentrated chip area is relatively low, and the current market sentiment remains predominantly bullish.
- Bearish counterattack: Large sell orders near the high of 100866.66 reflect a phenomenon of short-term bullish profit-taking. The increase in selling pressure at high levels may lead to price entering a consolidation or pullback phase.
Further Judgment of Resistance and Support Levels
- Key resistance levels: 101000-101500
- The current price is close to the upper band of the Bollinger Bands, and the chip density in this area is low. Further upward movement is expected to require a breakthrough of this psychological barrier. Key support levels: 94248-96000
- The concentrated chip area will become the main support zone for the market. A drop below this range may lead to further pullback to the middle band of the Bollinger Bands. Bottom support: 89000-92000
If the market enters a deep adjustment, the bottom accumulation area of 89000-92000 will become the last line of defense.
CPI Data Analysis and Interpretation
1. Data Release Interpretation
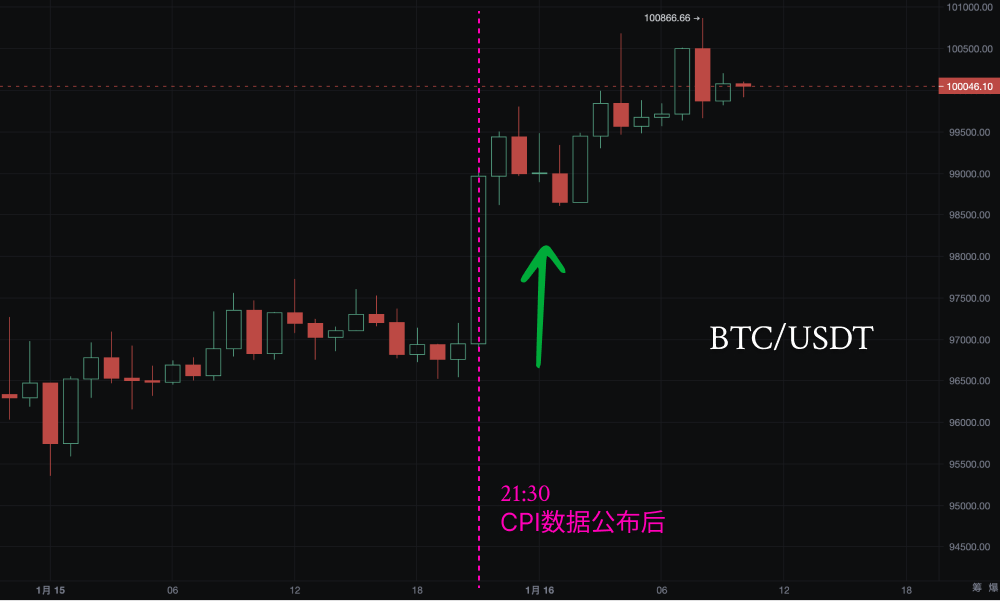
Actual value: 2.9%, consistent with the expected value. The CPI meets market expectations, indicating that the inflation level in the U.S. remains stable and has not worsened further. The market's expectations for the Federal Reserve's interest rate hikes will not be significantly strengthened, which is a short-term positive for risk assets (such as Bitcoin).

After the data release, the price of Bitcoin quickly rose by 1.31%, indicating positive market sentiment and dominant bullish power.
2. Market Sentiment and Capital Flow Analysis
Market sentiment: The data meets expectations, and concerns about the macroeconomic environment in the risk asset market have decreased, driving capital into high-risk assets like Bitcoin.
Capital flow: After the data release, buying pressure significantly increased in the short term, pushing Bitcoin's price to test key resistance levels, indicating that the current market is generally in an optimistic mood.
Today's Trend Prediction
Short-term Trend Prediction
- Upward space: Bitcoin has already broken through the psychological barrier of 100000 after the data release, approaching the previous high resistance level of 100866.66. If bullish power continues to strengthen, it may further test the key resistance area of 102000 or even 105000.
- Pullback risk: Although the upward trend is clear, the short-term increase is significant, and the upper band of the Bollinger Bands has been clearly broken, indicating some pullback pressure. The key areas for support on a pullback are 98000 and 97000. If the pullback stabilizes at 98000, it will form a more solid upward momentum.
- Medium to long-term trend: The CPI data meets expectations, and the pressure for interest rate hikes has weakened. Bitcoin is generally in a trend of oscillating upward. Future trends will rely more on the market's interpretation of macroeconomic data and whether the bulls can effectively break through the long-term resistance level of 105000.
Investment Advice Reference
Short-term Trading Advice
- Current price: Around 100000
- Aggressive strategy: If the price breaks through the previous high resistance level of 100866.66, it is recommended to go long, with a stop loss set below 100000, targeting 102000 and 105000. If the price pulls back and stabilizes at 98000, consider trying a small long position, with a stop loss set below 97000, targeting the same levels.
- Conservative strategy: Wait for the price to effectively break through 102000 before entering the market to avoid short-term pullback risks.
- Bearish strategy: If the price fails to break through 100866.66 and pulls back below 98000 in the short term, a slight drop to 97000 or below may occur, at which point consider shorting, targeting 96152.
Medium to Long-term Investment Advice
- Layout suggestion: Bitcoin is currently in an overall oscillating upward channel. If it subsequently pulls back to 97000 or lower, consider laying out medium to long-term long positions, targeting 105000 or even 110000.
- Position control: Considering the current increase in market volatility, it is recommended to control positions, remain flexible, and gradually increase positions as the market clarifies.
Risk Control
- Stop loss and take profit: For short-term long positions, set stop loss below 98000, with target take profit at 102000 and above. For medium to long-term positions, set stop loss below 97000, with target take profit at 105000 and above.
- Pay attention to subsequent data: Statements from Federal Reserve officials, other inflation-related data, and market expectations for economic growth may all become key variables for the next market trend.
The above content is for reference only and does not constitute investment advice.
免责声明:本文章仅代表作者个人观点,不代表本平台的立场和观点。本文章仅供信息分享,不构成对任何人的任何投资建议。用户与作者之间的任何争议,与本平台无关。如网页中刊载的文章或图片涉及侵权,请提供相关的权利证明和身份证明发送邮件到support@aicoin.com,本平台相关工作人员将会进行核查。
