Technical Analysis
Key Support and Resistance Analysis
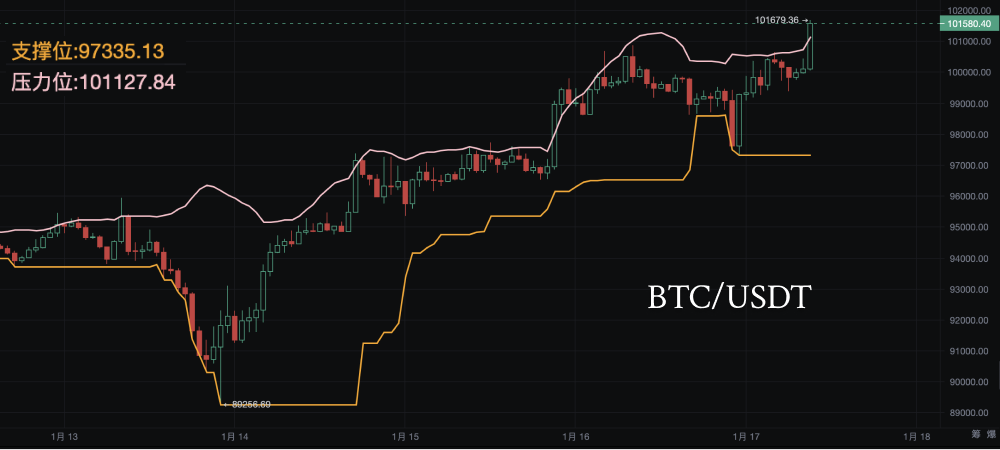
Current Support Level: $97,335
- Support Logic: $97,335 has been a repeatedly tested low point during recent pullbacks, and historical trading volume indicates strong active buying in this area, making it a key short-term support level.
- Breakdown Risk: If the price effectively falls below $97,300, combined with the lower density of chips between $93,000 and $95,000, the price may accelerate downward to the next support area at $93,000.
- Probability Assessment: The effectiveness of the support is strong, but market sentiment changes could trigger panic selling.
Current Resistance Level: $101,127
- Resistance Logic: $101,127 is at a recent high point and is also a dense area of short-term chip distribution, indicating that a large amount of capital is trapped above this price level, resulting in significant selling pressure.
- Breakthrough Conditions: The current price has broken through resistance, with significantly increased trading volume, and if the upper area around $102,000 continues to see increased volume, it can confirm an upward trend.
Chip Distribution Analysis
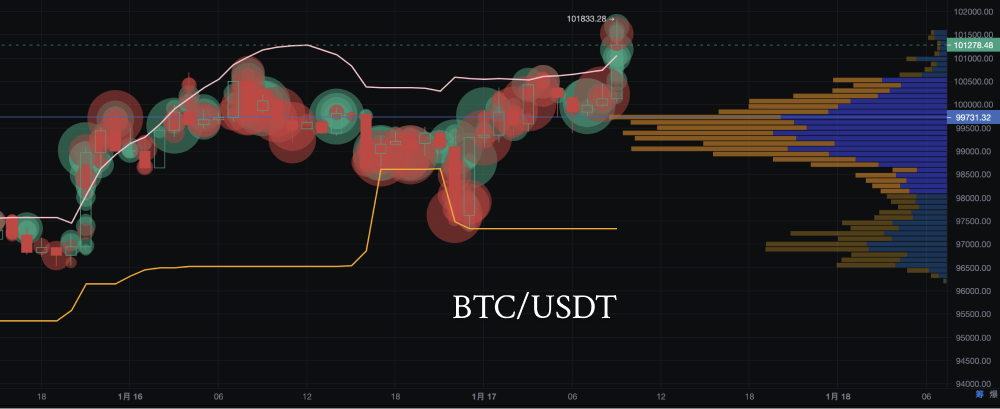
- Pressure Range ($100,000 to $101,000): Chip distribution shows this area as a recent high trading density zone, with the prominence of the chip peak indicating a large amount of historical trading at this price level, forming a key pressure zone.
- Support Range ($93,000 to $95,000): The chip column is relatively low, indicating insufficient market trading activity. If the price falls below support, it may quickly test lower levels, but the low chip density also provides potential space for a rebound.
3. Trading Volume and Capital Flow
Bull-Bear Power Analysis: Recently, bullish forces are concentrated in the $97,000 to $98,000 range, indicating that major funds are attempting to build a bottom area to prevent further price declines. Bears are concentrated above $100,000, reflecting insufficient market confidence and heavy selling pressure at high levels.
Large Transaction Characteristics: Buy orders are concentrated between $95,000 and $97,000, showing that funds are attempting to bottom out, but the buying strength is not yet sufficient to form a trending upward movement. Sell orders are significantly pressured above $100,000, with funds commonly reducing positions at high levels.
4. Technical Indicator Analysis
Bollinger Band Analysis
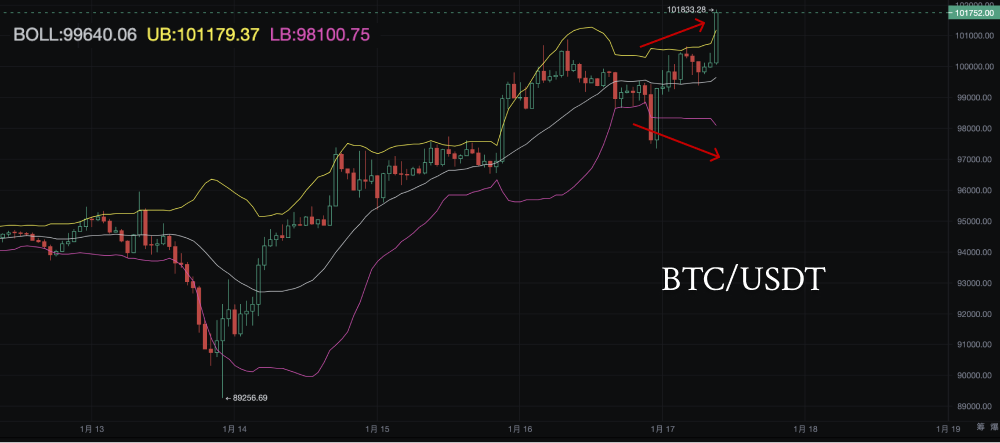
- Bollinger Band Expansion: The width of the Bollinger Bands is gradually increasing, indicating enhanced market volatility, which may lead to a trending market.
- Breakthrough Upper Band: The current price has broken through the upper Bollinger Band (yellow line), showing strong upward momentum, but caution is needed for overbought risks.
- Middle Band Support: The middle Bollinger Band (white line) is trending upward, further confirming that the price is overall in a bullish trend.
- Amplitude Analysis: Recent amplitude has gradually increased, especially before the breakout, which may attract more trading volume.
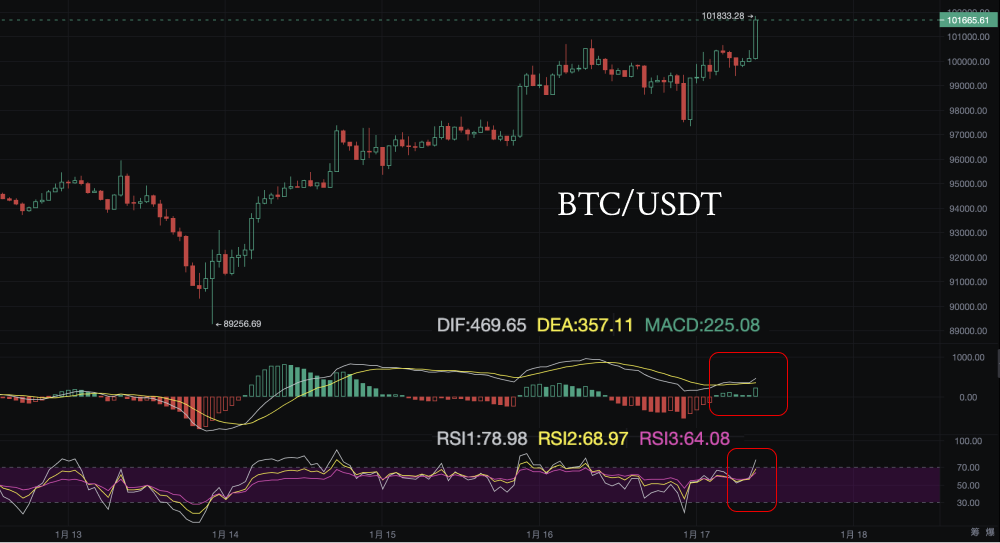
MACD: In the hourly cycle, both DIF and DEA are diverging upward, and the MACD histogram has turned positive and is gradually increasing, indicating that bullish strength is strengthening in the short term.
RSI: RSI13 is around 64, close to the overbought zone, but has not yet entered extreme territory, indicating that there is still some upward space in the market.
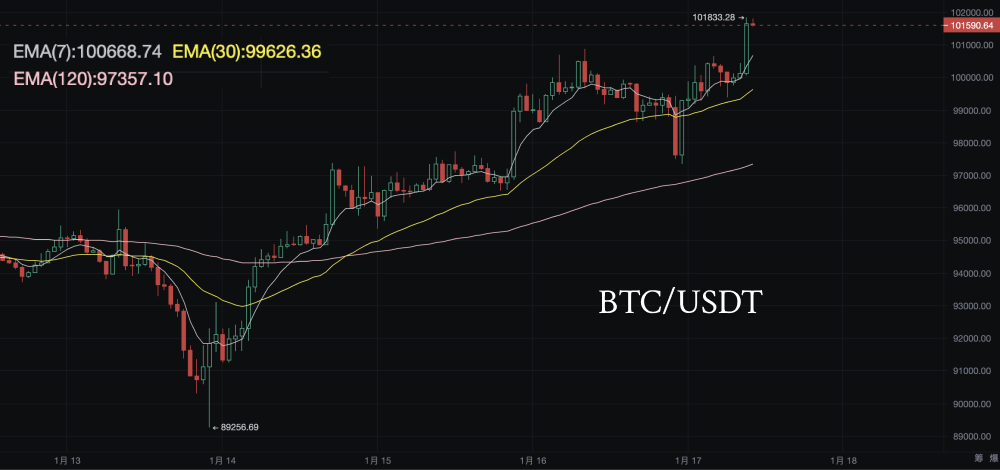
EMA: The current price is above EMA7, EMA30, and EMA120, and EMA7 > EMA30 > EMA120, forming a bullish arrangement that supports a continued bullish outlook.
Fundamental Analysis
1. Macroeconomic and Policy Background
- US Dollar Index and US Treasury Yields: The US dollar index has recently strengthened, putting downward pressure on dollar-denominated assets like Bitcoin. High US Treasury yields further weaken the attractiveness of risk assets, leading investors to prefer low-risk options.
- Global Monetary Policy: The ongoing tightening of the Federal Reserve's monetary policy has created pressure on the Bitcoin market, but increasing expectations for a policy turning point may become a potential catalyst for a rebound.
2. Industry and Market Hotspots
- Bitcoin ETF Progress: Institutional investors' demand for Bitcoin ETFs remains a key focus in the market, but there are no clear short-term benefits, reflecting a cautious market sentiment.
- On-chain Data and Position Distribution: On-chain data shows that whale addresses (large Bitcoin holding addresses) have recently shown signs of continuous accumulation, indicating that long-term funds are willing to increase positions in low areas.
3. Market Sentiment
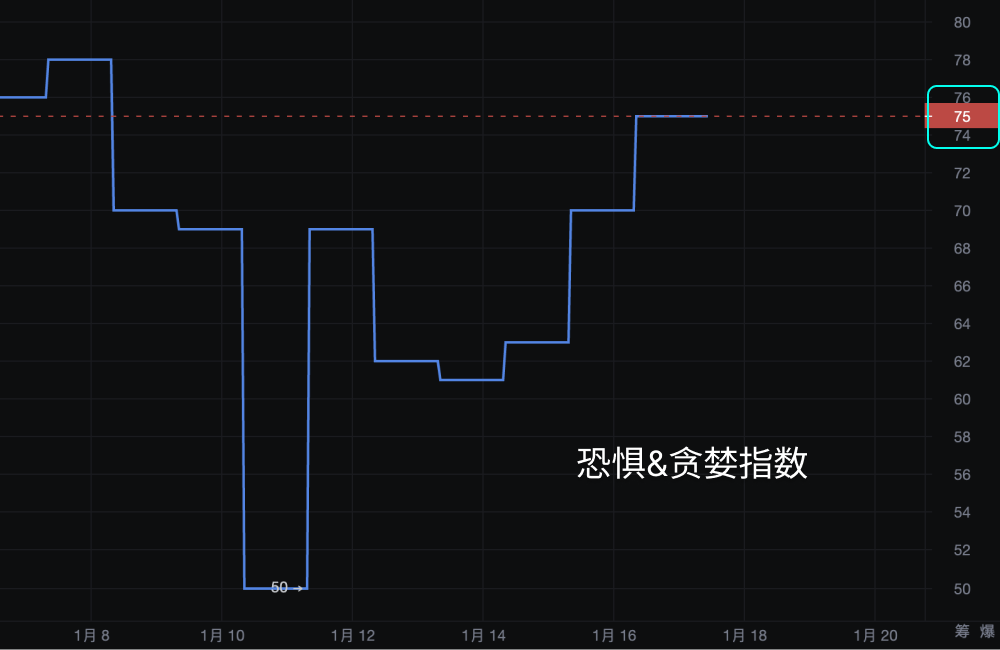
- Fear and Greed Index: Currently in the 70 to 80 range, indicating that market sentiment leans towards greed, with investors showing strong bullish sentiment.
- Retail and Institutional Behavior: Retail investors are frequently trading short-term, tending to buy high and sell low; institutional investors, on the other hand, show signs of positioning at lower levels, with significant divergence between short-term and long-term funds.
Trend Prediction and Strategy Suggestions
Short-term Market Prediction
Core Logic: The price is currently in a short-term consolidation range ($97,300 to $100,800), with a high probability of fluctuation. Attention should be paid to the breakout of support and resistance. If trading volume supports it, the likelihood of a price breakout to the upside is slightly higher than a downside breakdown, but external market news could disrupt short-term trends.
Key Price Ranges
- Upside Target: $101,000 to $102,000 (strong resistance range).
- Downside Risk: If it falls below $97,300, it will quickly test the $93,000 to $95,000 support zone.
Investment Strategy
Short-term Trading Suggestions
Buy on Dips:
- Buy Range: $97,300 to $98,000.
- Stop Loss: $96,500.
- Target Price: $99,500 to $100,800.
Sell High Strategy:
- Sell Range: $100,800 to $101,500.
- Stop Loss: Above $101,800.
- Target Price: $98,000.
Medium-term Strategy Suggestions
- Gradual Position Building: If the price falls back to the $93,000 to $95,000 range, consider buying in batches to position for a medium-term rebound.
- Position Control: Initial position should be controlled at 20%-30%, waiting for further confirmation of the trend before gradually increasing positions.
Risk Control Measures
- Set Strict Stop Losses: Avoid significant losses due to emotional fluctuations; it is recommended that each trade's loss does not exceed 2% of total capital.
- Monitor External News: Focus on tracking macroeconomic events (such as Federal Reserve meetings), Bitcoin ETF dynamics, and industry on-chain capital flows.
The above content is for reference only and does not constitute investment advice.
If you have any questions, you can contact us through the following official channels:
AiCoin Official Website: www.aicoin.com
Telegram: t.me/aicoincn
Twitter: x.com/AICoincom
Email: support@aicoin.com
Group Chat: Customer Service Yingying、Customer Service KK
免责声明:本文章仅代表作者个人观点,不代表本平台的立场和观点。本文章仅供信息分享,不构成对任何人的任何投资建议。用户与作者之间的任何争议,与本平台无关。如网页中刊载的文章或图片涉及侵权,请提供相关的权利证明和身份证明发送邮件到support@aicoin.com,本平台相关工作人员将会进行核查。
