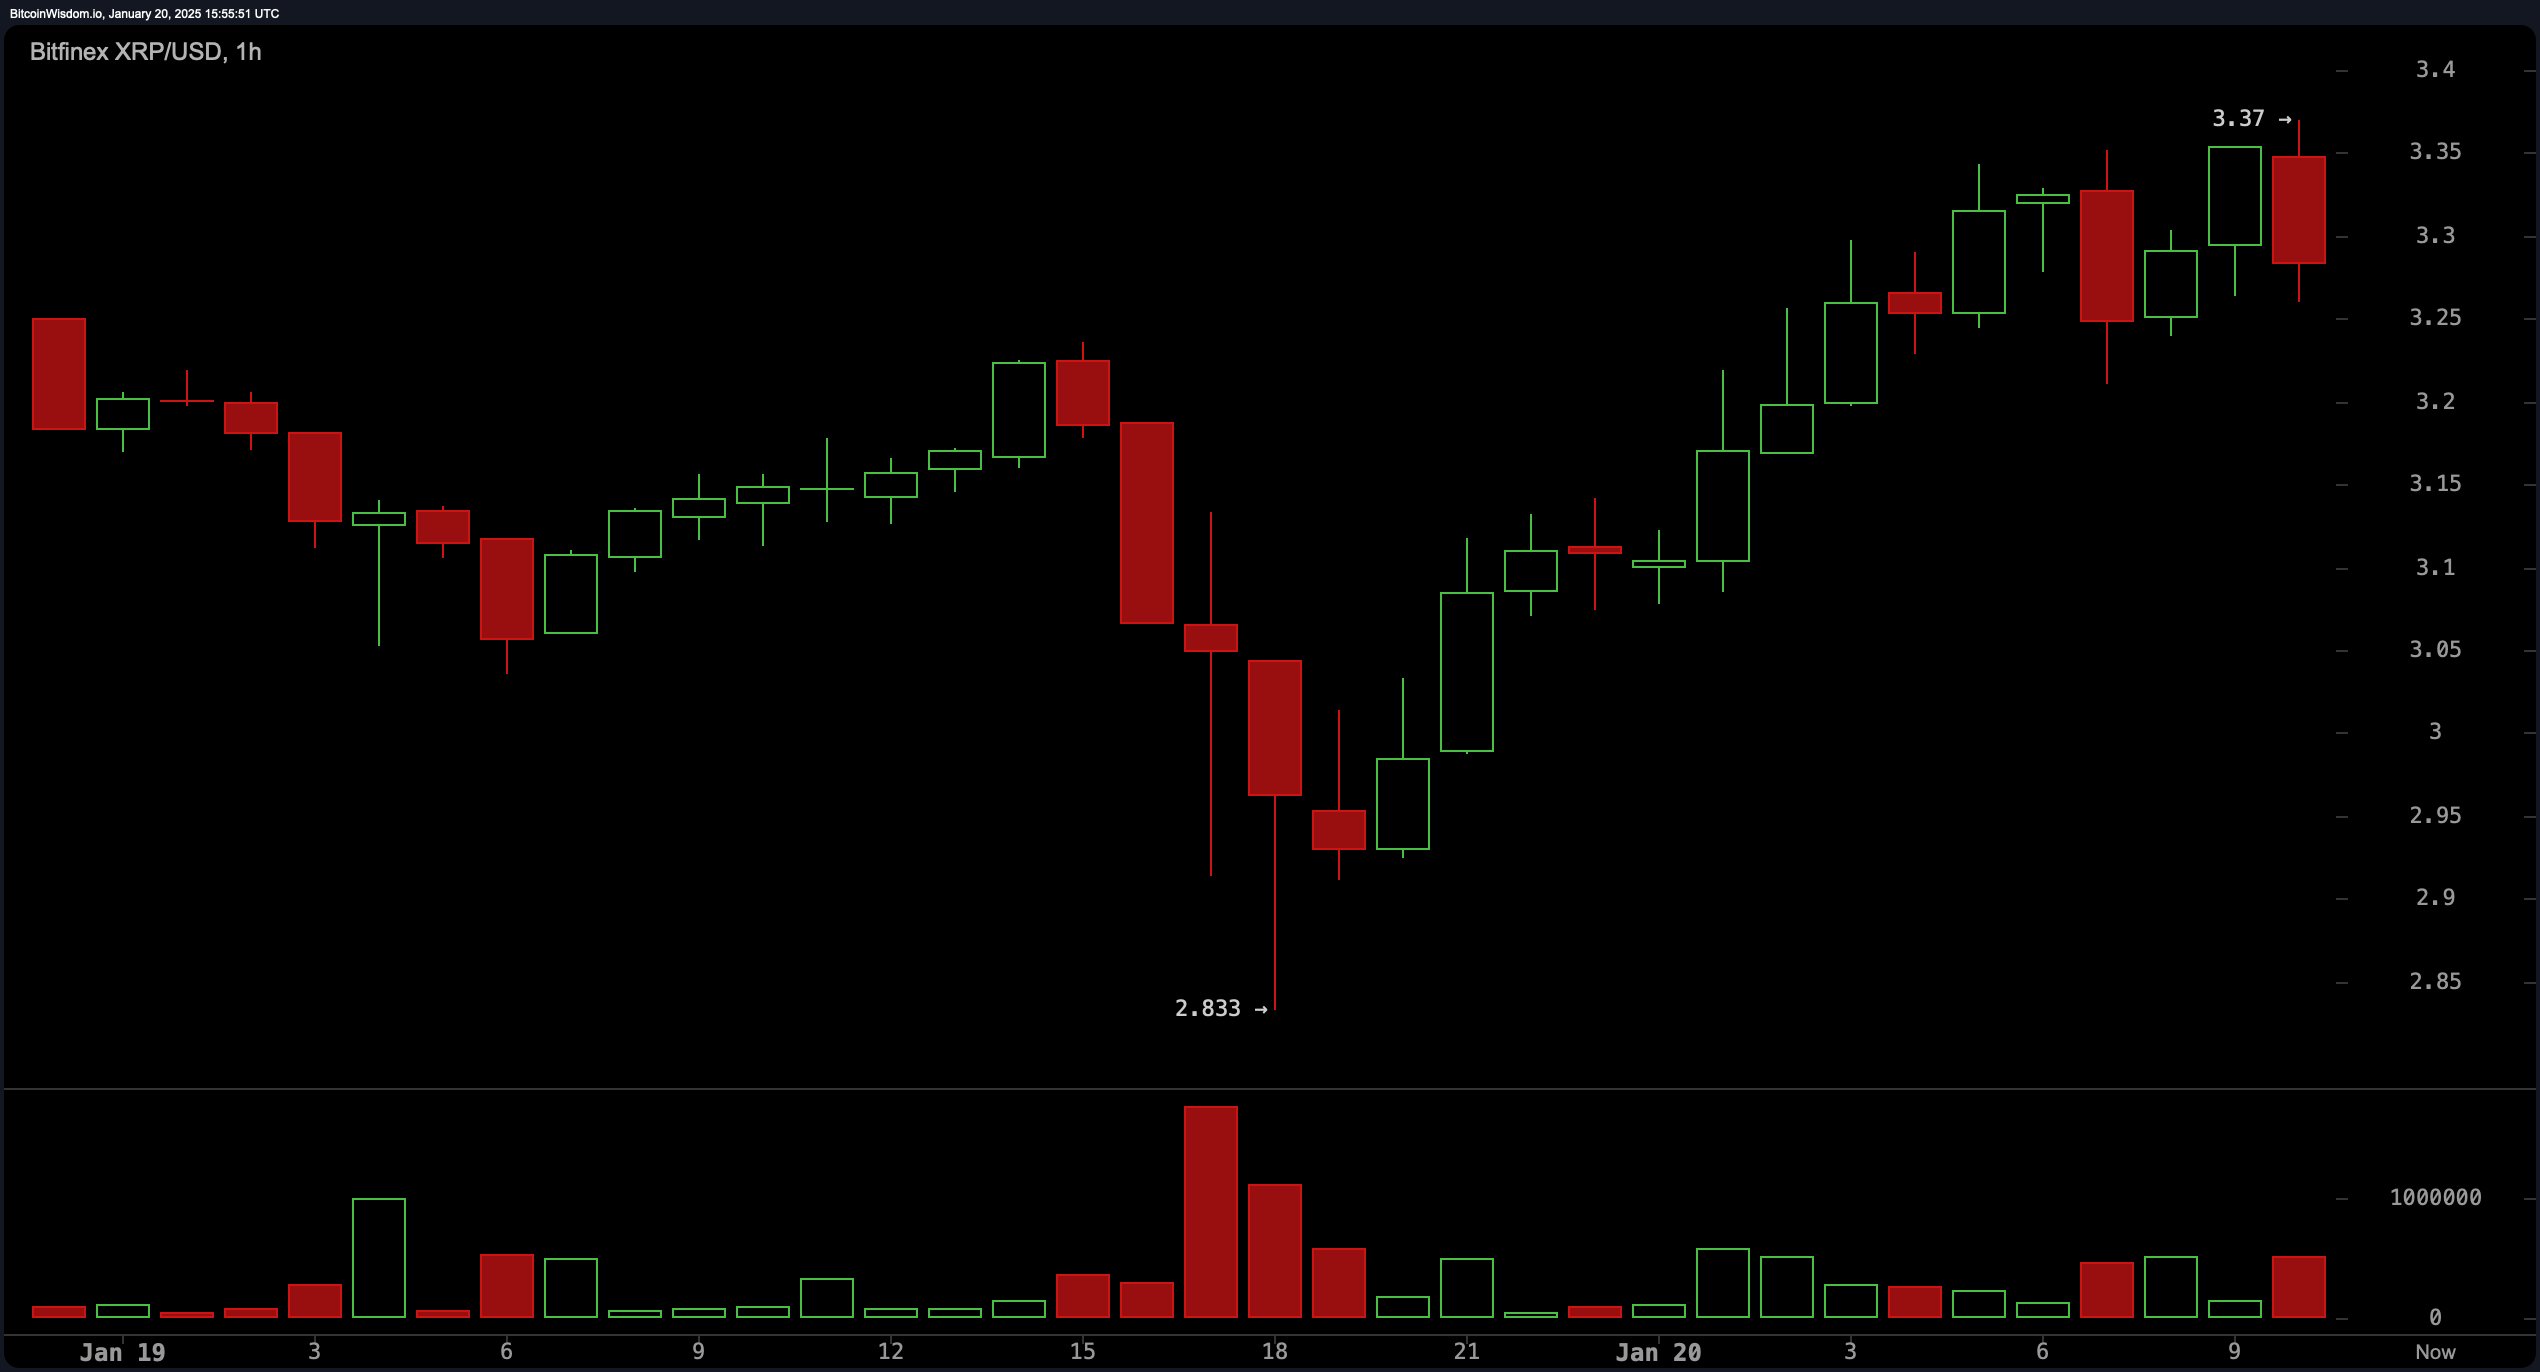
On XRP’s 1-hour chart, a transient retracement has emerged following XRP’s attempt to breach resistance at $3.37. The nascent support at $3.3 suggests the potential for accumulation within this range. Subdued hourly trading volume underscores a broader atmosphere of indecision among market participants; however, a decisive move above $3.37, accompanied by heightened volume, could crystallize as a tactical opportunity for short-term traders. Resistance at $3.4 remains formidable, while a breach below $3.3 could catalyze a deeper consolidation near the $3.25 zone.

XRP/USD 1H chart on Jan. 20, 2025.
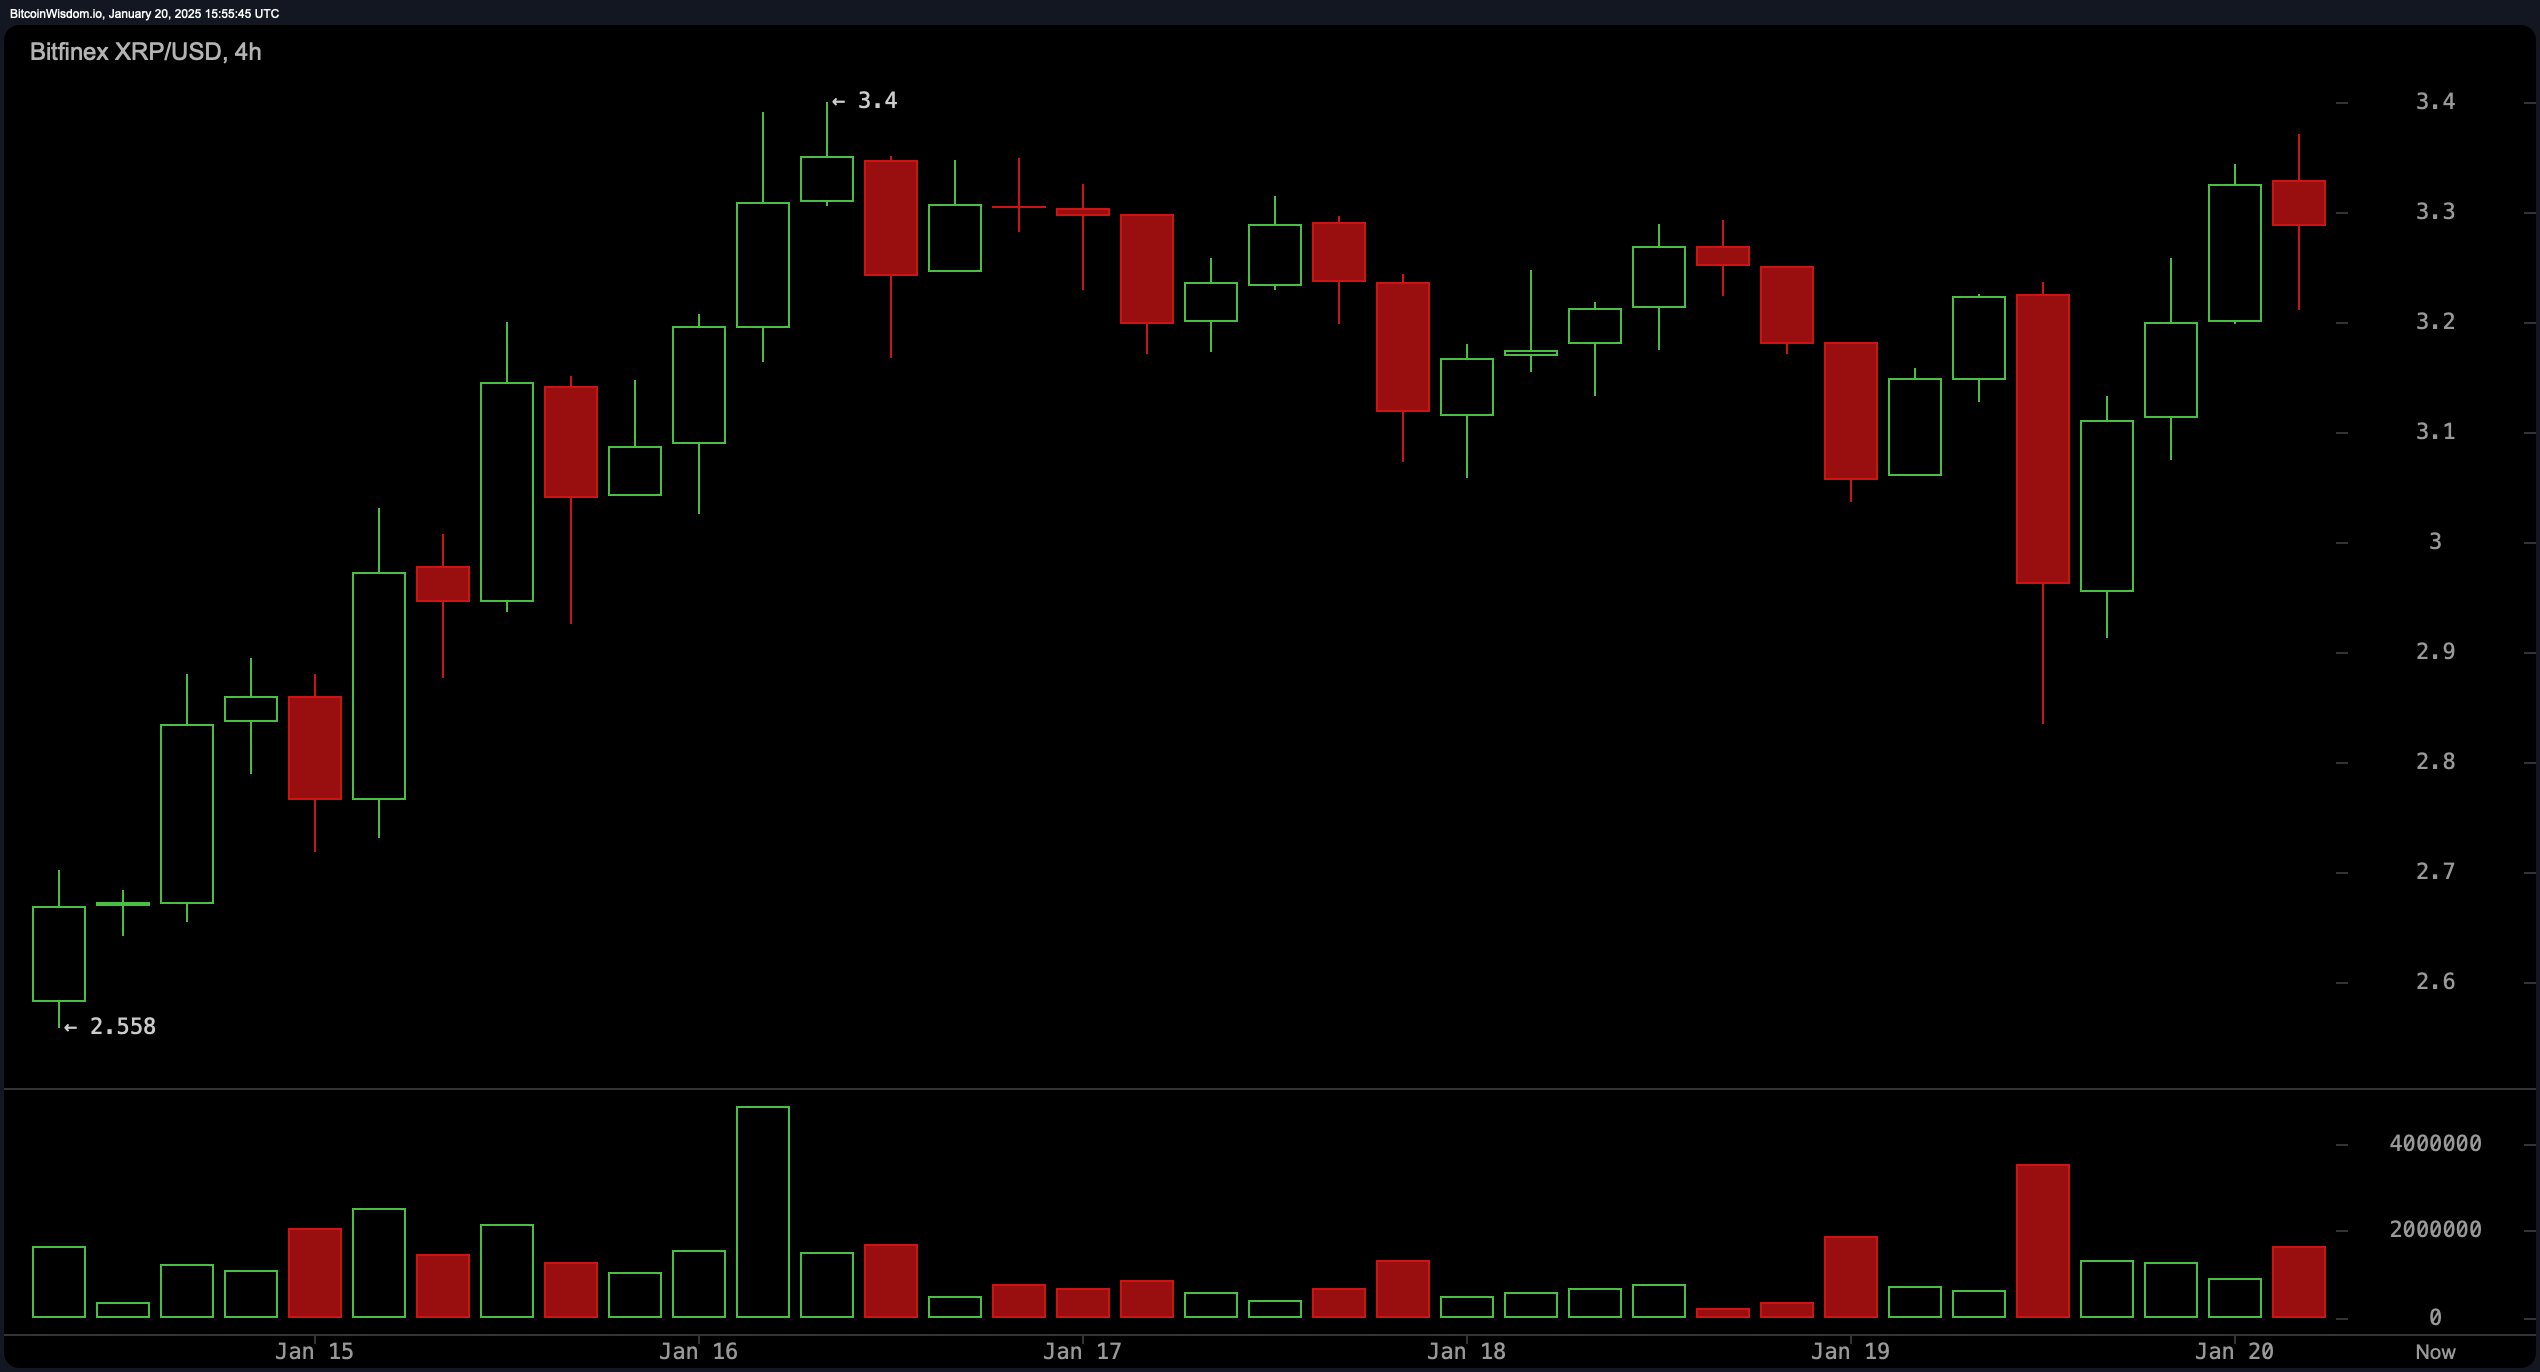
The 4-hour chart presents a more nuanced perspective, underscoring a resurgence of bullish momentum after a pullback to $2.83. The price is currently consolidating below the pivotal $3.4 level. Bullish candlestick patterns, accompanied by sporadic volume surges, point to sustained positive sentiment. A successful break above $3.4 would clear a path toward $3.6, whereas a descent below $3.2 could invite a retest of critical support at $3.0 or even $2.83, contingent on evolving market sentiment.

XRP/USD 4H chart on Jan. 20, 2025.
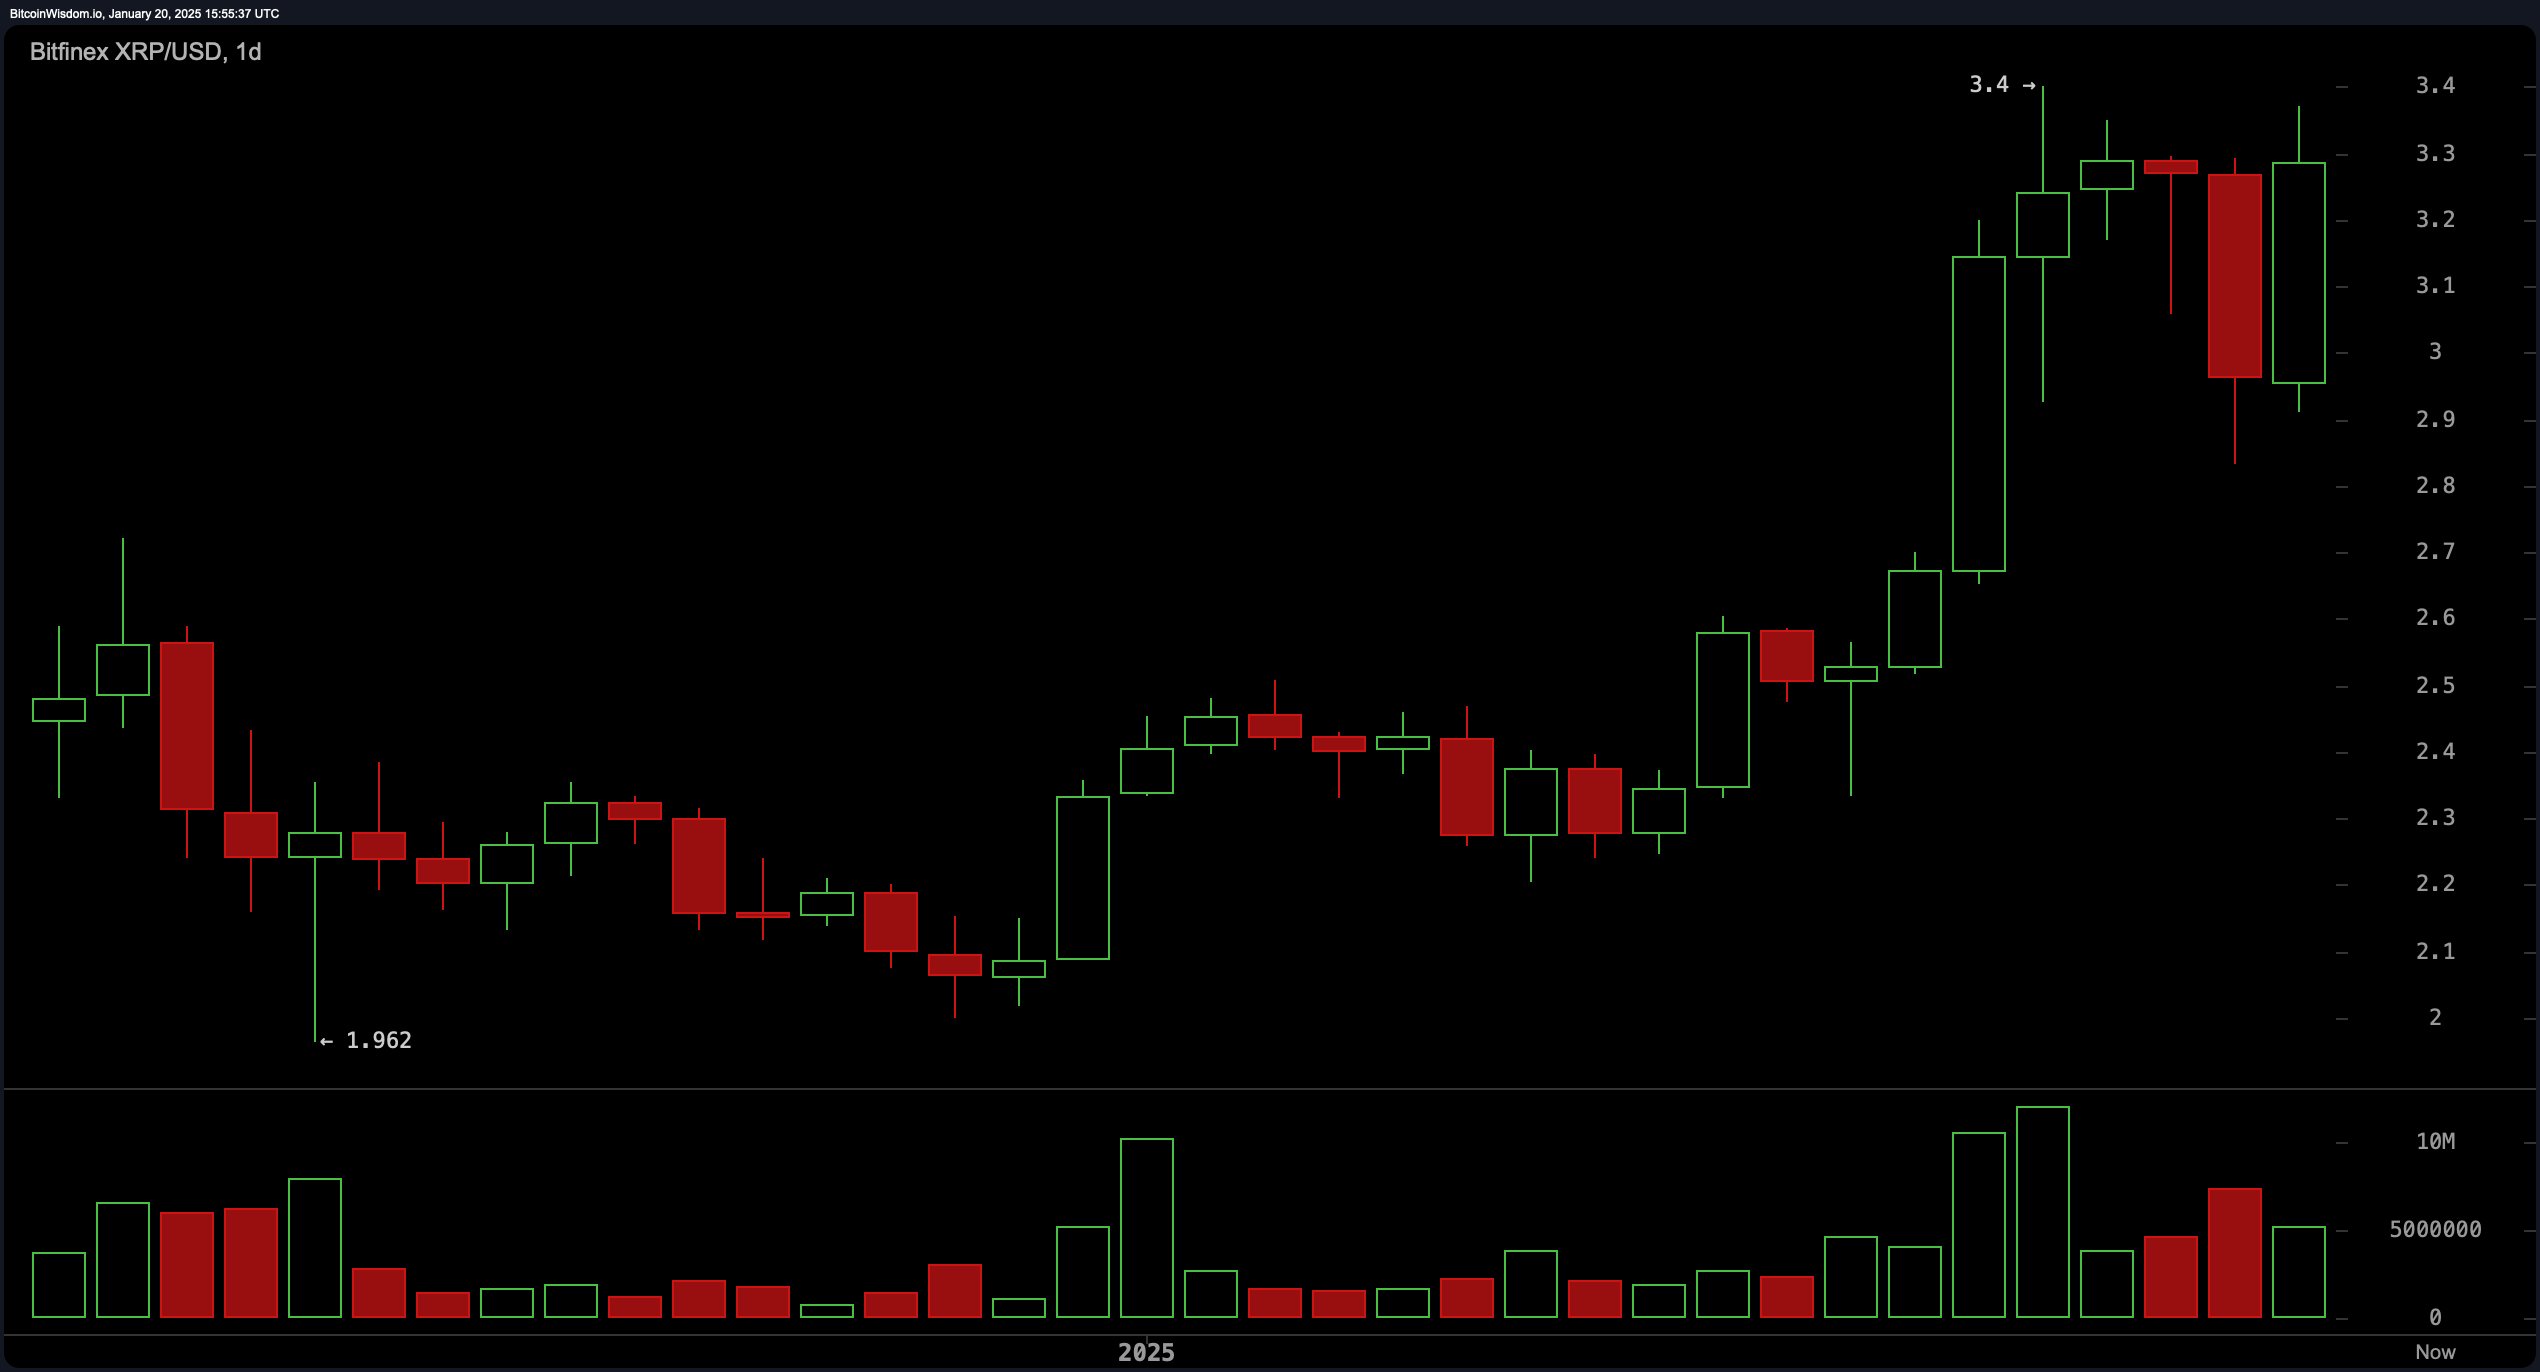
Zooming out to the daily chart reveals the cryptocurrency’s adherence to a broader uptrend, marked by a sequence of higher highs and higher lows. After recently touching $3.4, the price retreated to $3.0, now functioning as a critical support level—previously a zone of resistance. Volume dynamics continue to reflect strength during upward movements, reinforcing the premise of trend continuation as long as the $3.0 support level remains intact.

XRP/USD 1D chart on Jan. 20, 2025.
Technical oscillators display a largely neutral disposition. The relative strength index (RSI) stands at 68.24, while the Stochastic registers at 80.84, signaling that XRP is nearing overbought territory without triggering definitive reversal indicators. Meanwhile, the momentum indicator reads 0.9373, and the MACD level (12, 26) at 0.2590 reflects an underlying bullish bias, hinting at potential upward extensions in price action.
Moving averages across multiple timeframes reinforce a strongly bullish outlook. The exponential moving averages (EMA) and simple moving averages (SMA) for the 10-, 20-, and 50-period intervals remain comfortably above $2.94. Meanwhile, the EMA (200) at $1.3959 and SMA (200) at $1.1068 provide substantial long-term support. Collectively, these metrics affirm XRP’s broader structural strength as market participants turn their attention to key resistance levels on the horizon.
Bull Verdict:
XRP exhibits a compelling technical setup that favors continued bullish momentum. The sustained higher highs and higher lows on the daily chart, coupled with strong moving average support and positive volume dynamics during upward movements, indicate a structurally sound uptrend. If XRP can decisively break above $3.4 with increased volume, it could open the door to $3.6 or higher in the near term, maintaining its bullish trajectory.
Bear Verdict:
Despite XRP’s current upward momentum, the market shows signs of potential vulnerability. Resistance at $3.4 remains unyielding, and waning volume on shorter timeframes points to a lack of conviction among buyers. A breach below $3.3 could trigger consolidation near $3.25 or even a retest of lower support at $3.0 or $2.83. If sellers gain control and market sentiment turns cautious, XRP could face further corrective pressure.
免责声明:本文章仅代表作者个人观点,不代表本平台的立场和观点。本文章仅供信息分享,不构成对任何人的任何投资建议。用户与作者之间的任何争议,与本平台无关。如网页中刊载的文章或图片涉及侵权,请提供相关的权利证明和身份证明发送邮件到support@aicoin.com,本平台相关工作人员将会进行核查。


