Projects with a large distribution ratio and fewer lock-up mechanisms perform better.
Author: 0xLaoDong
🔹 2024 Airdrop Rankings
• Top FDV on launch day: StarkNet, $19.2 billion.
• Highest airdrop value: Hyperliquid, $2.613 billion, average per address $28,000.
• Top for zero-cost airdrop: Movement, $734.8 million airdrop.
• Top for number of airdrop addresses: HMSTR, 129 million TG accounts, average $3.
• First in price increase: UXLINK, 15 times compared to the closing price on the day of ATH.
• First in price decrease: HLG, 30-day price drop of 90.66%.
💡 Core Insights
Emerging narrative tracks are rising, while traditional popular tracks are cooling down. The 30-day average increase for traditional popular tracks (infrastructure, Layer2, GameFi) is -1.34%, while new narrative tracks like DEPIN, RWA, and AI have a 30-day average increase of 41.98%, indicating that investors should pay attention to emerging tracks.
2024 project valuations are relatively high, with optimistic market expectations. The average FDV/funding ratio for 79 projects on launch day is 103.9 times, indicating that overall project valuations in 2024 are high, and market expectations are optimistic, but there may be some bubbles.
Frequent speculative operations in the early stages lead to significant price volatility. 40% of projects reached ATH on the first day, while 1% reached ATL on the first day. This indicates that most projects face significant selling pressure in the early stages, with many investors inclined to engage in speculative operations at launch, which may lead to rapid price declines afterward.
Most projects show a clear downward price trend in the short term. 62% of projects are in a downward trend within 7 days, and 65% within 30 days. Most projects face a downward price trend shortly after TGE, and the proportion and magnitude of declines increase over time.
Projects with a large distribution ratio and fewer lock-up mechanisms perform better. Projects with a larger distribution ratio are generally more stable and perform well, with a 30-day average increase of 16.66%. Tokens with lock-up mechanisms perform poorly, with a 30-day average decrease of -43.73%.
More platforms lead to higher recognition. As the number of listed exchanges increases, the average funding amount and FDV of projects significantly rise, indicating that market recognition and liquidity have increased, and risk tolerance has also improved.
🧑💻 Introduction
2024 is a year of alternating bull and bear markets, as well as a year of extreme volatility in the crypto market. BTC has surged from a low of $38,500 at the beginning of the year to over $100,000. Meanwhile, as market enthusiasm warms up, project activities are gradually increasing.
Compared to only 270 TGE projects in 2023, this number skyrocketed to 731 in 2024, an increase of 170%. Among these numerous projects, only a small portion are "big players" and "medium players," while most are still "small players" and "tiny players." How have these projects performed after launch?
To answer this question, Lao Dong selected 100 relatively hot and representative projects from 2024, conducting a systematic analysis based on key data such as funding scale, price performance, and distribution rules, revealing the trends and patterns of current airdrop projects. This article will let the data speak, helping readers understand the situation of airdrop projects in 2024.
🔗 Data Table
This article does not provide any investment advice, only objective data statistics and analysis.
📊 Data Analysis
I. 2024 TGE Track Analysis
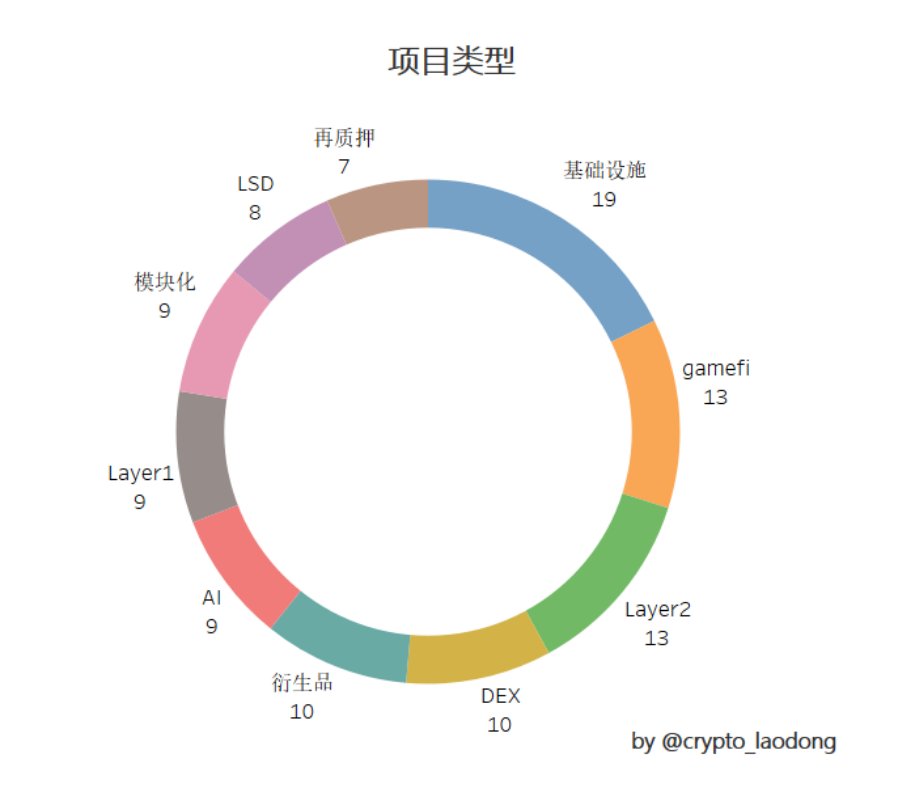
The chart shows the distribution of project types in 2024. It can be seen that the TGE of VC coins in 2024 is mainly concentrated in traditional popular tracks such as infrastructure, GameFi, and Layer2. Projects in these tracks typically require a longer construction cycle, with many actually developed over the past few years and only launching in 2024.
Infrastructure projects: 19, 30-day average increase of 12.18%
Layer2 projects: 12, 30-day average increase of -0.2%
GameFi projects: 12, 30-day average increase of 2.3%
This year's main emerging popular narratives revolve around DEPIN, RWA, and AI, with relatively few overall TGE projects, but this type of project performs exceptionally well. They may continue to explode in the future.
AI projects: 3, 30-day average increase of 24.56%
DEPIN projects: 3, 30-day average increase of 53.56%
RWA projects: 3, 30-day average increase of 42.17%
Traditional popular tracks are gradually cooling down, while emerging narratives are rapidly rising, making it potentially a better investment direction to focus on new narrative tracks.
II. Funding Situation and FDV Analysis
Out of 100 projects, 79 disclosed their funding, with an average funding amount of $38.91 million.
There are 8 projects with funding exceeding $100 million.
The largest proportion of projects falls within the $10 million to $100 million range, with 44 projects.
There are 26 projects in the $2 million to $10 million range.
VC institutions typically conduct strict due diligence on projects, reflecting the market's recognition of the projects. The larger the amount, the stronger the investors' confidence in their future development. The frequency of funding can also indicate changes in track popularity and the direction of capital attention; however, funding amounts do not completely determine the quality of projects, and we need to analyze from multiple dimensions.
FDV (Fully Diluted Valuation) is an indicator used to assess the future potential value of a project. FDV is influenced by multiple factors before a project launches, including funding amount, initial circulation, market sentiment, narrative direction, track popularity, liquidity, and trading depth.
To more objectively assess the relationship between initial project valuation and actual funding, we use the FDV/funding ratio based on the closing price on the day of launch to categorize ranges and analyze the market performance of projects in different ranges:

- FDV/funding range 0-20: Reasonable or conservative. There are 21 projects in this range, with an average funding amount of $48.83 million. Data shows that 57% of these projects did not exceed the closing price on the day within 7 and 30 days, indicating that the market expectations for these projects are relatively stable, valuations are reasonable, and investment risks are low.
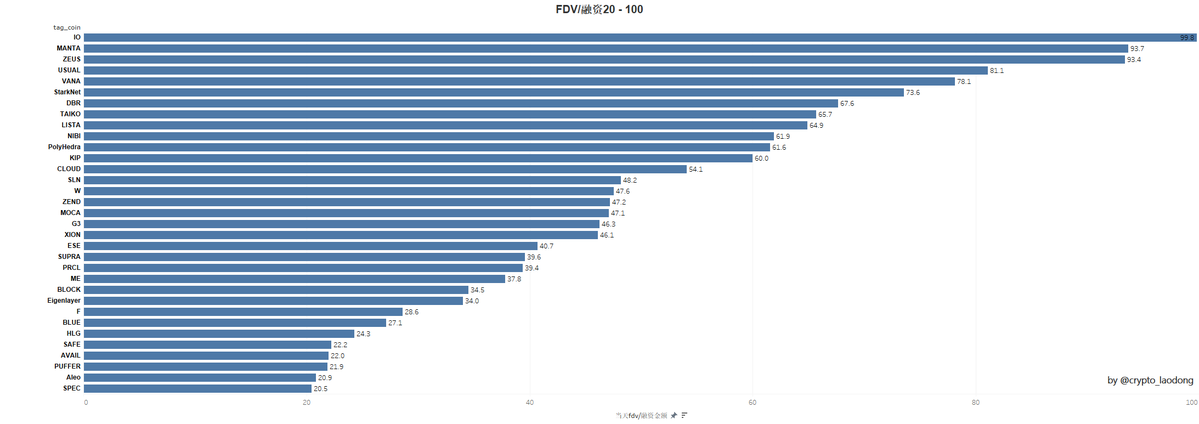
- FDV/funding range 20-100: Expectations are high. There are 33 projects in this range, with an average funding amount of $51.64 million. Statistics show that 63.6% of projects weakened in price within 7 days, and this proportion increased to 75.8% after 30 days, indicating that investors had high expectations for these projects initially, but significant price corrections occurred in the short term, posing certain volatility risks.

- FDV/funding range above 100: High-risk speculation. This range includes 24 projects, with an average funding amount of $12.72 million. These projects are mostly small-scale projects with funding below $100 million. Data shows that 70.8% of projects weakened in price after 7 days, and this proportion decreased to 54.2% after 30 days. These projects are concentrated in hot tracks such as infrastructure, GameFi, and LSD.
Among the 79 statistical projects, the average FDV/funding ratio is 103.9 times, indicating that overall project valuations in 2024 are high, and market expectations are optimistic.
III. ATH vs ATL Analysis
Analyzing ATH (All-Time High) and ATL (All-Time Low) can help us comprehensively understand a project's overall performance in the market and the level of investor recognition. Analyzing ATH/closing price and closing price/ATL can assess a project's profit potential and selling pressure risk, providing data support for judging the project's initial stability, reasonable valuation, and investment timing.
Statistics on the price trends of 100 projects show that as of today, 40% of projects reached ATH on the first day, while 1% reached ATL on the same day.
- Price trend statistics for 100 projects: 40% of projects reached ATH on the first day. 1% of projects reached ATL on the first day.
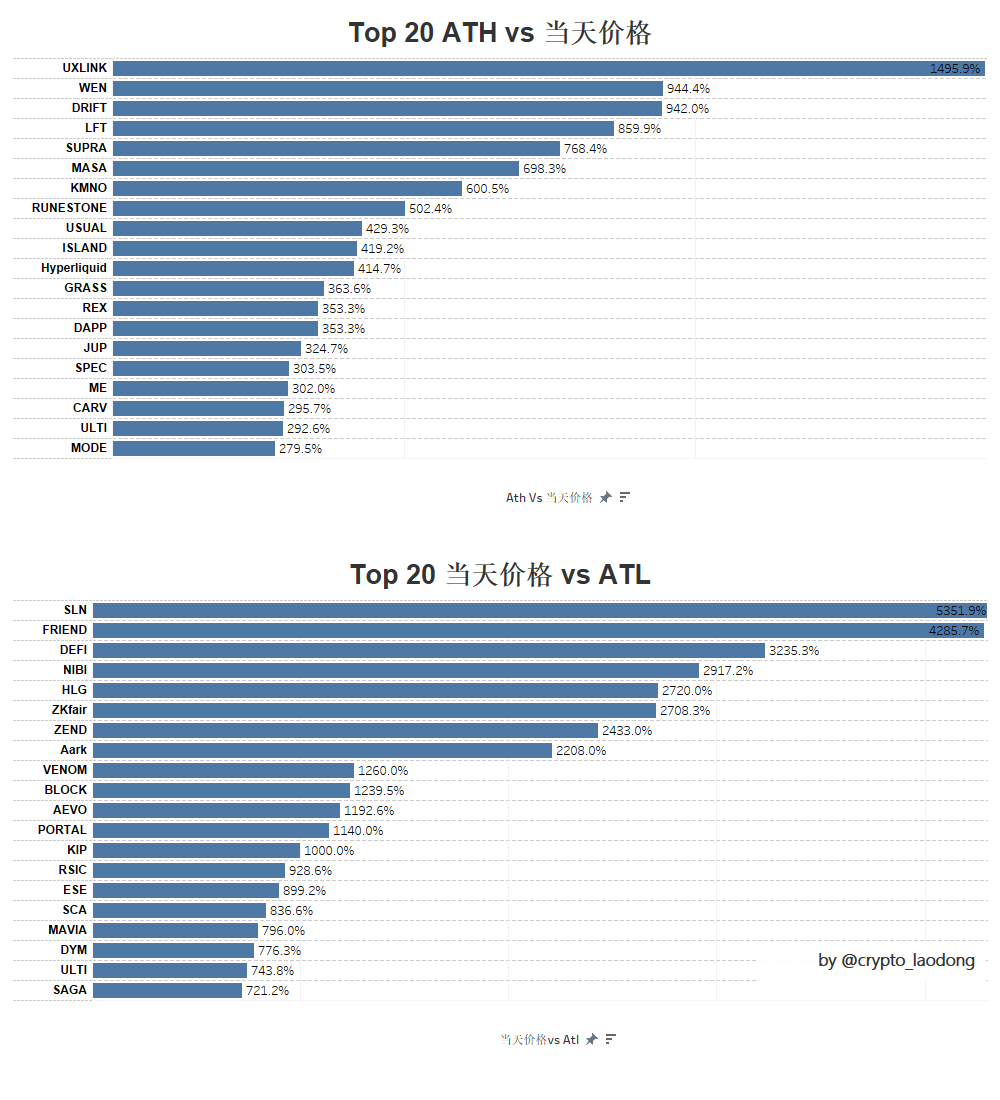
Average ATH vs. closing price is 245.22%, indicating that the closing price on that day has a potential increase of 2.45 times from the historical high. The best-performing projects include UXLINK, WEN, and DRIFT.
Average closing price vs. ATL is 633.52%, indicating that it still requires a 6.34 times increase to rise from the historical low to the closing price on that day. The worst-performing projects are SLN, FRIEND, and DEFI.
Market speculation is prominent, with 40% of projects reaching ATH on the first day, indicating that many investors tend to engage in speculative operations at the initial launch, which may lead to rapid price declines afterward.
The 245.22% increase from ATH and the 633.52% decrease from ATL indicate that the market's selling pressure risk far exceeds the profit potential of the projects. This data reflects that in the price volatility shortly after a project's launch, investors are more likely to push prices up rapidly due to high market sentiment, but may subsequently experience rapid declines due to selling pressure or token unlocks.
IV. Short-Term Project Trend Comparison
The main purpose is to analyze the short-term trends of projects. By comparing the closing price on the day with the price changes over 7 days and 30 days, we can gain a clearer understanding of the project's performance and trends in the short term.

From the chart, it can be seen:
- On the 7th day:
62% of projects have prices lower than the closing price on the day of TGE, with an average decline of 27.03%. 38% of projects have prices higher than the closing price on the day of TGE, with an average increase of 60.34%.
- Day 30:
65% of projects have prices lower than the closing price on the day of TGE, with an average decline of 37.42%. 35% of projects have prices higher than the closing price on the day of TGE, with an average increase of 74.26%.
Most projects face a downward price trend shortly after TGE, and the proportion and magnitude of declines increase over time.
Although most projects experience price declines, a small number of projects perform exceptionally well after TGE, achieving significant price increases. Some high-quality projects can gain higher market recognition in the short term and realize substantial price growth.
Among them, ISLAND GRASS RUNESTONE performs excellently, while F AARK HLG performs the worst.
Possible reasons for short-term price increases:
Excellent fundamentals: Projects with strong technical support, clear application scenarios, or innovative business models typically attract the attention of long-term investors, thereby driving price increases.
Narrative-driven: Projects that capture current market hotspots (such as GameFi, meme, DEPIN, RWA, etc.) are likely to attract market capital inflows, further driving price increases.
Strong community consensus: Community consensus can enhance a project's visibility and demand in the market, thus driving price increases. Additionally, ongoing community support can alleviate selling pressure and enhance the project's long-term stability.
Good liquidity: Strong liquidity helps stabilize project prices and boosts investor confidence.
Possible reasons for short-term price declines:
Cooling market sentiment: The price on the day of TGE is often driven by FOMO (fear of missing out) sentiment, which may exceed reasonable prices. As enthusiasm wanes, prices tend to revert to rational levels.
Increased selling pressure: After TGE, investors, especially airdrop participants or short-term investors, may choose to realize profits, leading to increased market selling pressure and price declines.
Token unlock mechanisms: Many VC tokens adopt long-term release mechanisms. As tokens unlock, early investors (such as private placement parties and teams) may choose to cash out profits, increasing market selling pressure.
Insufficient liquidity: Some projects may experience insufficient liquidity and limited trading depth after TGE. Once large sell orders occur, prices can drop rapidly, exacerbating volatility.
V. Impact of Distribution Ratio on Price
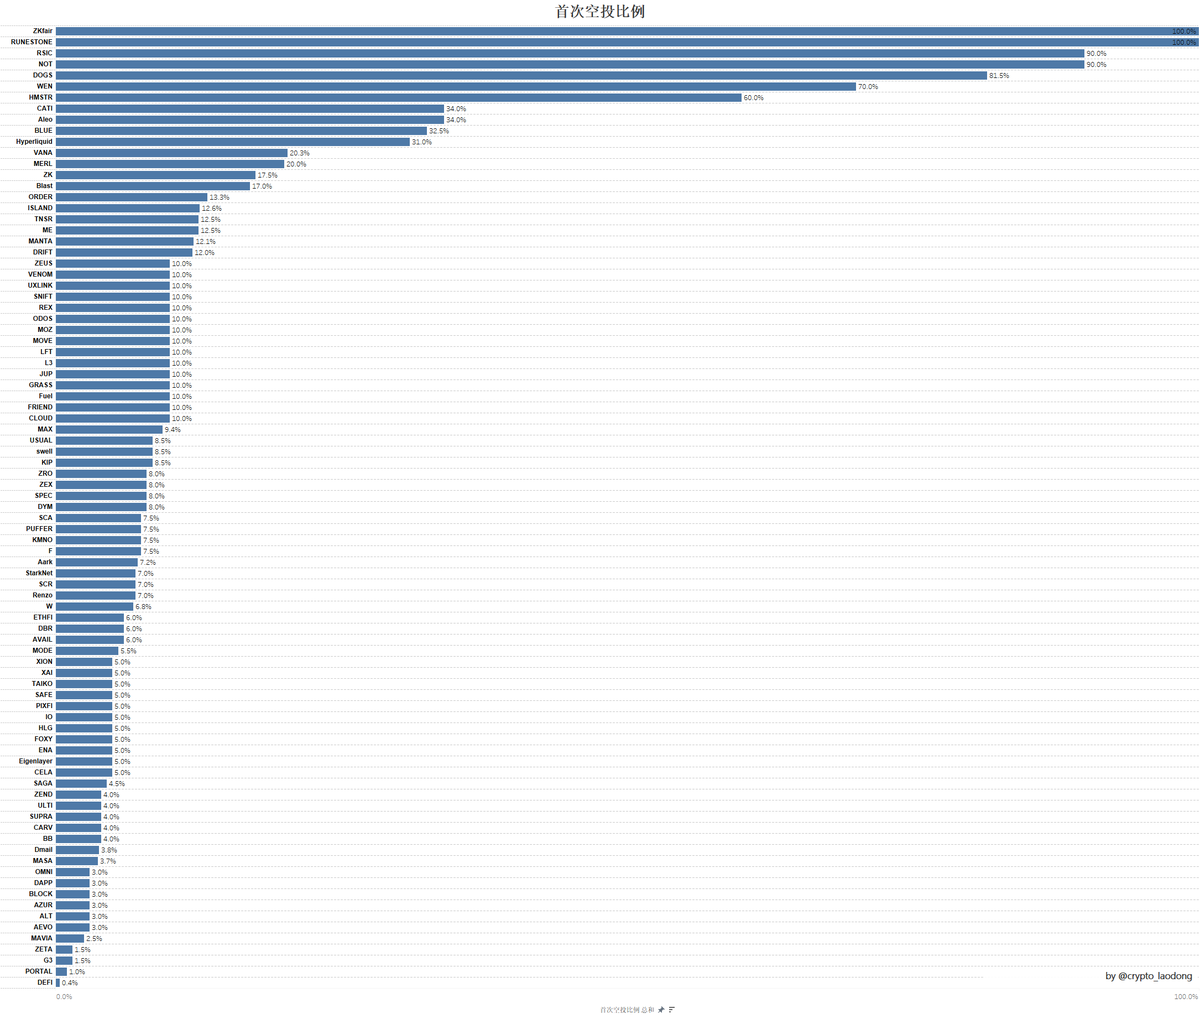
Projects with airdrop ratio greater than 15%: 15 projects, with a 7-day average increase of 11.87% and a 30-day average increase of 16.66%.
Projects with airdrop ratio less than 15%: 76 projects, with a 7-day average increase of 8.31% and a 30-day average increase of 3.36%.
Projects with lock-up mechanisms: 10 projects, with a 7-day average decline of -16.68% and a 30-day average decline of -43.73%.
Data indicates that projects with a larger airdrop ratio perform more stably in the short term, while projects with stronger lock-up mechanisms perform below expectations, exhibiting greater price volatility.
VI. Exchange Selection and Project Performance
The choice of different exchanges for listing can have varying impacts on the market. To better understand the overall performance of projects listed on major exchanges, Lao Dong compiled data from several key exchanges, including the number of listings, price fluctuations, and the impact of FDV liquidity. This helps to understand project performance across different exchanges, enabling more informed investment decisions.
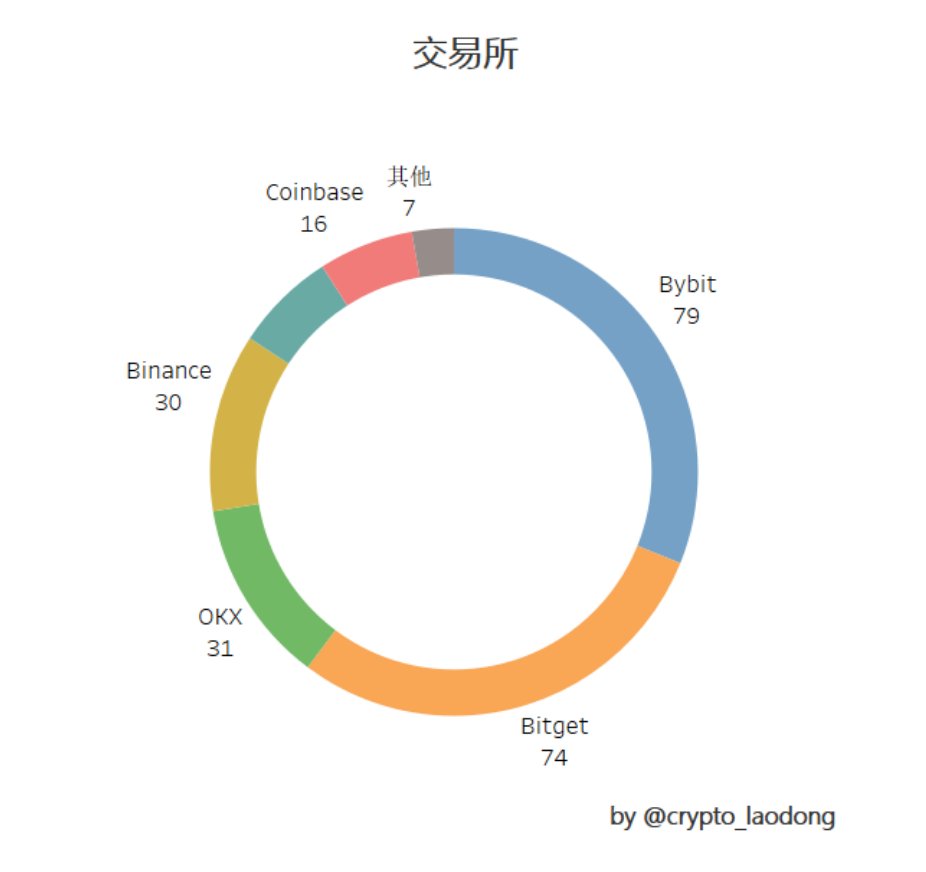
Binance: 30 projects listed, 7-day price fluctuation -0.02%, 12 projects increased (40%), 30-day price fluctuation -4.57%, 12 projects increased (40%).
OKX: 31 projects listed, 7-day price fluctuation -13.06%, 7 projects increased (22.58%), 30-day price fluctuation -18.75%, 10 projects increased (32.26%).
Bybit: 79 projects listed, 7-day price fluctuation +2.27%, 29 projects increased (36.7%), 30-day price fluctuation -4.65%, 28 projects increased (35.44%).
Bitget: 74 projects listed, 7-day price fluctuation +6.57%, 26 projects increased (35.14%), 30-day price fluctuation +3.3%, 28 projects increased (37.84%).
Coinbase: 16 projects listed, 7-day price fluctuation -3.68%, 3 projects increased (18.75%), 30-day price fluctuation +26.64%, 6 projects increased (37.5%).
Upbit: 17 projects listed, 7-day price fluctuation -5.05%, 3 projects increased (17.65%), 30-day price fluctuation +2.94%, 9 projects increased (52.94%).
In terms of the number of listings, Coinbase and Upbit have fewer listed projects, indicating a tendency to cautiously select projects, focusing more on long-term stability and compliance, avoiding those still in experimental stages or high-risk projects. Bybit and Bitget, on the other hand, list more projects and are more aggressive, focusing on attracting users and expanding market share through frequent new listings. This strategy helps them rapidly expand in the market and attract significant trading volume and liquidity.
Regarding short-term project prices:
Bitget and Bybit performed well over 7 and 30 days, especially Bitget, which had positive increases in both periods and a high proportion of increasing projects.
Coinbase performed notably well, especially with a 30-day increase of +26.64%, with a significant number of projects increasing (37.5%).
OKX and Binance both showed certain declines over the past 30 days, particularly OKX, which experienced a significant drop of about -18.75%.
Upbit showed some recovery over 30 days, with an increase of +2.94% and 52.94% of projects increasing, performing well.
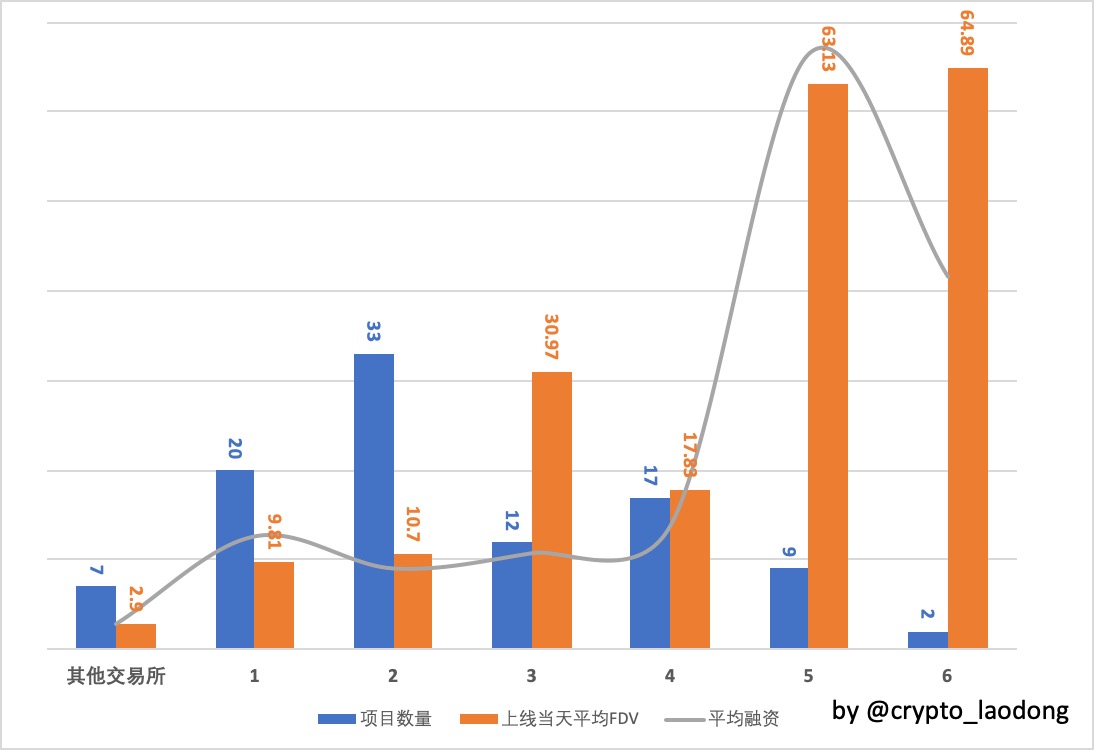
Other exchanges: 7 projects, average funding $6.5 million, average FDV on the day $290 million.
Listed on 1 exchange: 20 projects, average funding $28.86 million, average FDV on the day $981 million.
Listed on 2 exchanges: 33 projects, average funding $20.68 million, average FDV on the day $1.07 billion.
Listed on 3 exchanges: 12 projects, average funding $24.57 million, average FDV on the day $3.097 billion.
Listed on 4 exchanges: 17 projects, average funding $31.67 million, average FDV on the day $1.783 billion.
Listed on 5 exchanges: 9 projects, average funding $152.15 million, average FDV on the day $6.313 billion.
Listed on 6 exchanges: 2 projects, average funding $95.20 million, average FDV on the day $6.489 billion.
As the number of exchanges a project is listed on increases, the average funding amount and FDV on the day of listing significantly rise, indicating higher market recognition, better liquidity, and enhanced risk resistance, which can attract more investors.
免责声明:本文章仅代表作者个人观点,不代表本平台的立场和观点。本文章仅供信息分享,不构成对任何人的任何投资建议。用户与作者之间的任何争议,与本平台无关。如网页中刊载的文章或图片涉及侵权,请提供相关的权利证明和身份证明发送邮件到support@aicoin.com,本平台相关工作人员将会进行核查。


