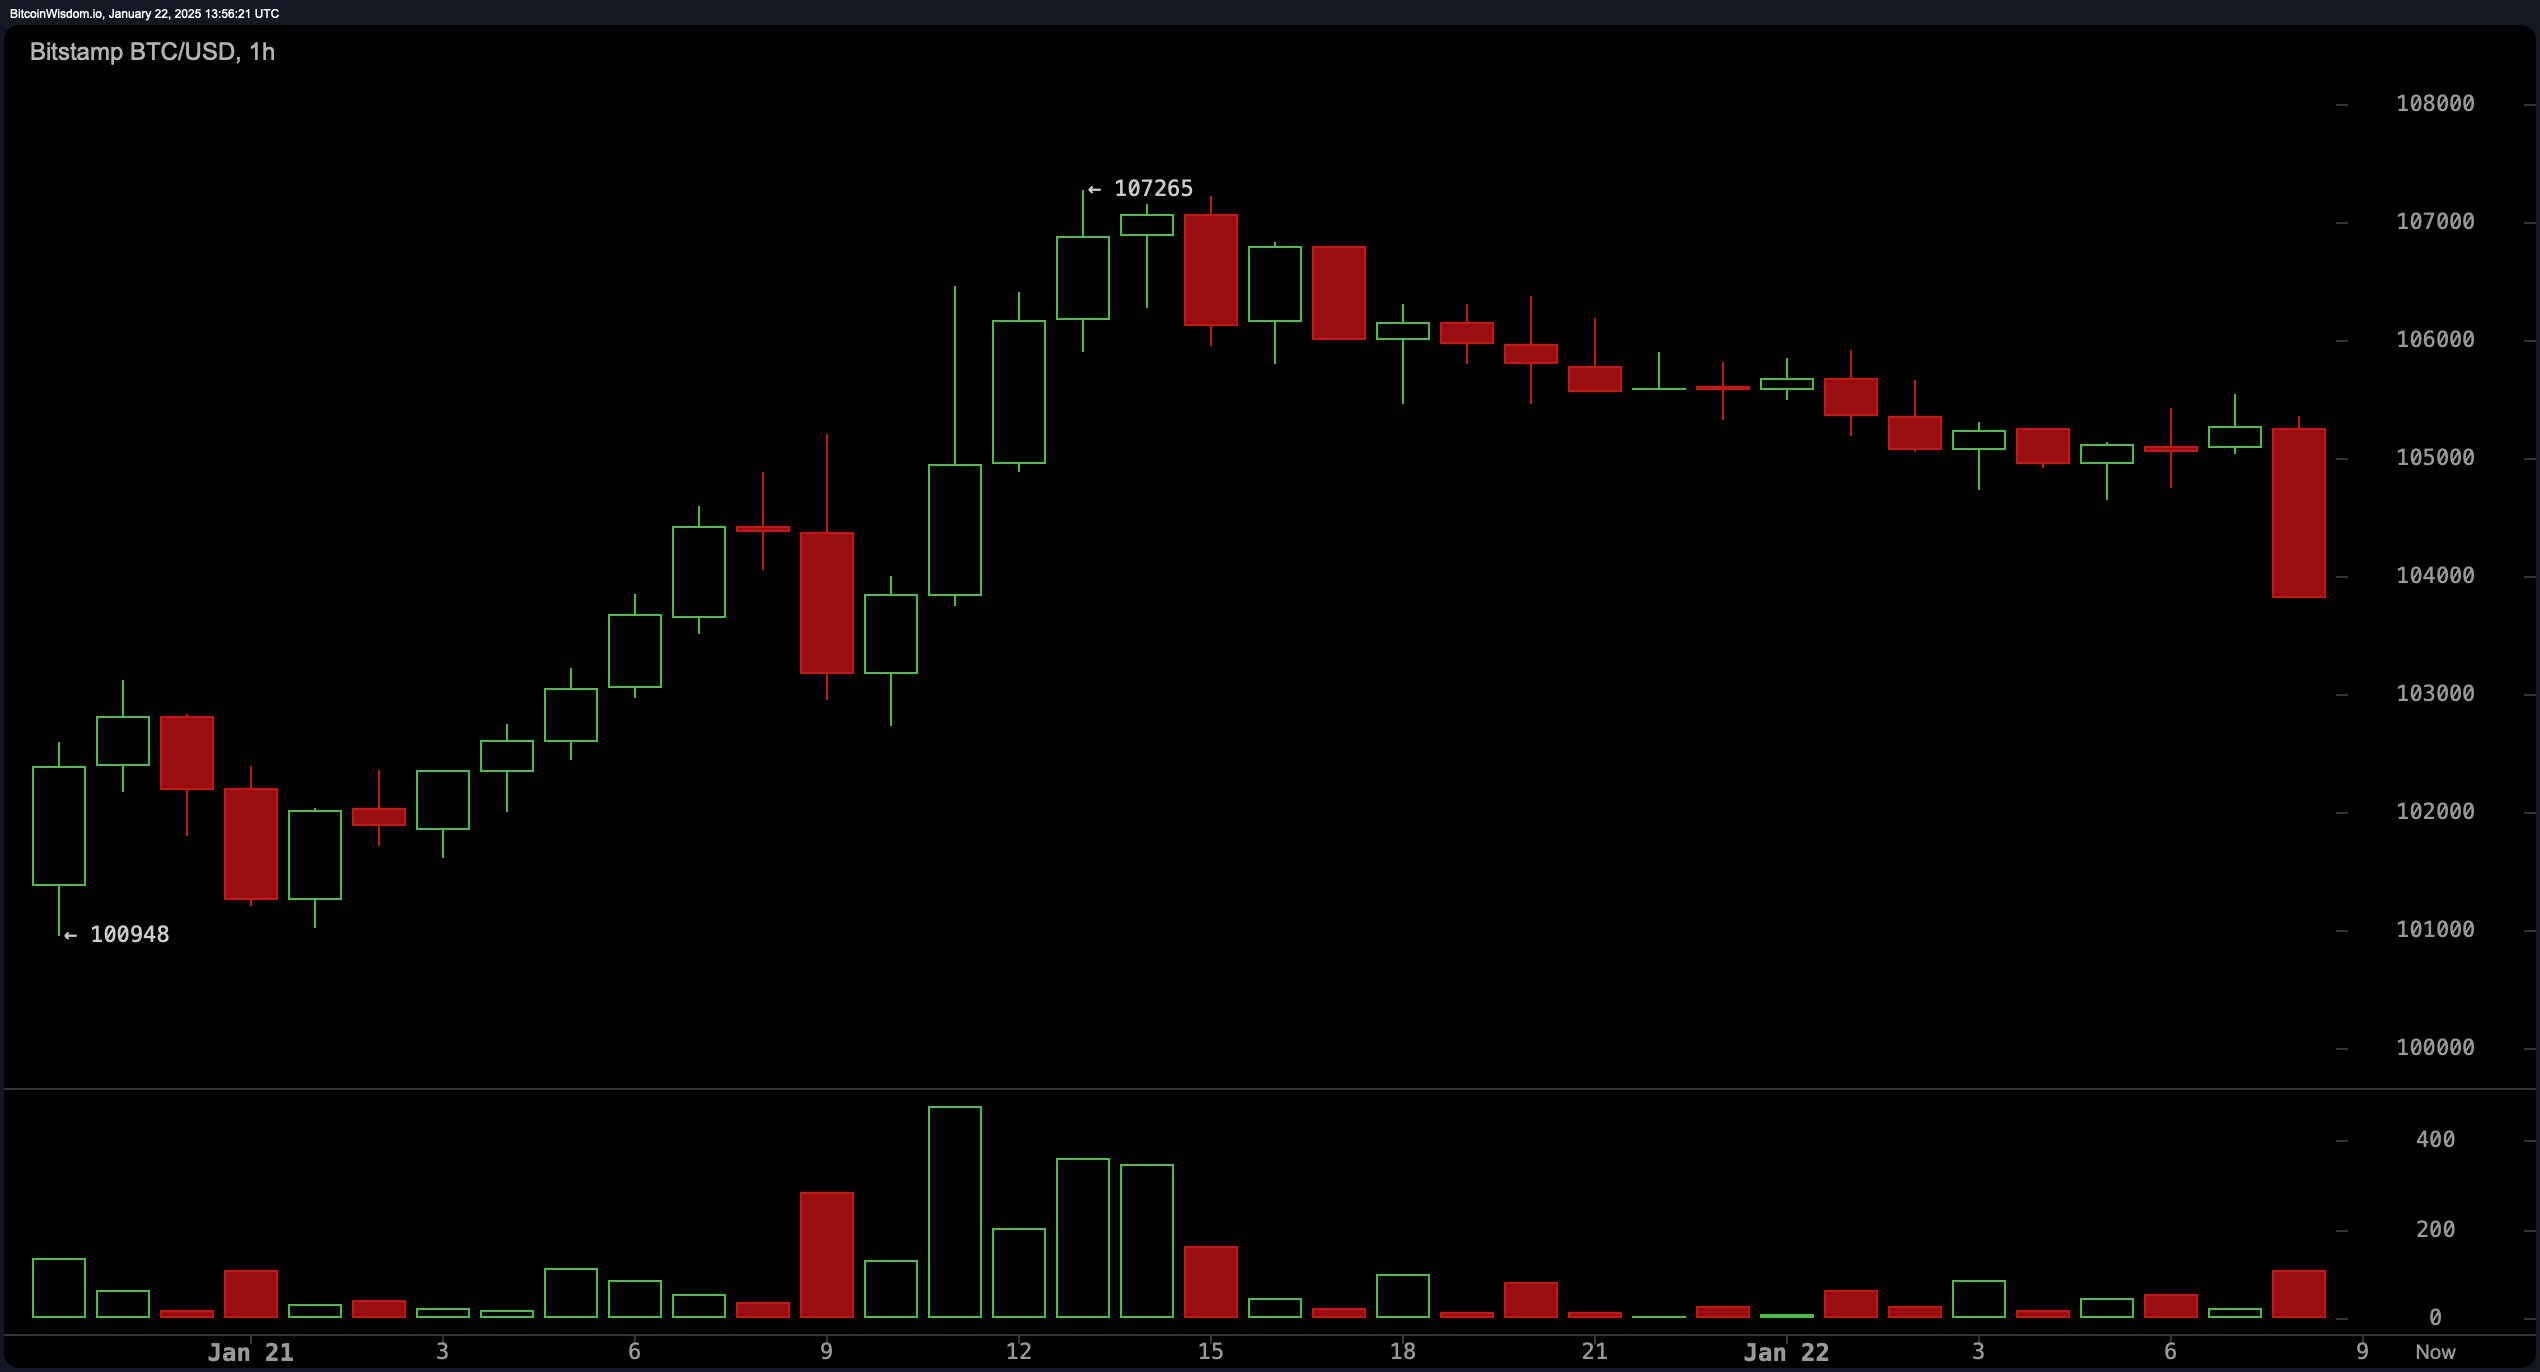
Bitcoin‘s one-hour chart shows a bearish pullback dominating the short-term trend following a rally to $107,265, with immediate support at $103,500 and resistance at $105,000 to $106,000. Volume analysis indicates declining sell pressure, suggesting a potential short-term exhaustion of bearish momentum. A break below $103,500 could lead to a further downside toward $100,000, while holding this level with a bullish pattern may provide a scalping opportunity targeting $105,500.

BTC/USD 1H chart via Bitstamp on Jan. 22, 2025.
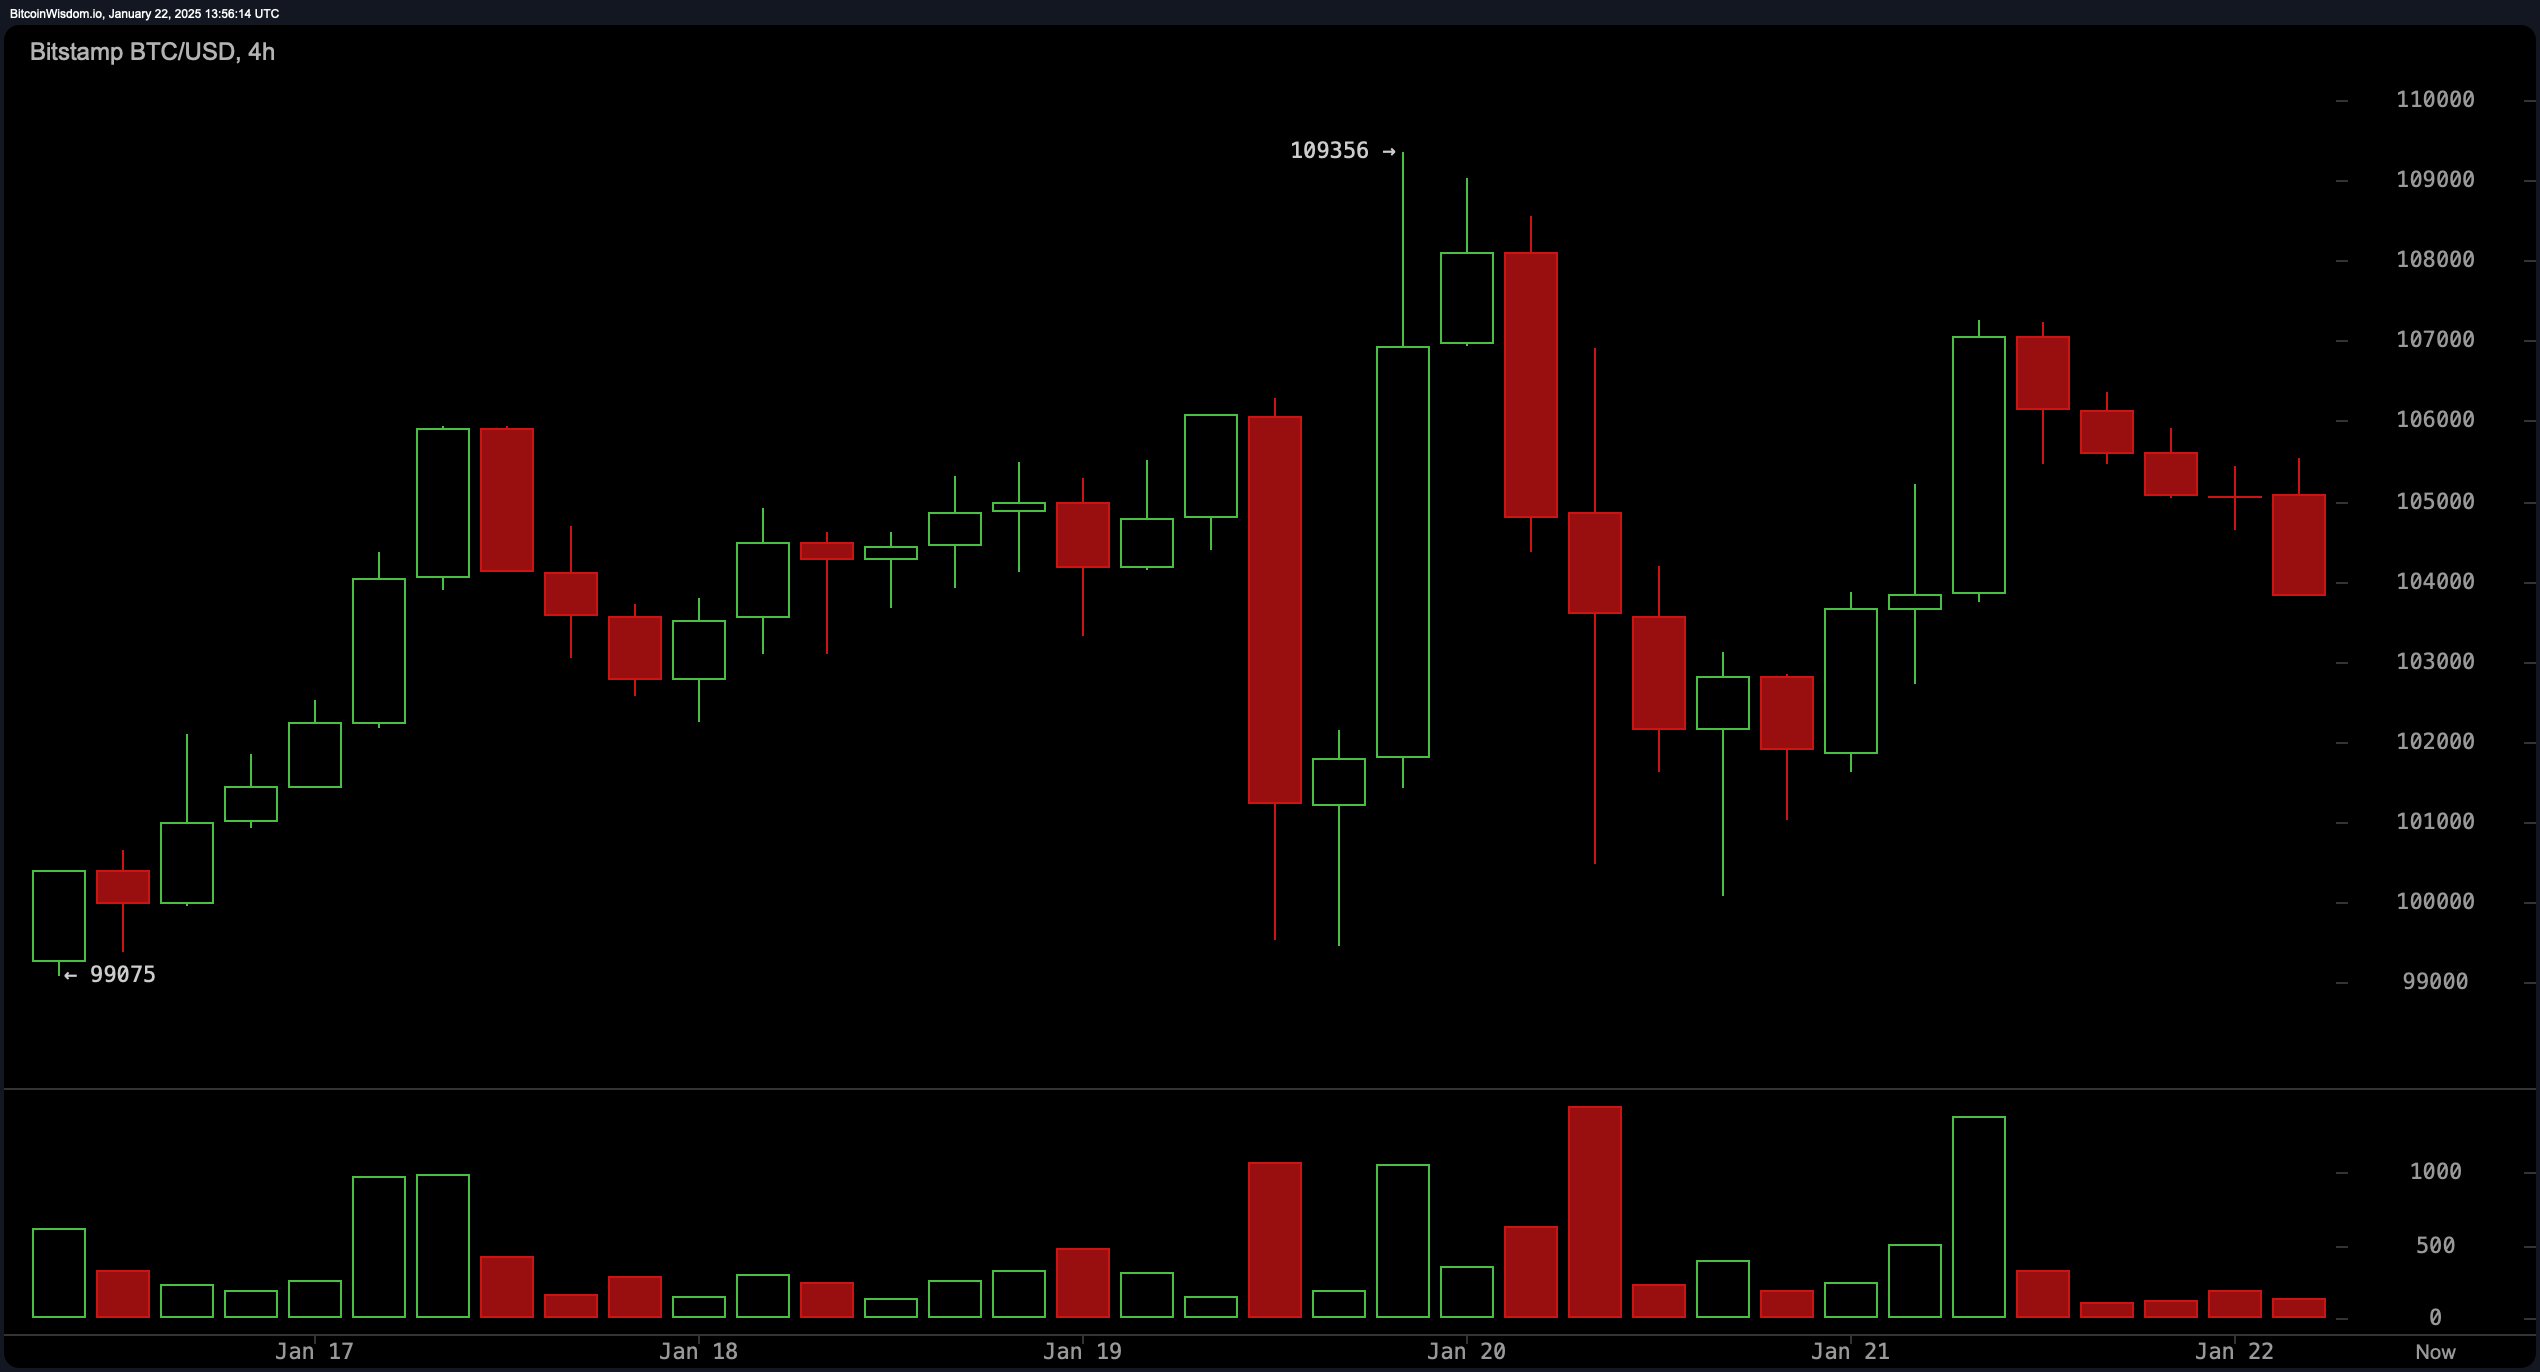
The four-hour chart highlights a retracement after peaking at $109,356, with support near $103,000 to $104,000 and resistance at $107,000. High sell volumes around recent highs imply distribution, but declining sell volume near support could indicate a reversal. A price hold above $103,000 with bullish candlesticks may support a short-term buy, while a breakdown below this level could target $100,000.

BTC/USD 4H chart via Bitstamp on Jan. 22, 2025.
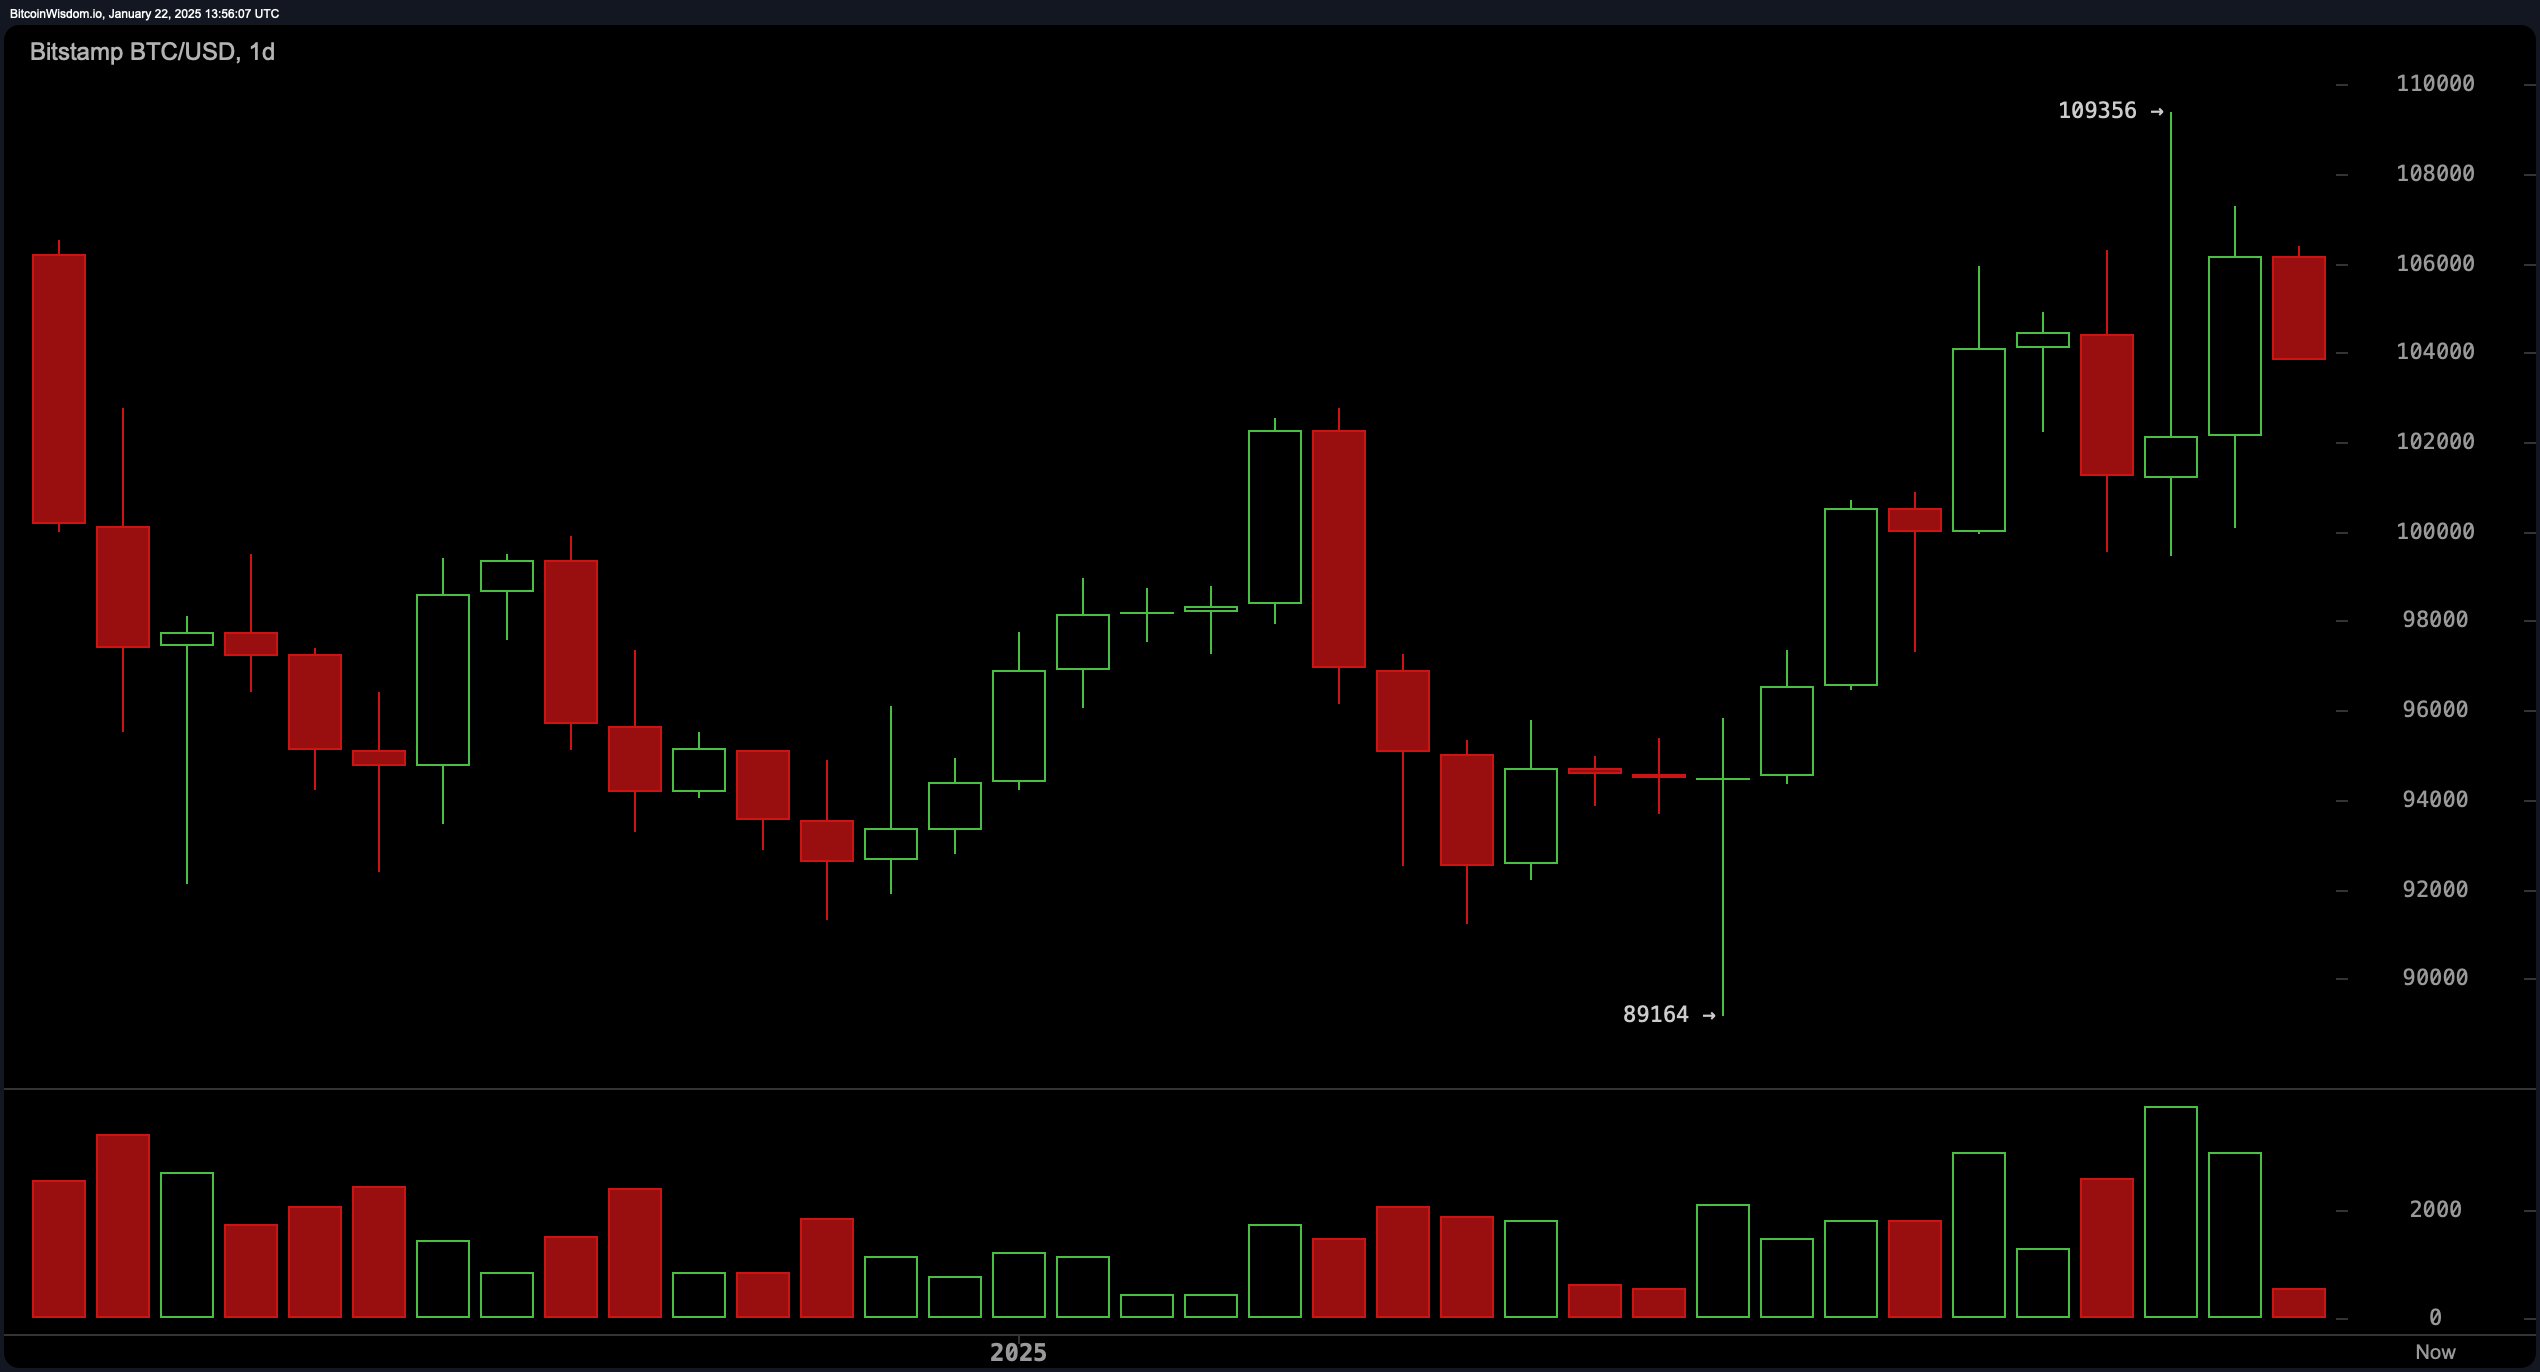
The daily chart reflects a moderate recovery trend, followed by a retracement at resistance around $109,000 to $110,000, with support levels between $98,000 and $100,000. Volume spikes near these levels highlight significant trader interest, though overall declining momentum warrants caution. Traders could consider entering near $100,000 if buying volume strengthens or exiting around $109,000 if resistance holds.

BTC/USD 1D chart via Bitstamp on Jan. 22, 2025.
Oscillators and moving averages reinforce a mixed outlook, with the relative strength index (RSI) neutral at 60 and stochastic %K neutral at 74. The moving average convergence divergence (MACD) signals a buy at 1,990, while the momentum indicator at 9,549 points to selling pressure. Exponential and simple moving averages across all key periods from 10 to 200 are aligned in a buy position, reflecting a broader bullish sentiment.
Bull Verdict:
Bitcoin’s price action suggests that bullish momentum could prevail if critical support levels such as $103,500 and $100,000 hold. A sustained price above $103,000 on shorter timeframes, combined with strengthening buy volume and positive signals from moving averages, may create opportunities for upward movement toward $105,500 or even a retest of the $109,000–$110,000 resistance zone. Traders looking for long positions could capitalize on these levels, provided risk management is prioritized.
If bitcoin breaks below $103,500 and selling pressure accelerates, the price could decline toward $100,000 or even lower. Indicators of waning momentum, such as the momentum oscillator and volume analysis, suggest a potential vulnerability in the short term. A failure to hold above key support zones, coupled with bearish formations, may invite further downside, making short positions viable for traders prepared to navigate high volatility.
免责声明:本文章仅代表作者个人观点,不代表本平台的立场和观点。本文章仅供信息分享,不构成对任何人的任何投资建议。用户与作者之间的任何争议,与本平台无关。如网页中刊载的文章或图片涉及侵权,请提供相关的权利证明和身份证明发送邮件到support@aicoin.com,本平台相关工作人员将会进行核查。


