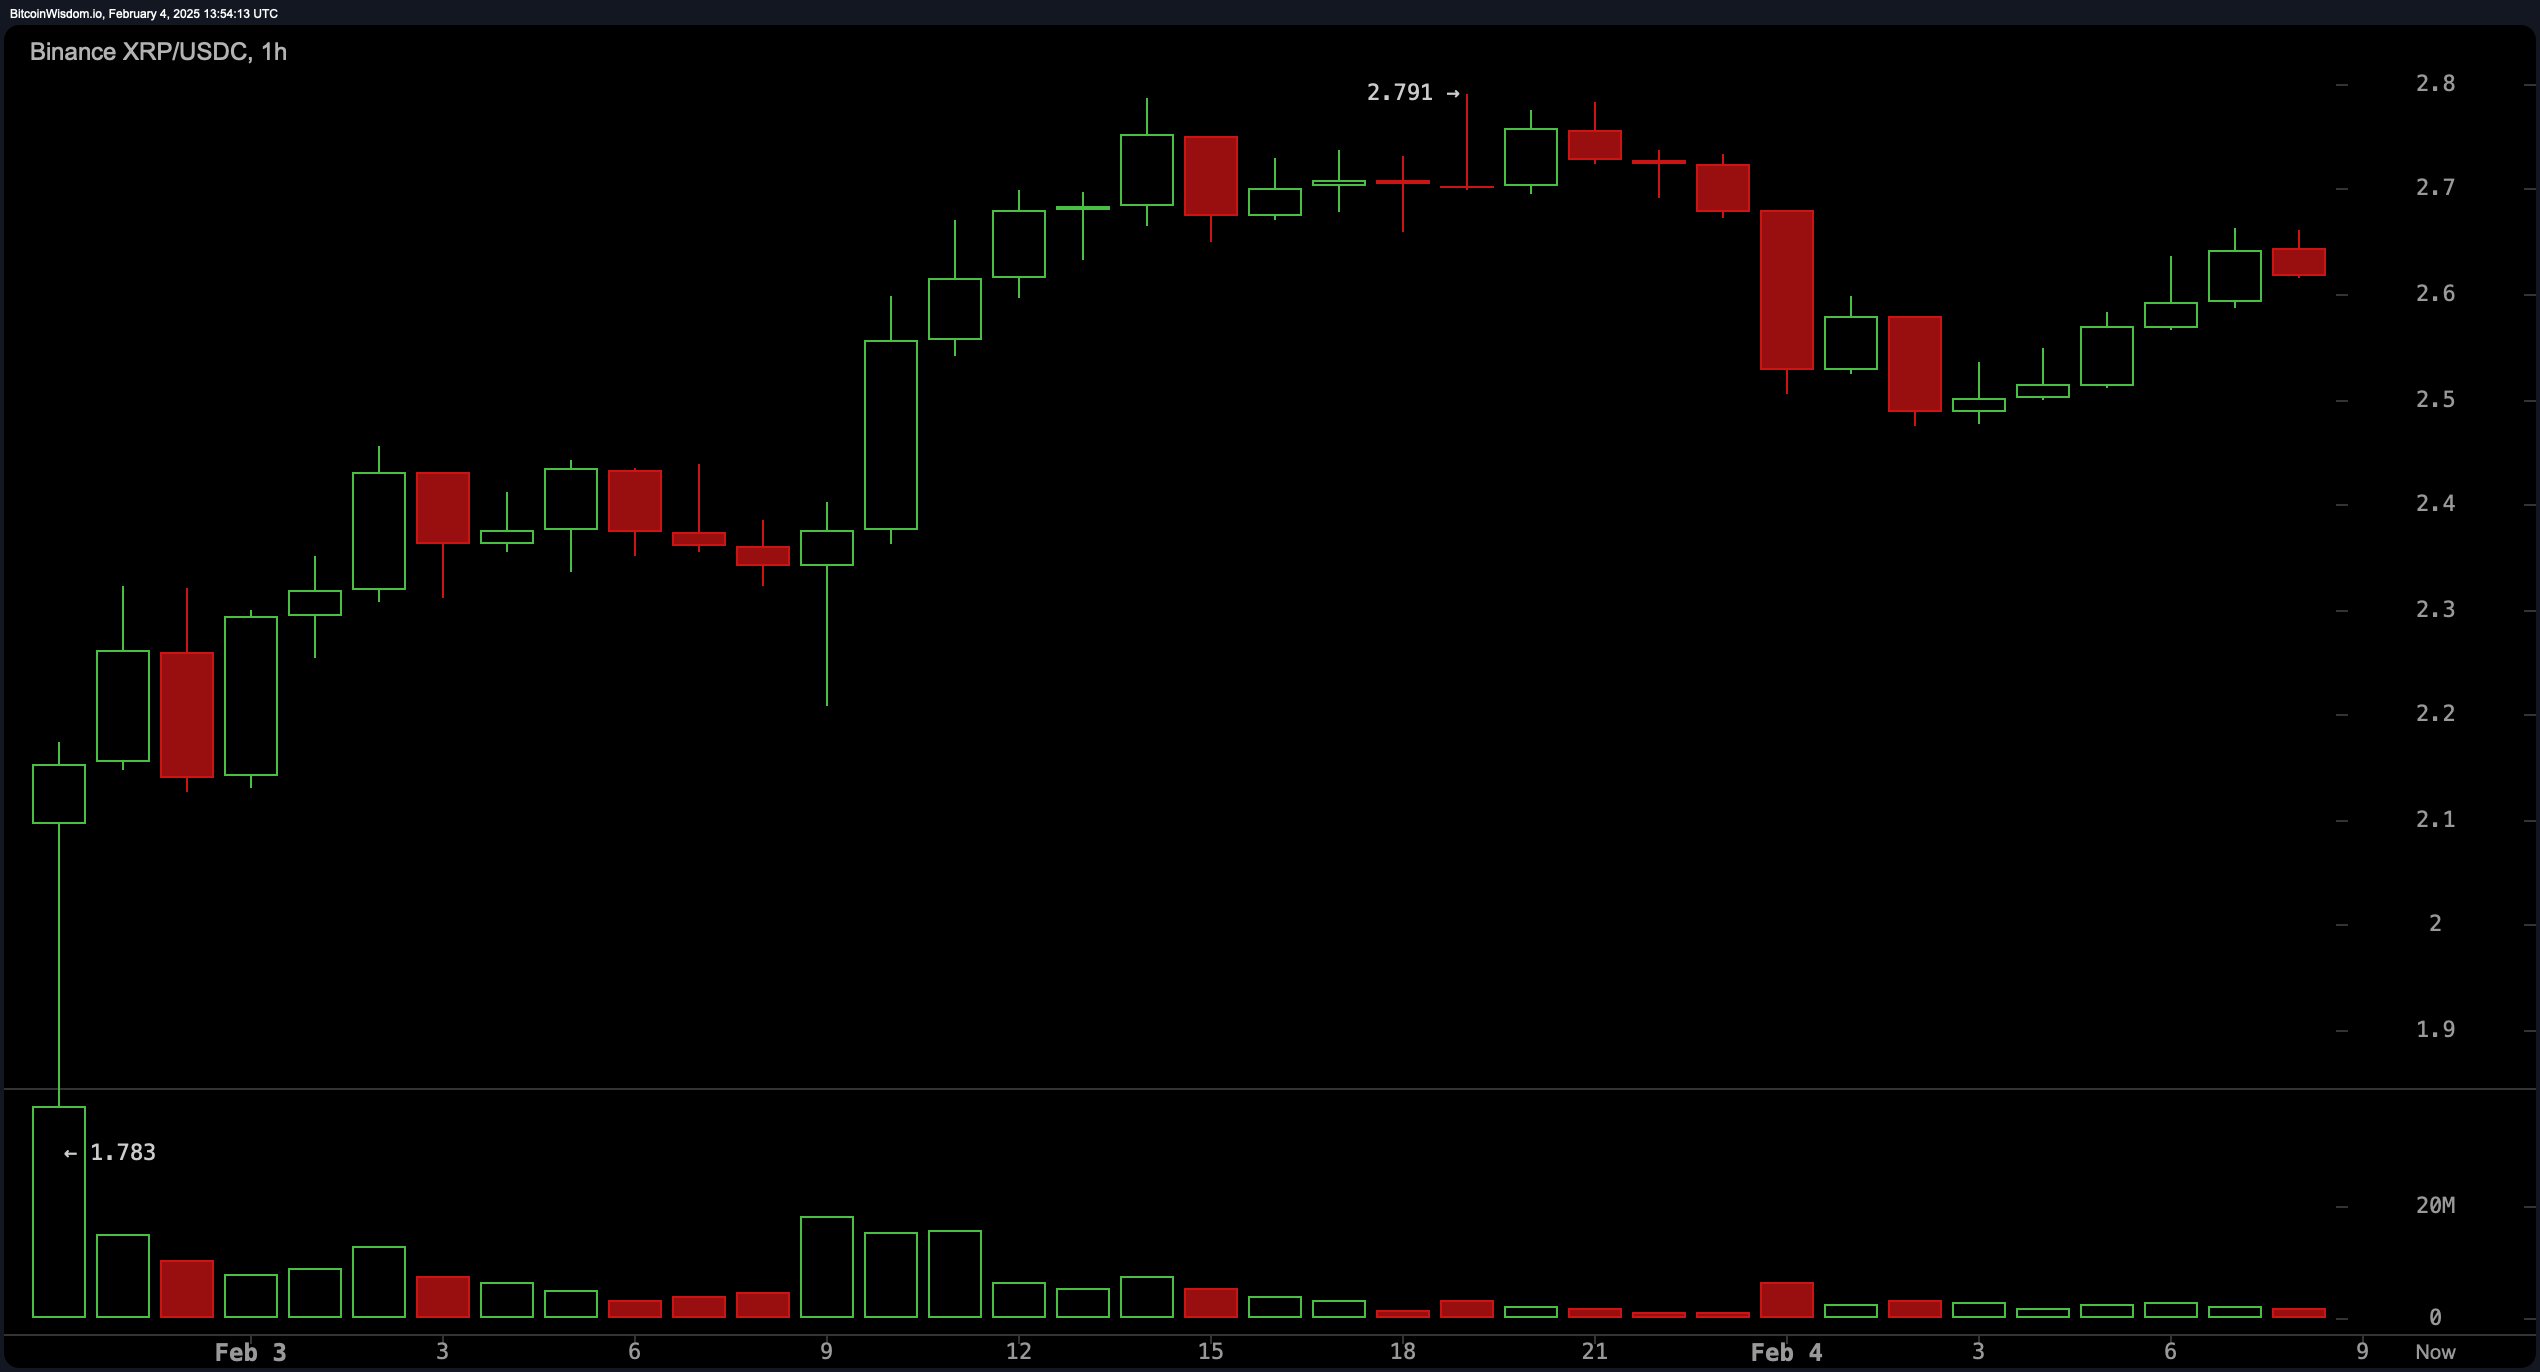
The one-hour chart indicates that XRP has rebounded sharply following a significant drop, with support between $2.50 and $2.60 and resistance between $2.80 and $2.90. Buying pressure is beginning to wane, suggesting a possible period of consolidation or a pullback before the next move. Volume has tapered off from its earlier peak, meaning a short-term entry could be viable if the price holds above $2.60 with rising volume, while resistance at $2.80 to $2.90 presents a likely short-term exit.

XRP/USDC 1H chart via Binance on Feb. 4, 2025.
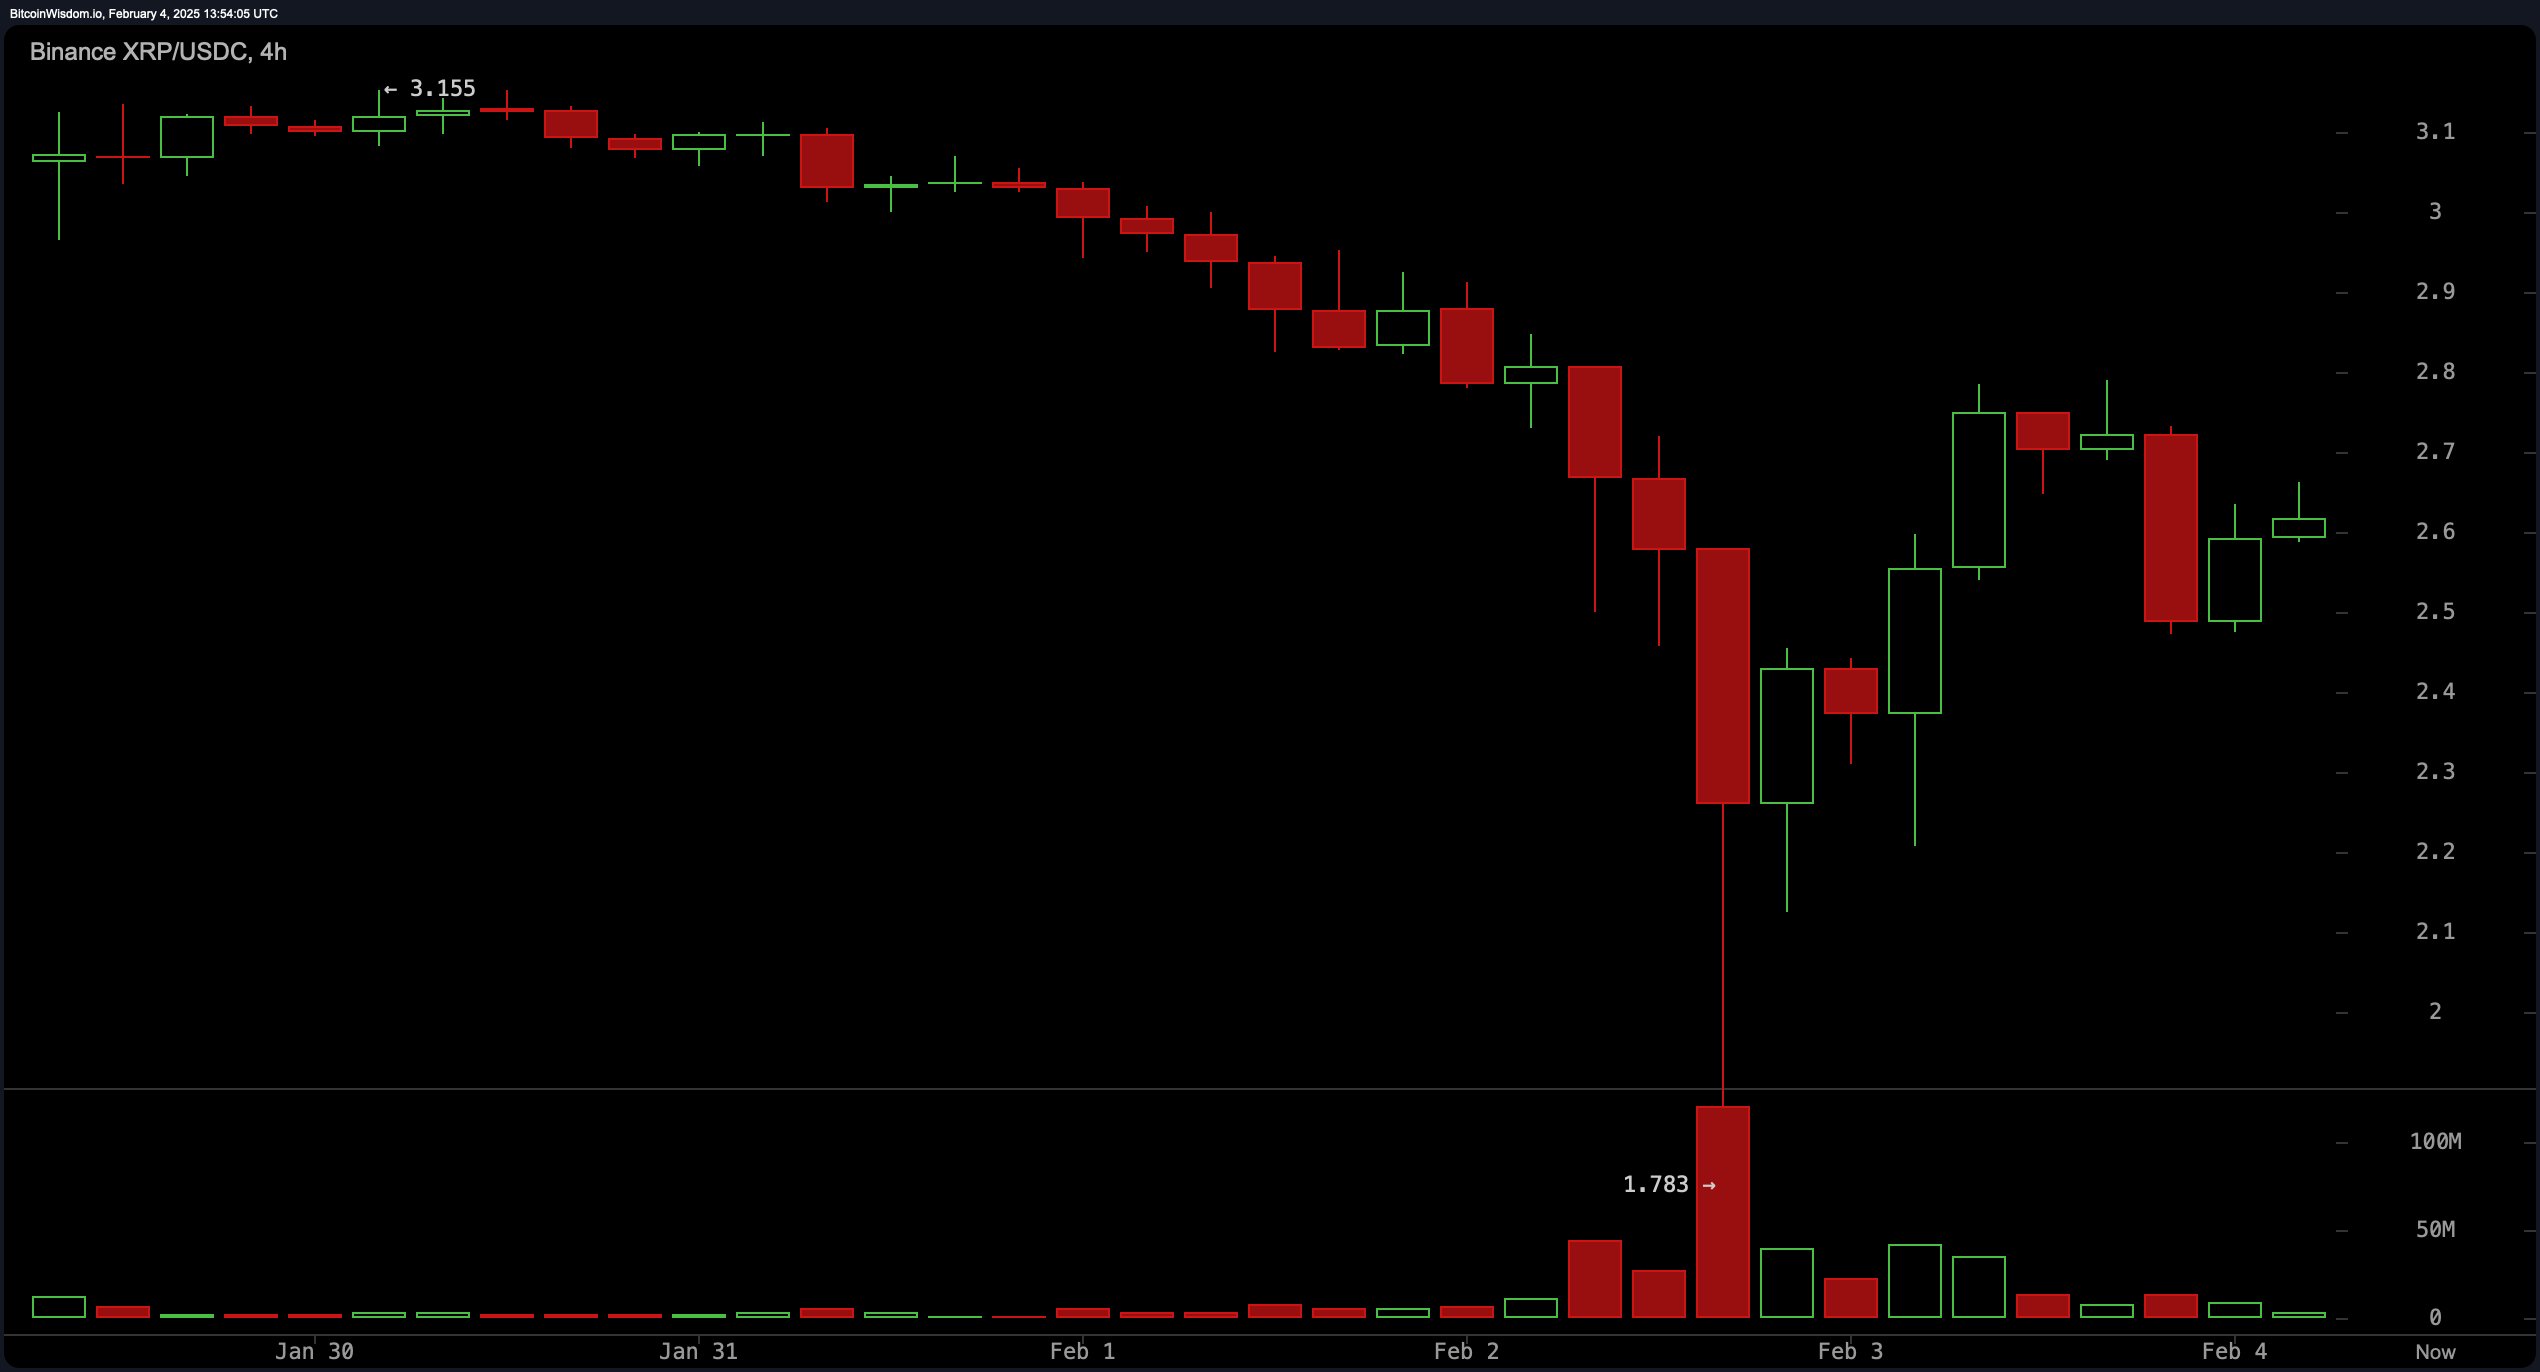
The four-hour chart presents a broader perspective of the recent downtrend from $3.15, followed by a strong recovery from the $1.78 low, forming a pattern of higher lows that suggests a possible reversal. Increased buying volume between $2.30 and $2.50 indicates accumulation at these levels. Should XRP maintain its position above $2.50 to $2.60, it could signal a strong entry point for a long position, whereas difficulty breaking through resistance between $2.80 and $3.00 may present an opportunity to take profits.

XRP/USDC 4H chart via Binance on Feb. 4, 2025.
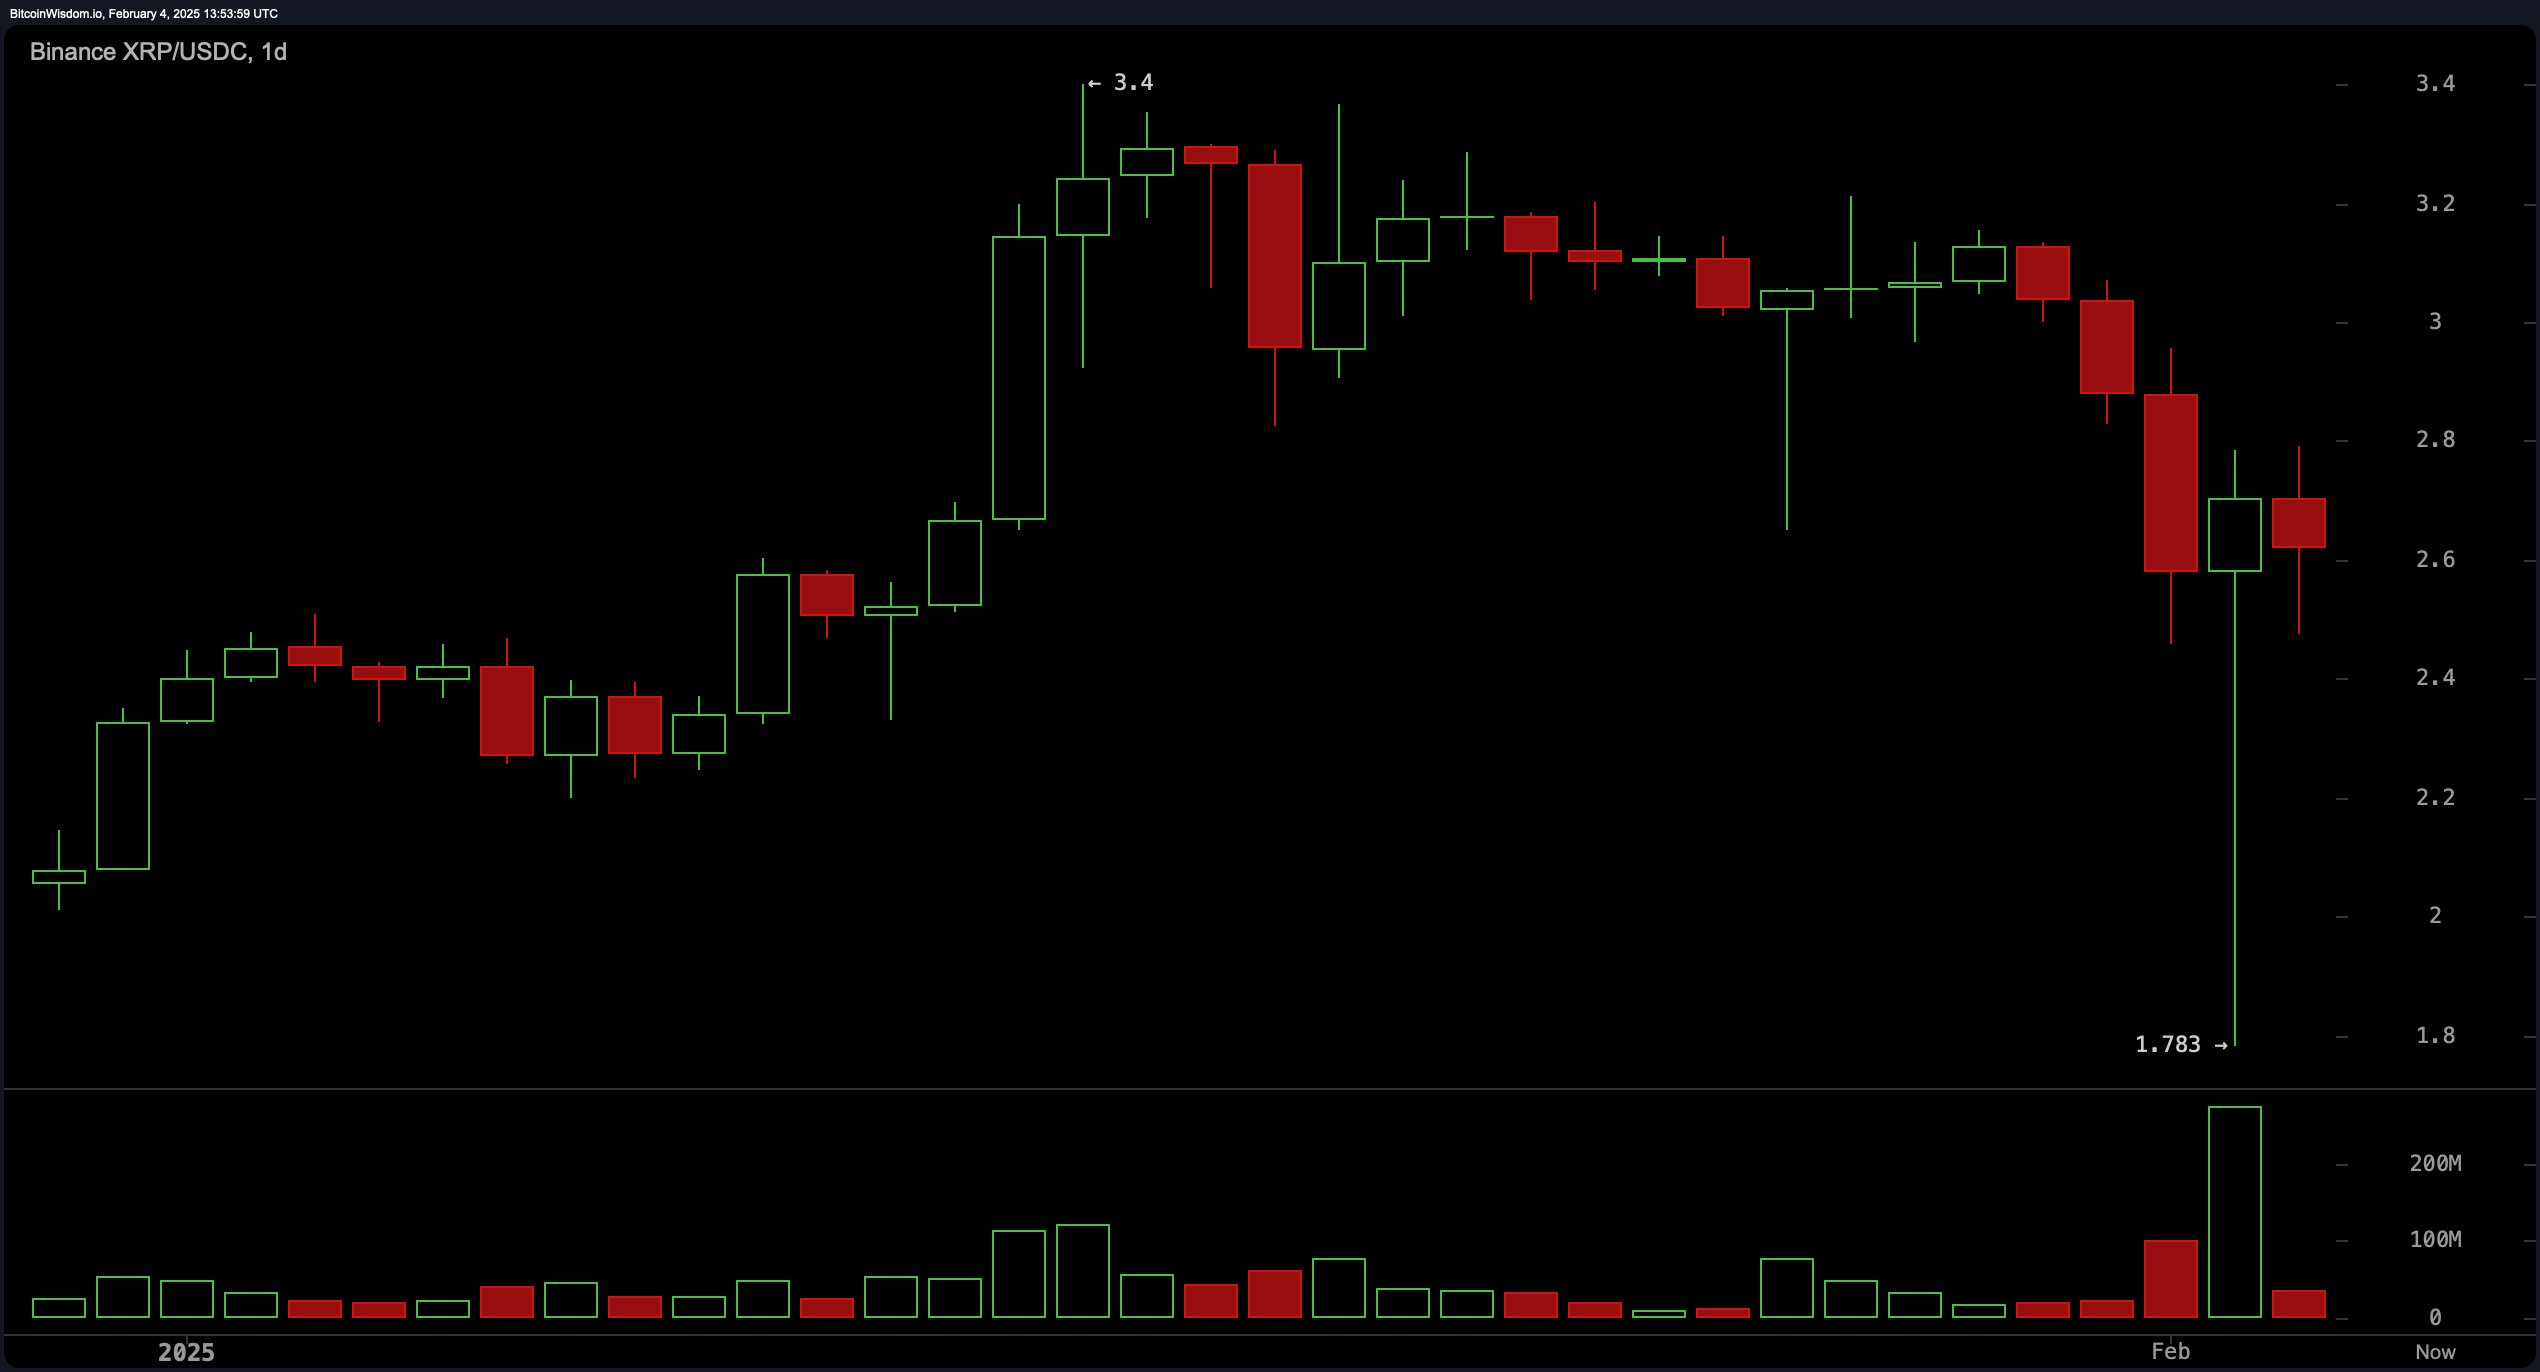
The daily chart reflects a volatile market with a strong uptrend reaching $3.40 before experiencing a steep decline, ultimately finding support at $1.78. Current price action shows an effort to stabilize between $2.60 and $2.70, with resistance identified near $3.00 to $3.40. A break above this level would confirm a bullish continuation, whereas failure to hold above $2.50 could lead to another test of lower support. A potential entry point exists around $2.50 to $2.60 if buying momentum strengthens.

XRP/USDC 1D chart via Binance on Feb. 4, 2025.
Among oscillators, the relative strength index (RSI) stands at 42.09, indicating neutral conditions, while the Stochastic oscillator at 44.09 also signals neutrality. The commodity channel index (CCI) at -167.11 suggests a buying opportunity, whereas the awesome oscillator at -0.05481, momentum at -0.47162, and moving average convergence divergence (MACD) level at 0.02924 all indicate selling pressure. The average directional index (ADX) at 24.35 suggests a weak trend, requiring additional confirmation for a definitive market direction.
Moving averages (MAs) confirm bearish momentum in the short term, with the exponential moving average (EMA) and simple moving average (SMA) for 10, 20, and 30 periods all signaling a sell. However, the 50, 100, and 200-period EMAs and SMAs indicate a buy, suggesting long-term support remains intact. A break above key resistance levels would strengthen bullish sentiment, while failure to hold current support could trigger further downside movement.
Bull Verdict:
XRP’s ability to maintain support above $2.50, along with signs of accumulation in the four-hour chart and long-term moving averages signaling buy opportunities, suggests a bullish continuation. If buying volume increases and resistance at $3.00 is broken, XRP could reclaim higher levels and push toward $3.40 or beyond.
Bear Verdict:
The presence of selling pressure across key oscillators, alongside short-term moving averages signaling a downtrend, suggests XRP may struggle to sustain its recent gains. If the price fails to hold above $2.50 and volume remains weak, a retest of lower support around $2.20 or even $1.78 is possible before any significant recovery.
免责声明:本文章仅代表作者个人观点,不代表本平台的立场和观点。本文章仅供信息分享,不构成对任何人的任何投资建议。用户与作者之间的任何争议,与本平台无关。如网页中刊载的文章或图片涉及侵权,请提供相关的权利证明和身份证明发送邮件到support@aicoin.com,本平台相关工作人员将会进行核查。


