
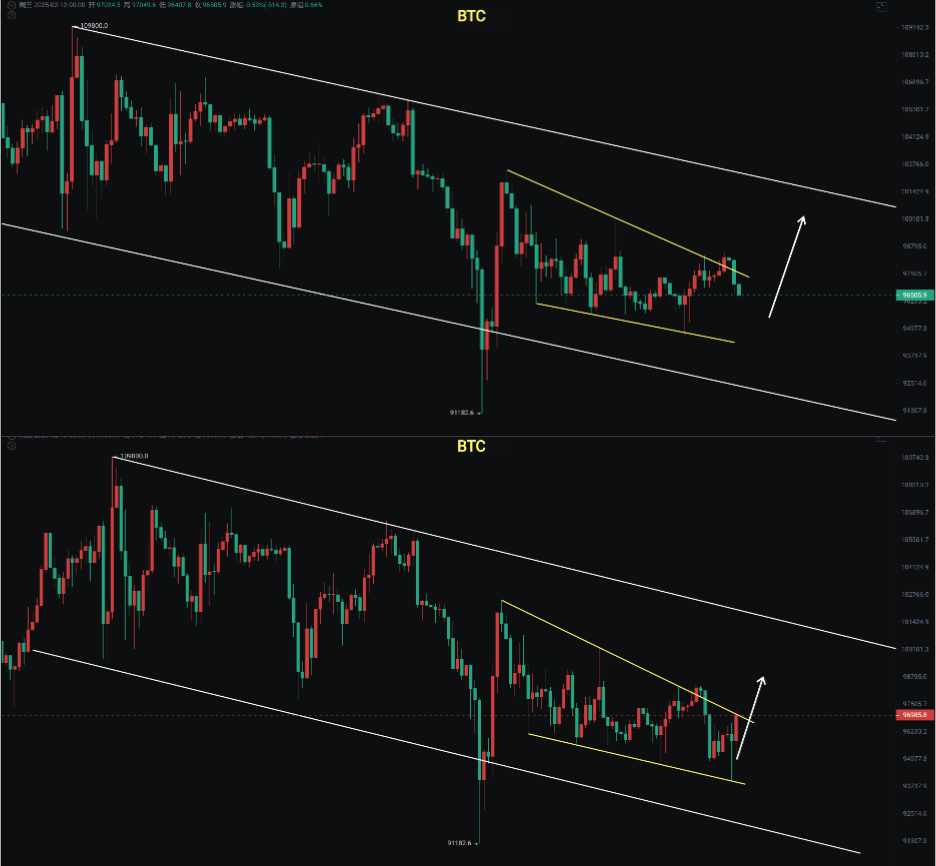
Bitcoin has been oscillating narrowly for 9 days, with the K-line pressure at 99100 remaining unbroken, and it continues to create lower lows. In the short term, Bitcoin has support around 95500, which is also testing the Fibonacci 0.236 support line. If this line can hold, we expect a rebound to 102456 before continuing to decline. If it cannot hold, it may drop to the 92500—93700 range. Ethereum broke through the 4-hour channel during the day and continued to decline.
The three major U.S. stock indices opened lower. We previously reminded about the shark pattern followed by a descending channel for the Dow Jones. The Nasdaq and S&P 500 have been oscillating at high levels. During this period, Bitcoin has largely followed the movements of the U.S. stock market. The understanding king will hold a press conference regarding reciprocal tariffs at 2 AM Beijing time tomorrow, so pay attention to the specific market movements.
Bitcoin
Bitcoin has been continuously oscillating with weak rebound strength, and this situation still poses risks that cannot be eliminated. Currently, there is a clear divergence between bulls and bears in the market. The prince has always believed there is a chance for an upward rebound before continuing to decline. The 3-day and weekly MACD are crossing downward at the zero axis. The daily chart shows continuous oscillation, with high points consistently decreasing and low points continuously creating lower lows. Given the spike on February 3rd at the ten thousand mark, we still hope for a spike that leads to a second rebound, which would be ideal. If it directly breaks down in one go, it would directly lead to a "gray rhino." If the rebound cannot break through 100k—102456, we will look for a correction.
Support: Resistance:
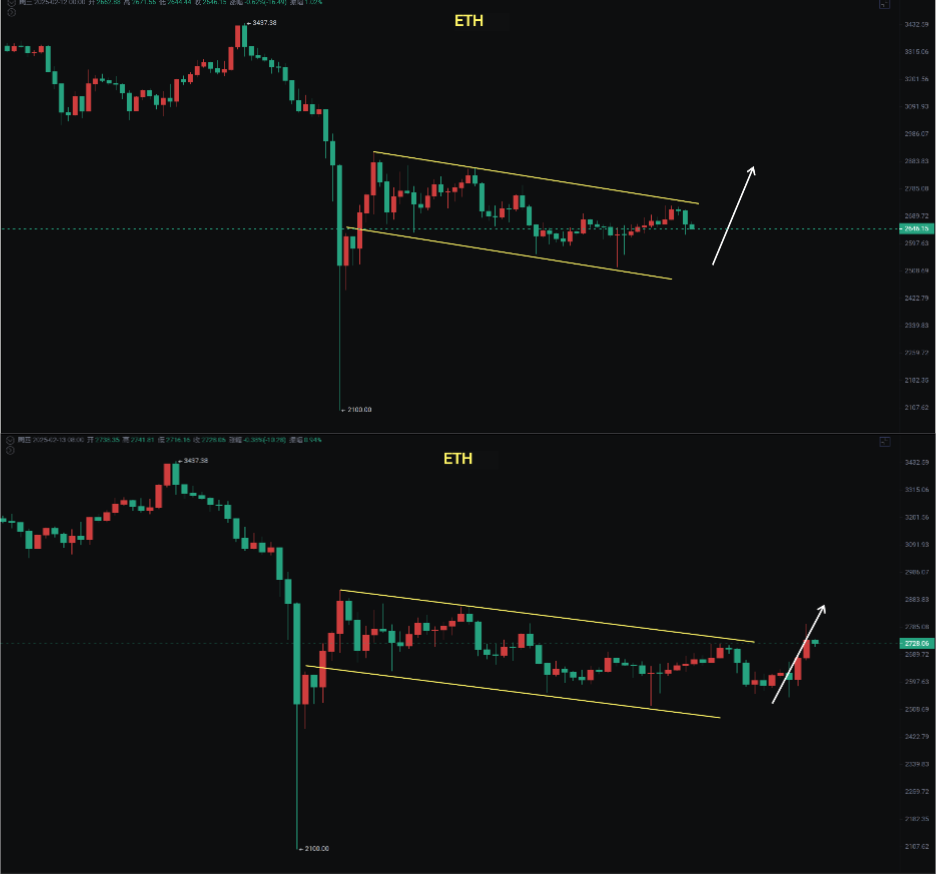
Ethereum
Ethereum itself is also in a weak position, maintaining a descending channel on the 4-hour chart. After breaking through during the day, it continued to decline. As long as it holds the spike from the previous two days at 2520, there is still a chance for a rebound. The weekly chart has broken below 2800, which is the bull-bear boundary for Ethereum. We can only look at the box oscillation on the weekly chart. The daily chart shows resistance for the rebound at 2800—2920—3300. If these resistance levels cannot be broken, further corrections are expected.
Support: Resistance:
If you like my views, please like, comment, and share. Let's navigate through the bull and bear markets together!!!
This article is time-sensitive and for reference only, with real-time updates.
Focusing on K-line technical research, sharing global investment opportunities. Public account: Trading Prince Fusu

免责声明:本文章仅代表作者个人观点,不代表本平台的立场和观点。本文章仅供信息分享,不构成对任何人的任何投资建议。用户与作者之间的任何争议,与本平台无关。如网页中刊载的文章或图片涉及侵权,请提供相关的权利证明和身份证明发送邮件到support@aicoin.com,本平台相关工作人员将会进行核查。


