Bitcoin whales are secretly positioning themselves; is it a prelude to a surge or a battle between bulls and bears? A deep dive into three key signals~
1. $5.1 Billion Mysterious Bet: Are Whales Awakening or "Bullish on the Surface, Bearish Underneath"?
On February 19, Bitfinex saw a staggering $5.1 billion in leveraged long positions for Bitcoin, reaching a three-month high! This amount is equivalent to 54,595 BTC, enough to purchase half of El Salvador's GDP. Normally, a surge in leveraged longs tends to drive up Bitcoin prices. However, the actual situation for BTC has been a lack of new breakthroughs, with prices showing a strange divergence from capital inflows, revealing two major secrets:
- Ultra-low borrowing rates: Bitfinex whales are borrowing BTC at nearly zero cost, compared to a 10% financing rate for perpetual contracts, creating a perfect "spot arbitrage" opportunity—buying low in the spot market and selling high in the futures market to secure profit margins.
- Complete hedging strategy: The surge in long positions without a corresponding price increase suggests that large funds may be using ETFs or derivatives for reverse hedging, appearing bullish on the surface while secretly locking in risks.
Key Conclusion: This is not merely a bull market rally; it is a sophisticated operation by institutional funds taking advantage of interest rate differentials. As Jan3 CEO Samson Mow stated, "When buy orders are multiples of sell orders, yet prices are stuck in a range, there is only one possibility—manipulated precision balance."
2. Bitcoin ETF Outflows: Are Whales Really Running Away?
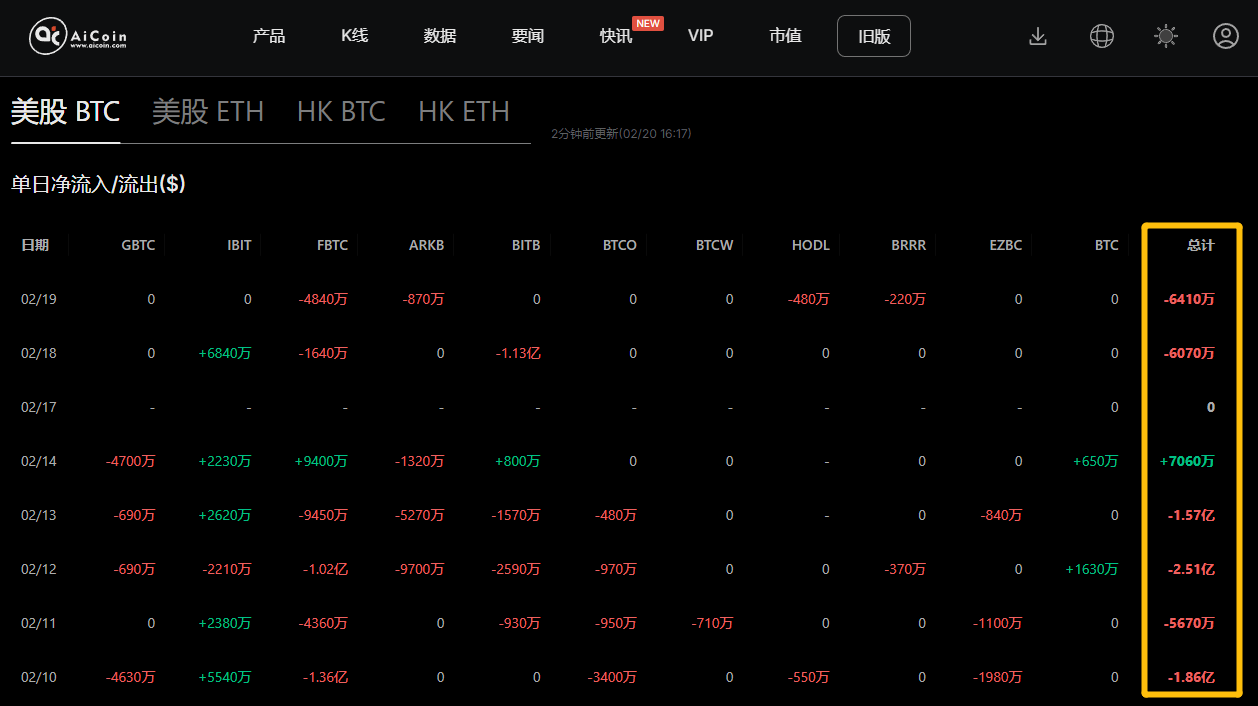
In addition to Bitfinex's leverage data, we also need to examine ETF fund flows. The fact is, since February, Bitcoin ETFs have seen over $500 million in outflows, particularly a net outflow of $408 million from February 12 to 13, while the Coinbase BTC premium index has turned negative, indicating that institutional funds are withdrawing from the market.

Track ETF data: https://www.aicoin.com/web3-etf?lang=en
Additionally, there are two major undercurrents suppressing Bitcoin from breaking the $100,000 mark:
- FTX Selling Pressure: $1.2 billion in creditor compensation settled at a cost price of $20,000, meaning that if buyers choose to take profits, it equates to releasing 6,000 BTC into the market daily.
- Meme Coin Drain: Political concept coins like TRUMP and LIBRA have diverted a significant amount of market liquidity, restricting the upward momentum of BTC.
Does this mean whales are starting to flee? Not necessarily. CryptoQuant data shows that while ETF funds are flowing out, the over-the-counter (OTC) market is quietly accumulating; in just the past week, OTC trading addresses have bought over 28,000 BTC (approximately $2.6 billion). This indicates that some big players may not have fully exited but are shifting to the OTC market to avoid public market price fluctuations.
3. Macroeconomic Background: Federal Reserve Minutes Release Uncertainty
In addition to internal data from the crypto market, the macro environment is also a crucial factor determining BTC's trajectory. The Federal Reserve minutes released in the early hours of February 20 mentioned risks of rising inflation and uncertainties in economic growth, prompting market investors to seek safe-haven assets.
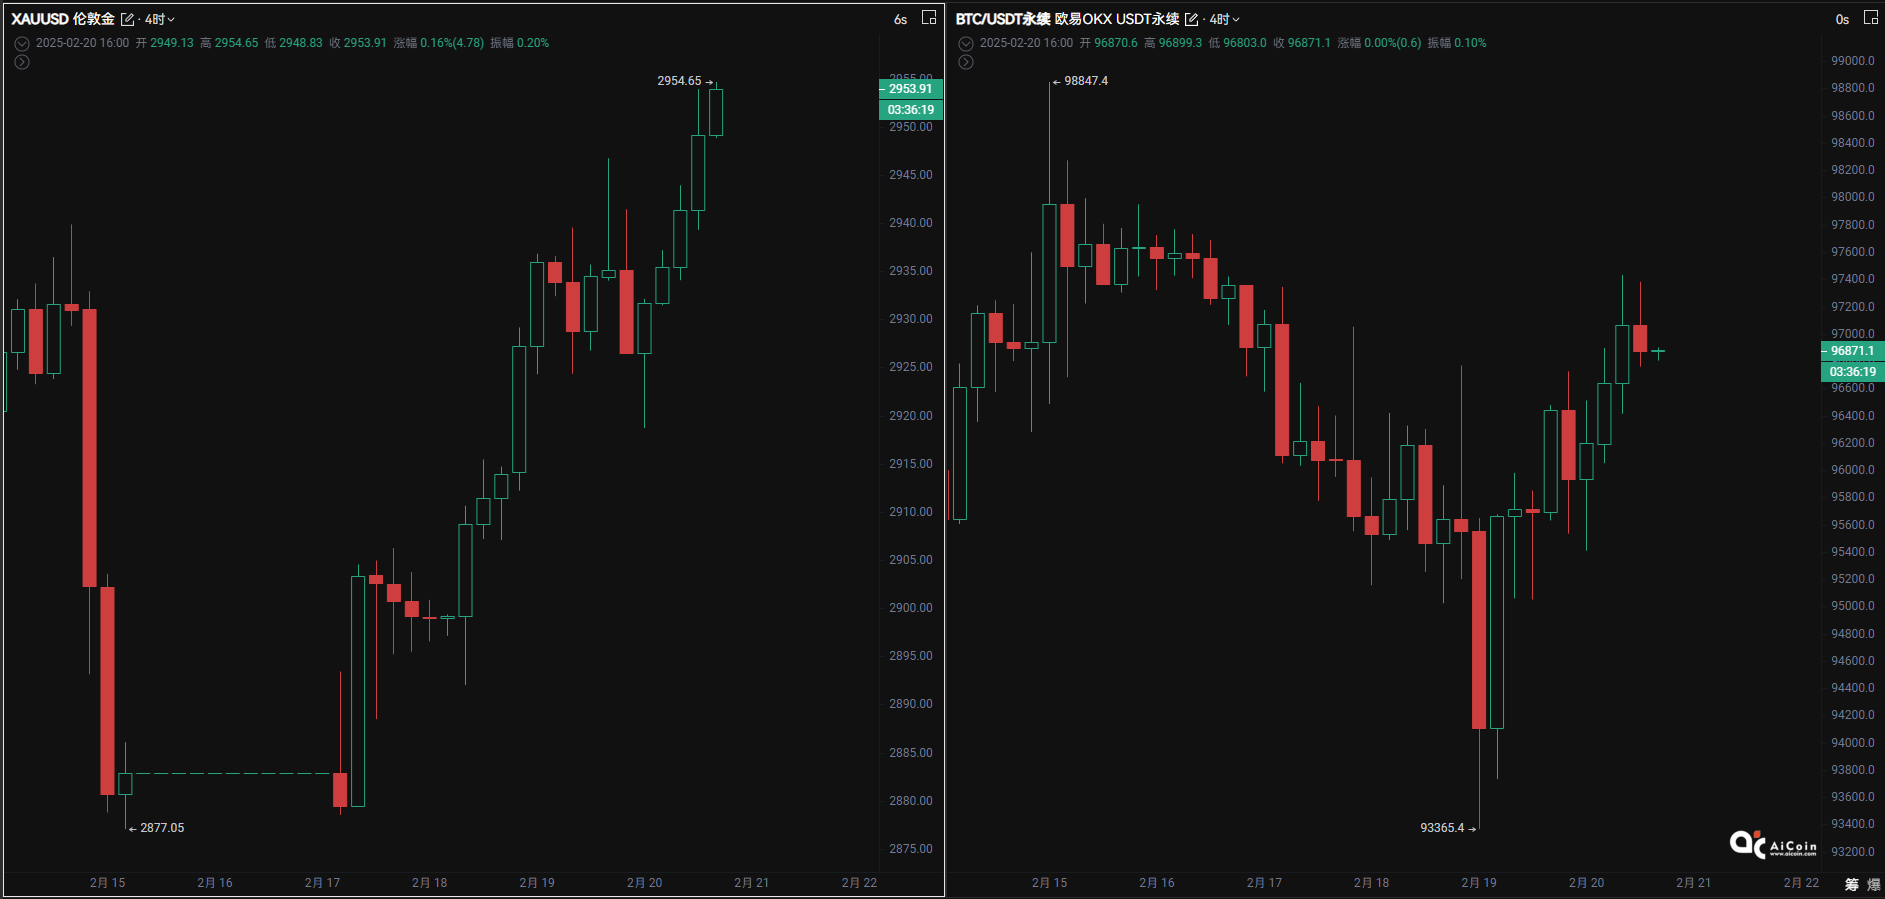
As a result, the price of gold in London broke through $2,930. What about Bitcoin? Although many consider BTC to be digital gold, it is still largely viewed as a risk asset, leading to relatively subdued price movements.

However, it is worth noting that sovereign wealth funds like Abu Dhabi's Mubadala are increasing their BTC holdings, indicating that institutions still see long-term potential in BTC as a global hedge asset.
4. Life-and-Death Turning Point Warning: Short-term Washout May Be Needed
BTC is currently at a critical game stage on the daily chart, with technical indicators showing:
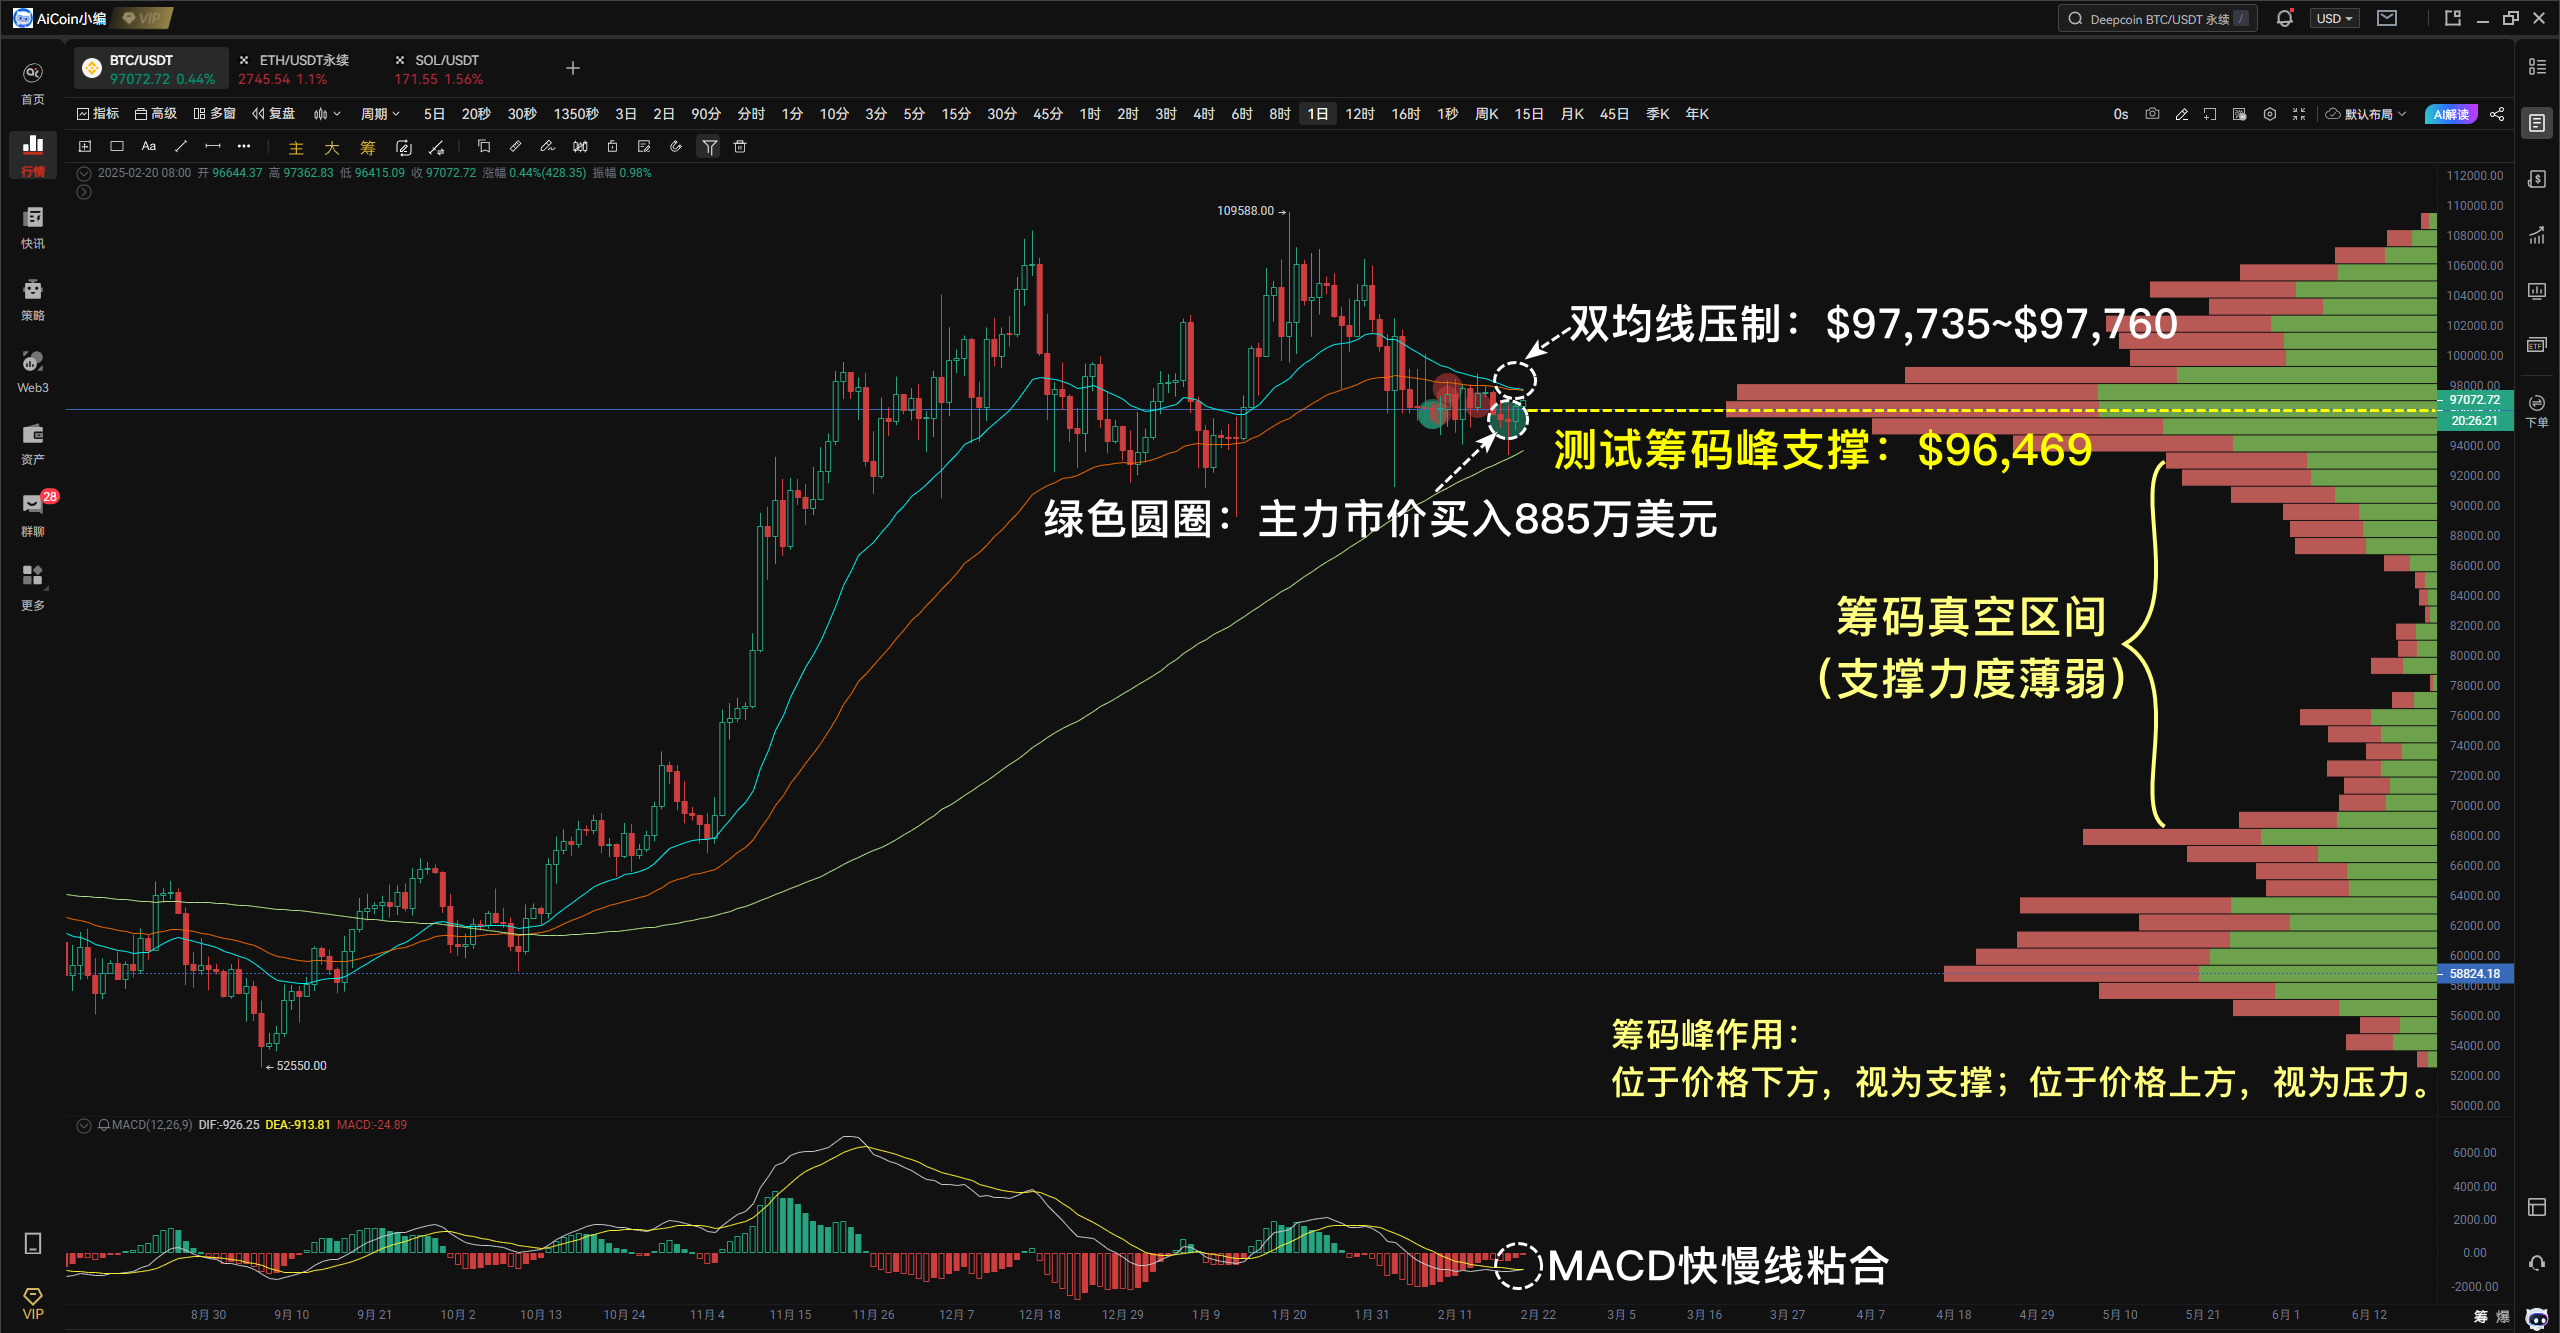
- Testing the key support of the critical chip peak from the past six months, with a vacuum area below and weak support strength, view chips now>>
- The EMA24 and EMA52 dual moving averages are forming short-term resistance
- The MACD fast and slow lines are converging below the zero axis, with trend momentum building up

More critically, there are a large number of long liquidation orders concentrated below $92,000; if BTC breaks this key support, it could trigger a wave of forced liquidations, causing prices to briefly dip below $90,000.
Therefore, in the short term, if it cannot break through and stabilize above $97,000, Bitcoin may need another round of emotional washing, and it could even dip below $90,000, creating final panic in the market. The $92,000 to $96,000 range remains the main battleground for bulls and bears; if it falls below $88,000, it will trigger panic selling.
- Support: $96,469; breaking this will retest $94,000, even $92,000
- Resistance: $97,735 to $97,760; breaking this could push towards $98,500
Retail Survival Guide:
- Follow large orders (Tool: Major Order Tracking, focus on long-term large orders);
- Dollar-cost averaging strategy is better than going all in (Tool: AI Grid, automatically buy low and sell high, but be sure to set stop-loss and take-profit, using a mobile grid is recommended).
Recommended Reading:
“Market Price Dump or Limit Price Conspiracy? Unveiling the Truth Behind BTC's Major Manipulation”
“Chip Distribution—A PRO Tool to Increase Winning Odds”
“Nanny-Level Tutorial, Quickly Understand the AI Grid Tool”
Bold Conclusion: Any price suppression is a paper tiger. Remember, bull markets are born in skepticism, die in euphoria, and are reborn in despair. Now, at which point in time do you stand?
The above content is for sharing only and does not constitute any investment advice. If you have questions, you can join the 【PRO CLUB】 group to contact the editor~
Please recognize AiCoin's official website: www.aicoin.com
免责声明:本文章仅代表作者个人观点,不代表本平台的立场和观点。本文章仅供信息分享,不构成对任何人的任何投资建议。用户与作者之间的任何争议,与本平台无关。如网页中刊载的文章或图片涉及侵权,请提供相关的权利证明和身份证明发送邮件到support@aicoin.com,本平台相关工作人员将会进行核查。


