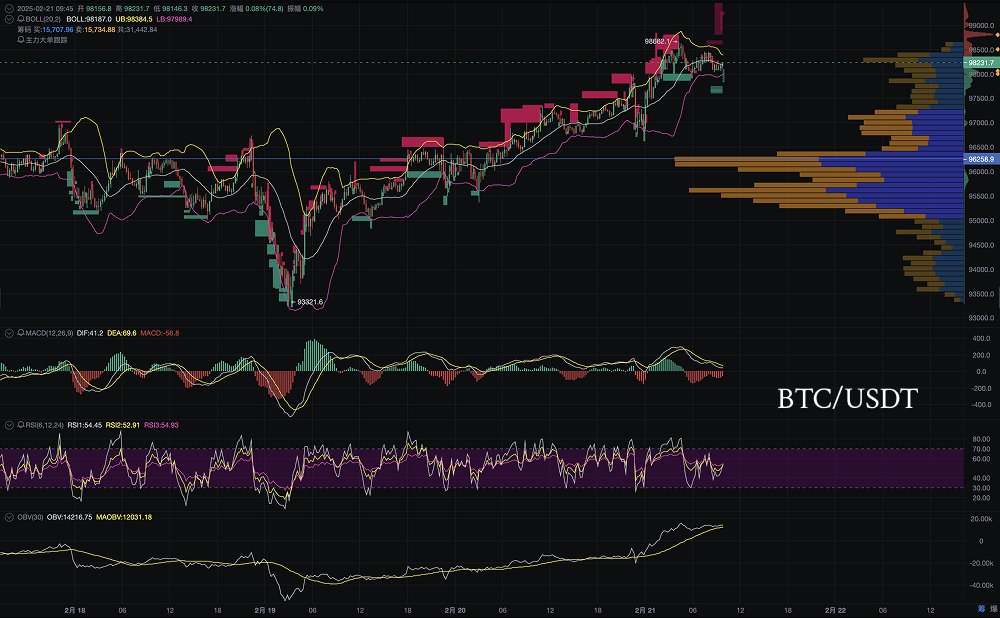
Bitcoin (BTC) continued its high-level volatility today, repeatedly consolidating around the $98,000 mark. Although the overall market sentiment remains optimistic, there is significant selling pressure above, making a short-term breakout challenging. The technical analysis indicates that the $97,000-$98,500 range may become a key battleground for the day. If it falls below $97,000, Bitcoin may enter a correction phase, testing the $96,300-$95,000 area; if it breaks above $98,500, it could challenge the $99,000-$100,000 levels.

Bitcoin High-Level Consolidation, Bulls and Bears in Stalemate
As of today, Bitcoin's price is oscillating around $98,000, failing to effectively break the $98,500 resistance level in the short term, while the $97,000 support remains solid. The market is experiencing intense bull-bear battles, and the short-term direction still needs further confirmation.
- Heavy selling pressure above: A large number of sell orders have appeared in the $98,000-$98,500 range, indicating that short-term bulls are taking profits in this area. If it cannot break through, it may face correction pressure.
- Support remains below: The $97,000-$97,500 area is a recent accumulation zone, providing some support in the market. A break below this could trigger further adjustments.
Technical Analysis: Bearish Oscillation, Beware of Correction Risks
From a technical perspective, Bitcoin's short-term trend still holds considerable uncertainty, but some signals indicate that bearish forces are gradually strengthening.
Bollinger Bands (BOLL): Oscillating Convergence, Possible Breakthrough
Currently, Bitcoin's price is near the middle band of the Bollinger Bands (97,967.9), with the short-term direction still unclear. If the price falls below the middle band, it may enter a correction mode, testing the $97,000-$96,300 support area; if it breaks above the upper band (98,415.7), it may continue to challenge $99,000-$100,000.
MACD: Bears in Control, Momentum Declining
The MACD fast line (DIF) has fallen below the slow line (DEA), forming a death cross, indicating a bearish short-term trend. At the same time, the red bars are shortening and turning green, indicating a weakening upward momentum and strengthening bearish forces. If the green bars further expand, the correction pressure will increase.
RSI: Short-Term Weakness, Market Sentiment Cautious
The short-term RSI indicator is at 39.11, close to the weak zone, reflecting insufficient bullish strength in the market. If the RSI falls below 35, it may enter the oversold zone, allowing for greater short-term adjustment space.
OBV: Volume Slowing, Capital Inflow Slowing
Although the OBV indicator remains in an upward trend, its growth rate is slowing, indicating a weakening capital inflow. If the OBV continues to decline, it may trigger an increase in market selling sentiment. Market chip distribution: $97,000 as a key defense line.
From the market chip distribution perspective, the $97,000-$97,500 area is a recent accumulation zone for major funds. If this area is breached, the market may seek further support at $96,300-$95,000. Additionally, there is a significant accumulation of sell orders in the $98,000-$99,000 range, which may form strong resistance in the short term. Without a substantial breakout, it will be difficult to maintain stability.
Short-Term Trend Prediction and Trading Strategy
In summary, Bitcoin is currently in a bearish oscillation state, with the market still searching for a directional breakout.
Short-Term Bullish Scenario (Probability 40%): If Bitcoin can break above $98,500 and hold, the short-term trend will strengthen, targeting $99,000-$100,000. Attention should be paid to whether the trading volume increases during the breakout process; if there is a volume surge, it may enter a new upward trend.
Short-Term Bearish Scenario (Probability 60%): If Bitcoin falls below $97,000, the market may enter a correction phase, with short-term support looking towards $96,300-$95,000. If there is a volume decline, it may further test the $95,000 level.
Cautious Observation, Focus on Key Level Breakthroughs
Bitcoin is currently experiencing high-level volatility, with short-term market sentiment being cautious. Investors should closely monitor the breakout situation in the $97,000-$98,500 range. If there is a volume breakout above $98,500, consider following the trend to go long, targeting $99,000-$100,000; if it falls below $97,000, be wary of correction risks and pay attention to buying conditions in the $96,300-$95,000 support area.
Key reference points:
- Support levels: $97,000, $96,300, $95,000
- Resistance levels: $98,500, $99,000, $100,000
- Operational advice: Be cautious in the short term, waiting for a directional breakout before making trading arrangements.
The Bitcoin market is still in a tug-of-war between bulls and bears. It is recommended that investors strictly control risks, set reasonable stop-losses, and patiently wait for the market to provide clear signals.
Disclaimer: The above content does not constitute investment advice.
AiCoin Official Website: www.aicoin.com
Telegram: t.me/aicoincn
Twitter: x.com/AiCoinzh
Email: support@aicoin.com
Group Chat: Customer Service Yingying、Customer Service KK
免责声明:本文章仅代表作者个人观点,不代表本平台的立场和观点。本文章仅供信息分享,不构成对任何人的任何投资建议。用户与作者之间的任何争议,与本平台无关。如网页中刊载的文章或图片涉及侵权,请提供相关的权利证明和身份证明发送邮件到support@aicoin.com,本平台相关工作人员将会进行核查。


